Disclaimer: Information found on CryptoreNews is those of writers quoted. It does not represent the opinions of CryptoreNews on whether to sell, buy or hold any investments. You are advised to conduct your own research before making any investment decisions. Use provided information at your own risk.
CryptoreNews covers fintech, blockchain and Bitcoin bringing you the latest crypto news and analyses on the future of money.
A significant movement in an asset class draws in traders, whereas stagnant price movements lead investors to remain on the sidelines. Bitcoin (BTC) has primarily been confined to a range over the last few months, which may contribute to the decline in spot volumes. Bloomberg noted on Oct. 11 that Coinbase’s spot trading volume fell by 52% in Q3 2023 compared to Q3 2022.
Although the near-term outlook remains unclear, traders must stay vigilant as prolonged consolidations typically precede dramatic price movements. The challenge lies in accurately predicting the breakout direction. Given that bulls have consistently prevented Bitcoin from dropping below $25,000 in recent months, the chances of an upward breakout appear to be increasing.
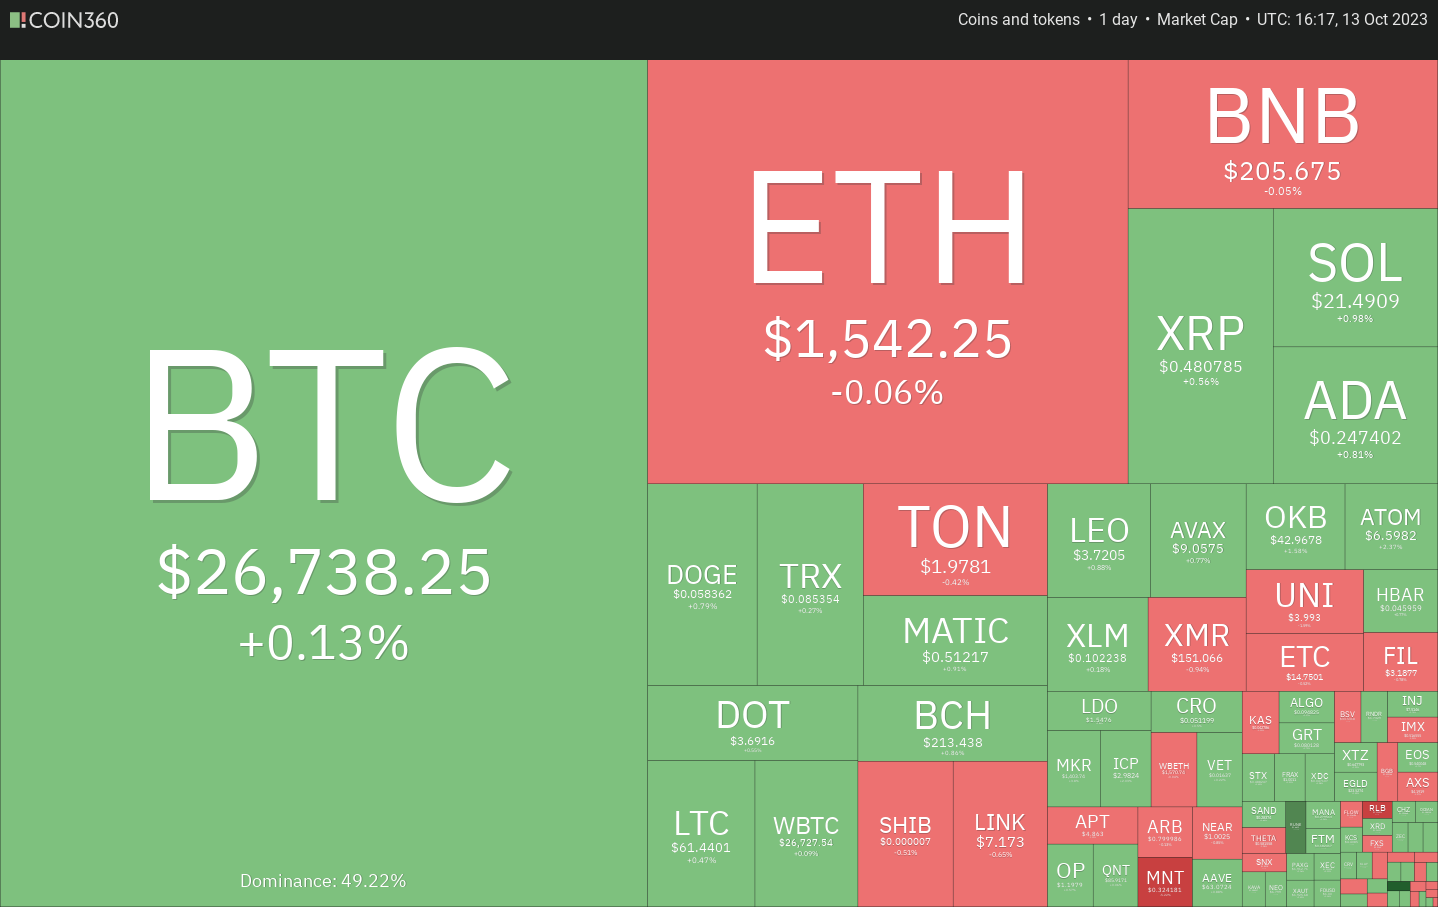 Daily cryptocurrency market performance. Source: Coin360
Investment icon Paul Tudor Jones expressed in a recent CNBC interview that he holds a bearish view on the stock markets, citing the potential escalation of the Israel–Hamas conflict as a factor that could trigger risk-off sentiment. He suggested that this scenario would favor gold and Bitcoin.
Will the bears drive Bitcoin below the immediate support, and could that lead to further declines? Let’s examine the charts of the top 10 cryptocurrencies to uncover the details.
Bitcoin price analysis
On Oct. 11, Bitcoin pierced through the 20-day exponential moving average ($27,148), but the bears were unable to pull the price below the 50-day simple moving average ($26,634).
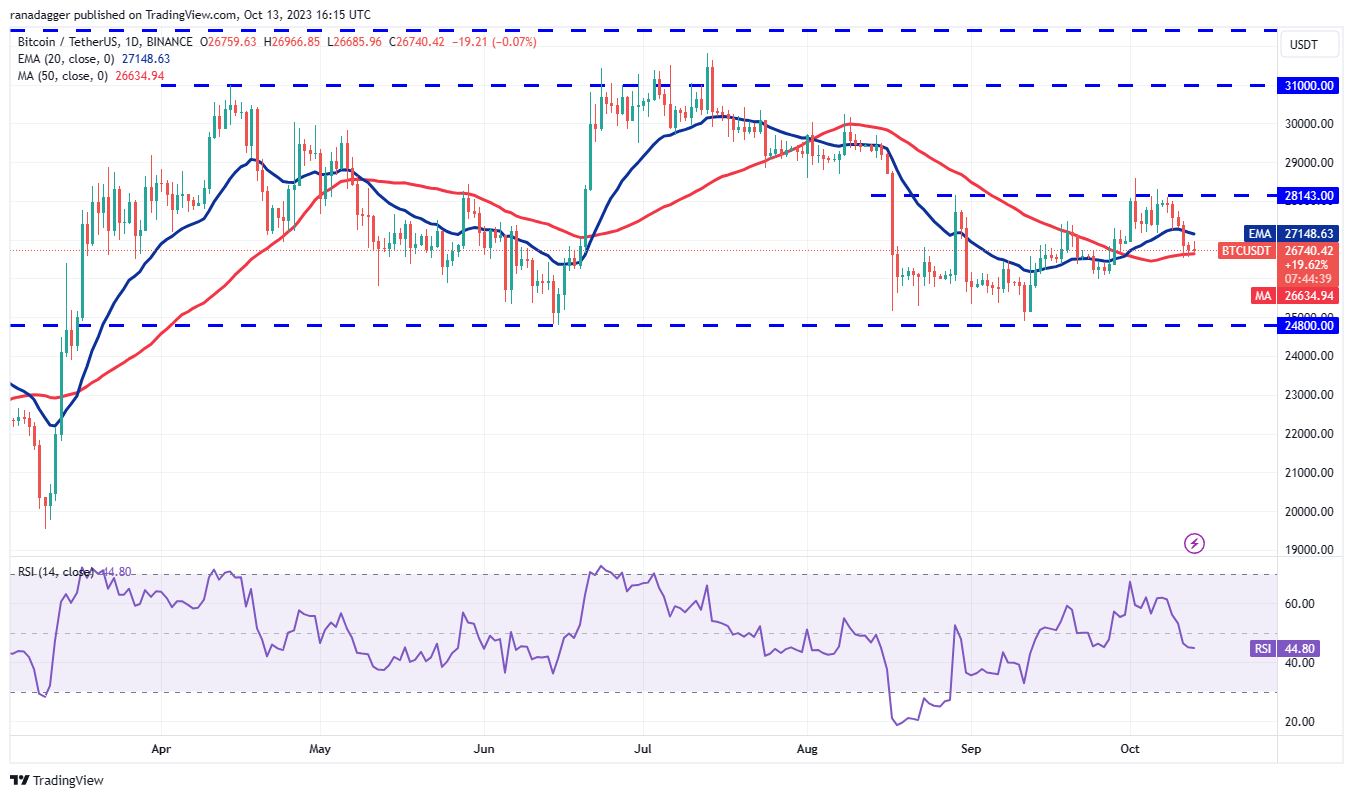 BTC/USDT daily chart. Source: TradingView
The bulls successfully defended the 50-day SMA on Oct. 11 and Oct. 12, yet they are facing challenges in initiating a rebound. This indicates a lack of demand at elevated levels.
The bears will next aim to push the price below the 50-day SMA and seize control. If this support fails, the BTC/USDT pair may revisit the significant support at $26,000, which is likely to attract robust buying from the bulls.
A rally above the 20-day EMA would serve as the initial sign of strength. The pair could then ascend to the formidable overhead resistance at $28,143. This level is crucial to monitor, as a close above it might indicate the onset of a short-term upward movement.
Ether price analysis
On Oct. 12, Ether (ETH) fell to the crucial support at $1,531, but a minor positive development is that the bulls managed to hold this level.
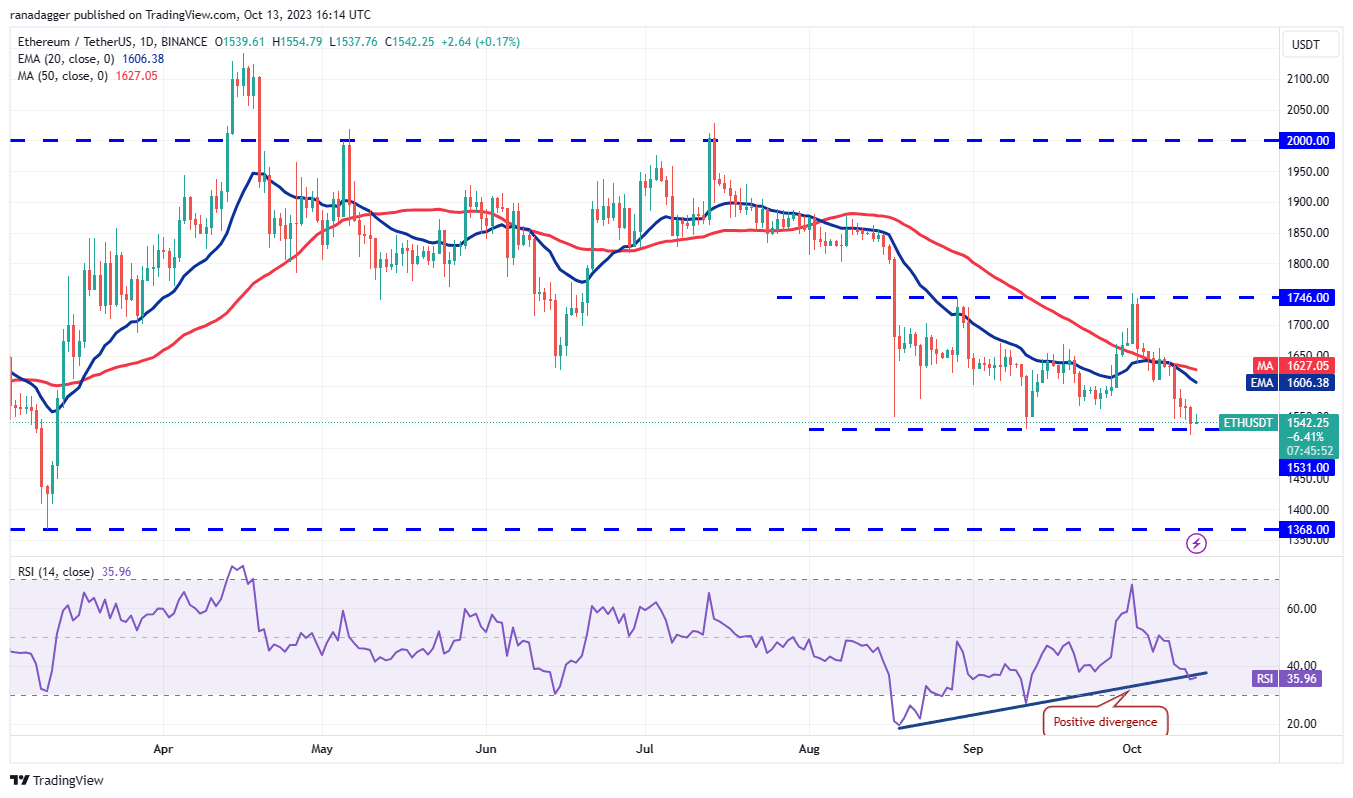 ETH/USDT daily chart. Source: TradingView
The RSI is indicating a positive divergence, suggesting that bearish momentum may be diminishing. The bulls will attempt to elevate the price toward the moving averages, where the bears are likely to mount a strong defense once more.
If the price sharply declines from the 20-day EMA ($1,606), it will imply that the bears are still in control. The ETH/USDT pair could then drop below $1,531 and begin a descent toward $1,368.
To avert this decline, the bulls must push the price above the moving averages. The pair may then ascend to $1,746, where the bulls might encounter significant selling pressure from the bears.
BNB price analysis
BNB (BNB) retraced to the strong support at $203, but the long tail on the candlestick indicates that the bulls are vigorously defending this level.
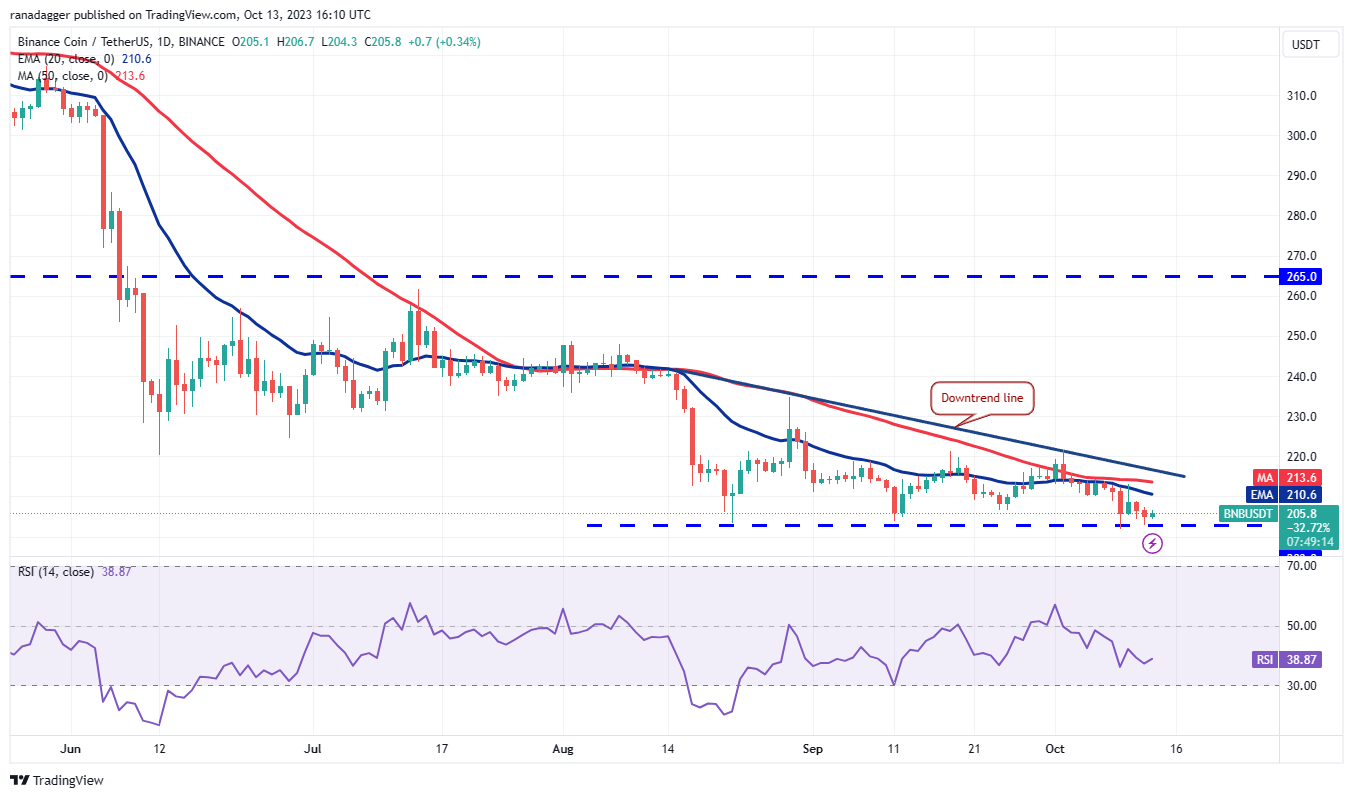 BNB/USDT daily chart. Source: TradingView
The bulls need to quickly propel the price above the moving averages and the downtrend line to demonstrate that the bears may be losing their grip. The BNB/USDT pair could then initiate an upward movement to $235 and subsequently to $250.
<pConversely, if the price declines from the moving averages, it will suggest that every minor uptick is being sold off. A break below the $203 support will complete a descending triangle pattern, possibly initiating a downward move to $183.
XRP price analysis
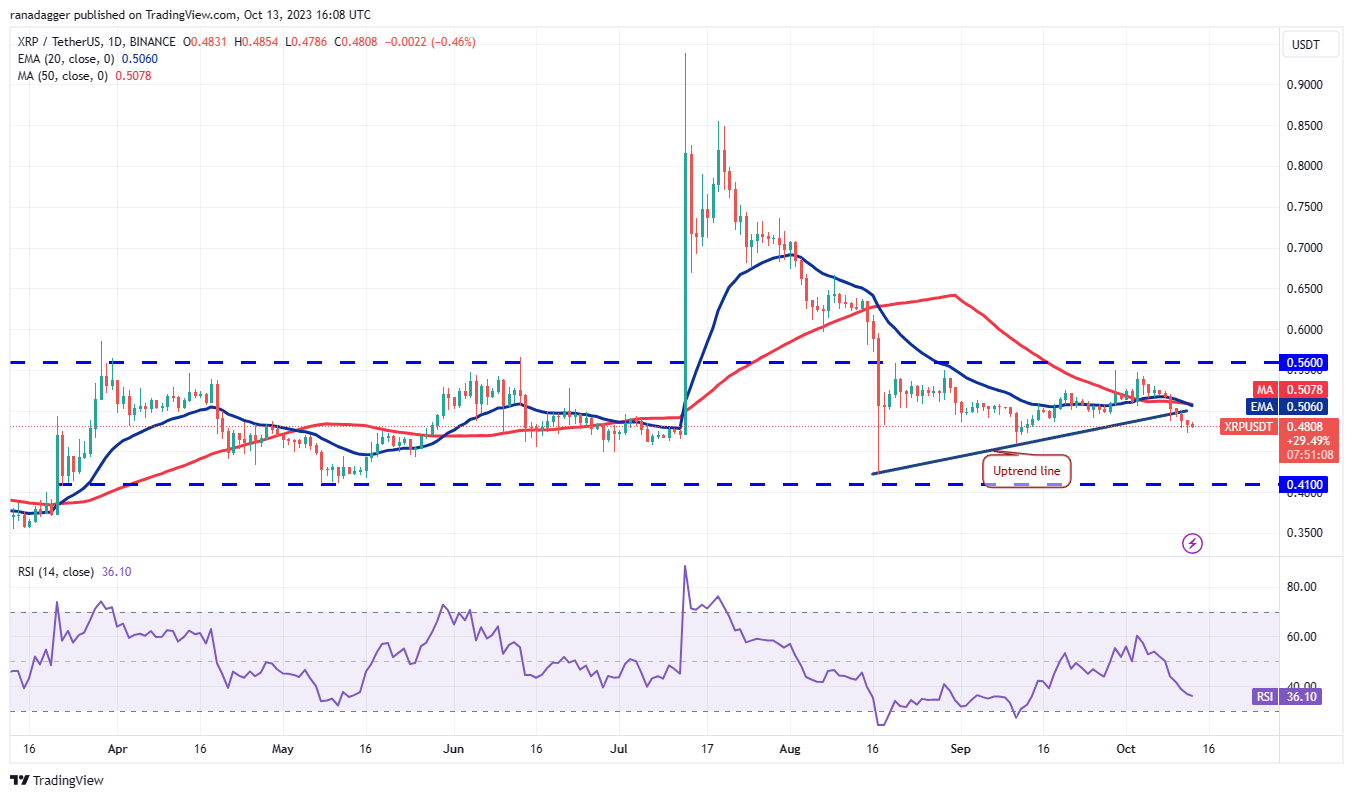
XRP (XRP) fell below the uptrend line on Oct. 11, indicating a reduction in bullish pressure. The drop suggests that the price will continue to fluctuate between $0.41 and $0.56 for some time.
 XRP/USDT daily chart. Source: TradingView
There is support at $0.46, but if it breaks, the XRP/USDT pair may plunge to the crucial level at $0.41. The bulls are anticipated to buy this dip aggressively, which could help maintain the range-bound action.
On the upside, a break and close above the moving averages will serve as the initial indication of strength. The buyers would then make another attempt to push the price to the overhead resistance at $0.56. A break and close above this level would signify the beginning of a new potential uptrend.
Solana price analysis
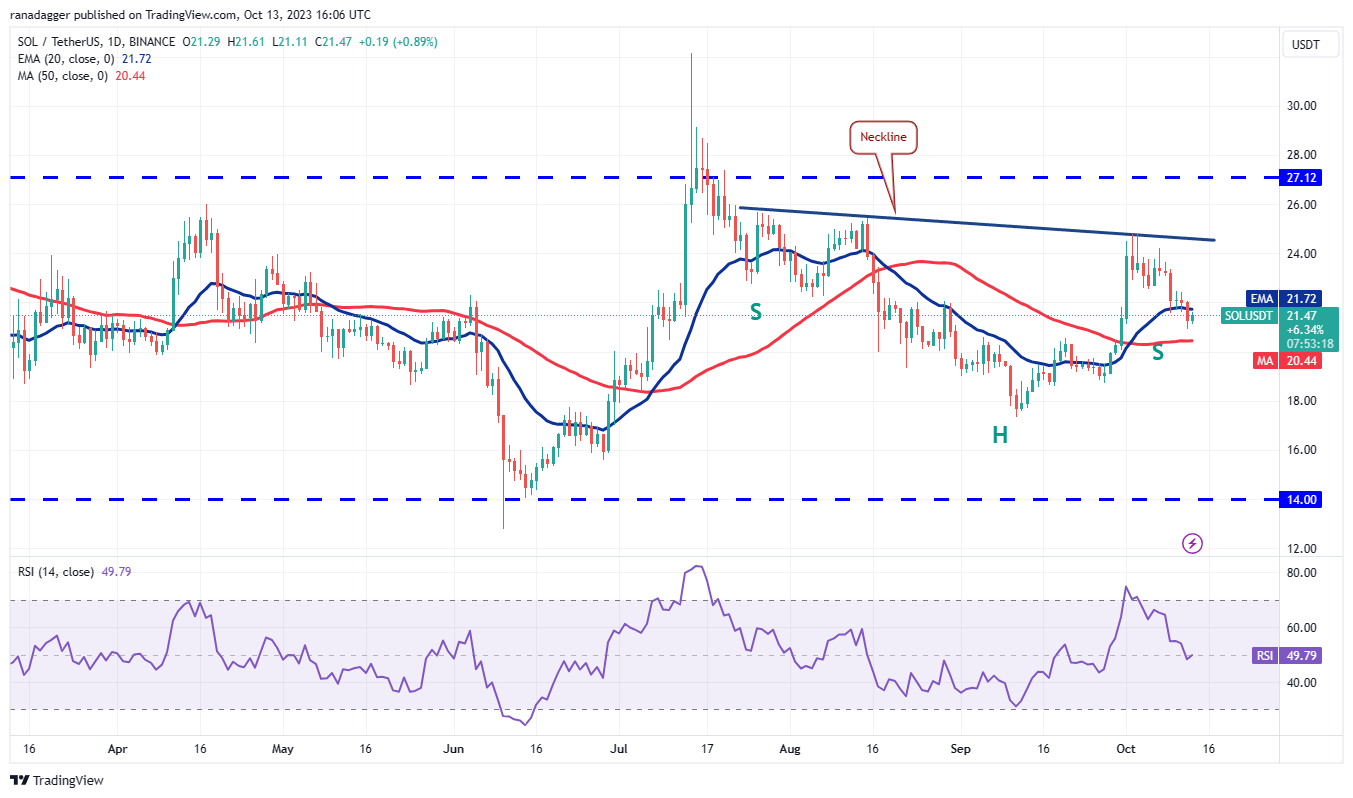
Solana (SOL) dropped below the 20-day EMA ($21.72) on Oct. 12, indicating that the bears are sustaining their pressure.
 SOL/USDT daily chart. Source: TradingView
Related Posts
Both moving averages have leveled off, and the RSI is near the midpoint, indicating an equilibrium between supply and demand. The bears will attempt to bolster their position by dragging the price below the 50-day SMA ($20.44). If successful, the SOL/USDT pair could fall to $17.33.
Conversely, if the price rises and exceeds $22.50, it will shift the short-term advantage in favor of the buyers. The pair could then ascend to the neckline of the inverse head and shoulders pattern.
Cardano price analysis
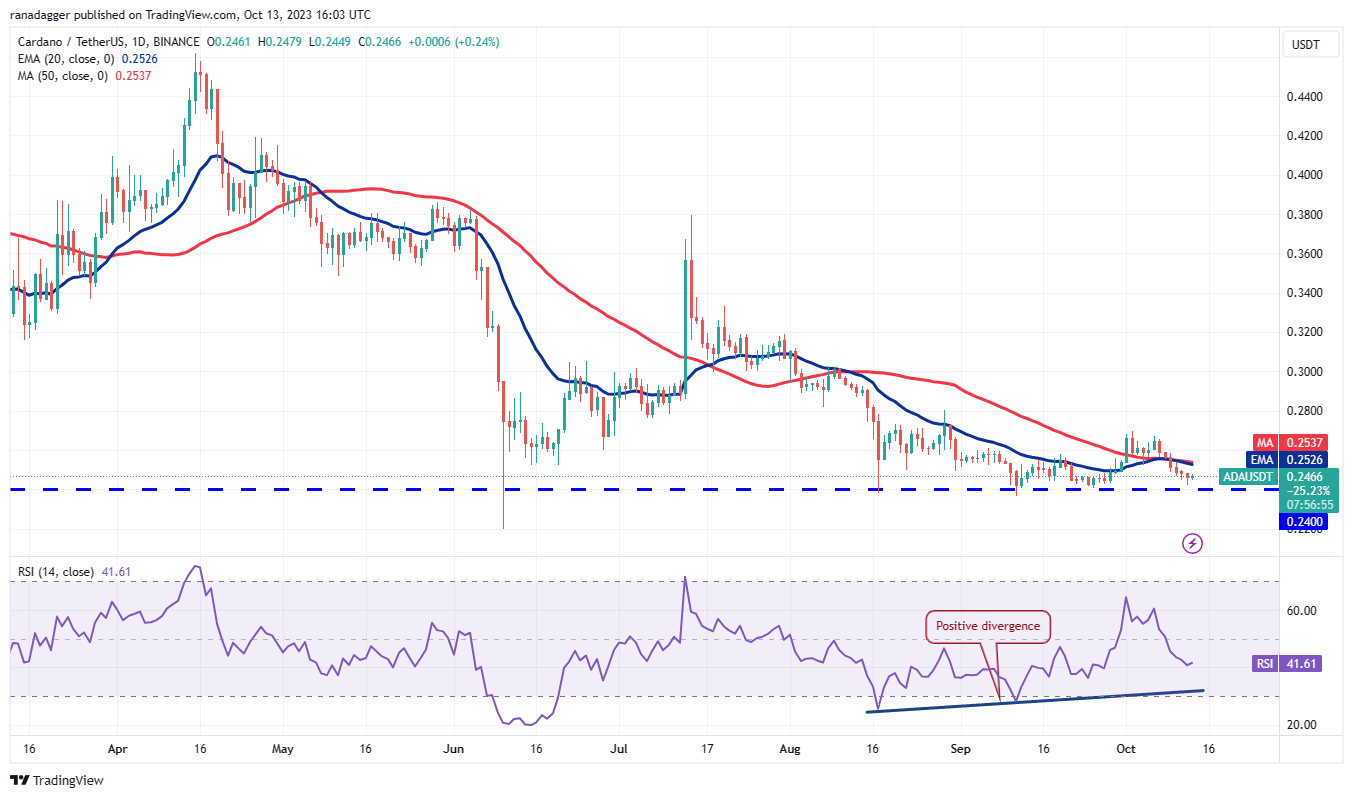
Cardano (ADA) has developed long tails on consecutive candlesticks since Oct. 9, yet the bulls have not managed to initiate a recovery. This indicates a lack of demand at higher levels.
 ADA/USDT daily chart. Source: TradingView
The ADA/USDT pair is near the $0.24 support, and the RSI is showing signs of a positive divergence. This suggests that selling pressure is easing, making a relief rally possible. The first target on the upside is likely to be the moving averages. If this resistance is surpassed, the pair may reach $0.27 and then $0.28.
In contrast, if the price continues to decline and falls below $0.24, it will indicate that the bears are unwilling to give in. This could pave the way for a drop to $0.22 and ultimately to $0.20.
Dogecoin price analysis
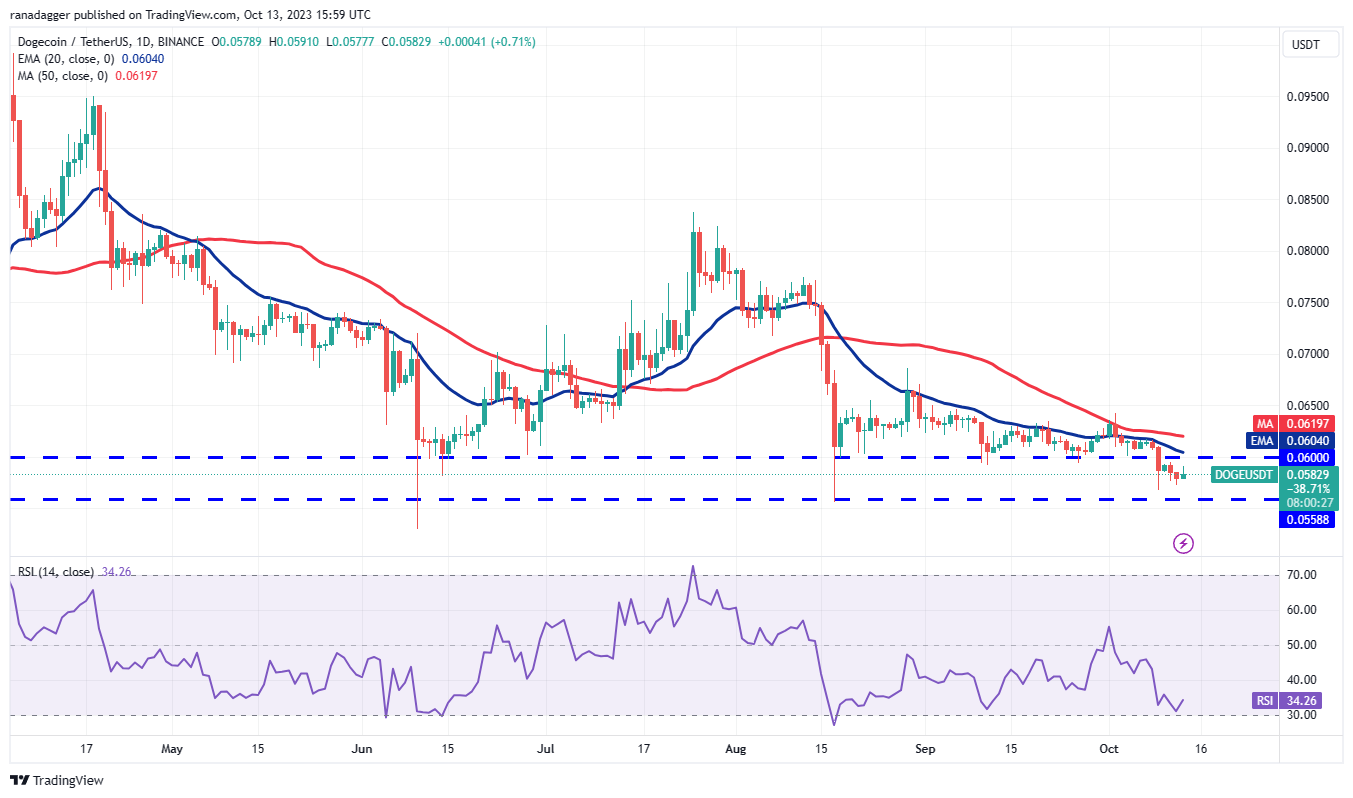
Dogecoin (DOGE) has been trading below the $0.06 support since Oct. 9, suggesting that the markets have accepted these lower levels.
 DOGE/USDT daily chart. Source: TradingView
The bears will try to push the price down to the crucial support at $0.055. This level is likely to see strong buying from the bulls. If the price bounces off this support, the DOGE/USDT pair may consolidate between $0.055 and $0.06 for a period.
The downward-sloping moving averages and the RSI nearing the oversold zone suggest that the bears hold the upper hand. If the bulls aim to stage a comeback, they must rapidly drive the price above the moving averages. This could initiate a recovery to $0.07.
Related: Why is Bitcoin price stuck?
Toncoin price analysis
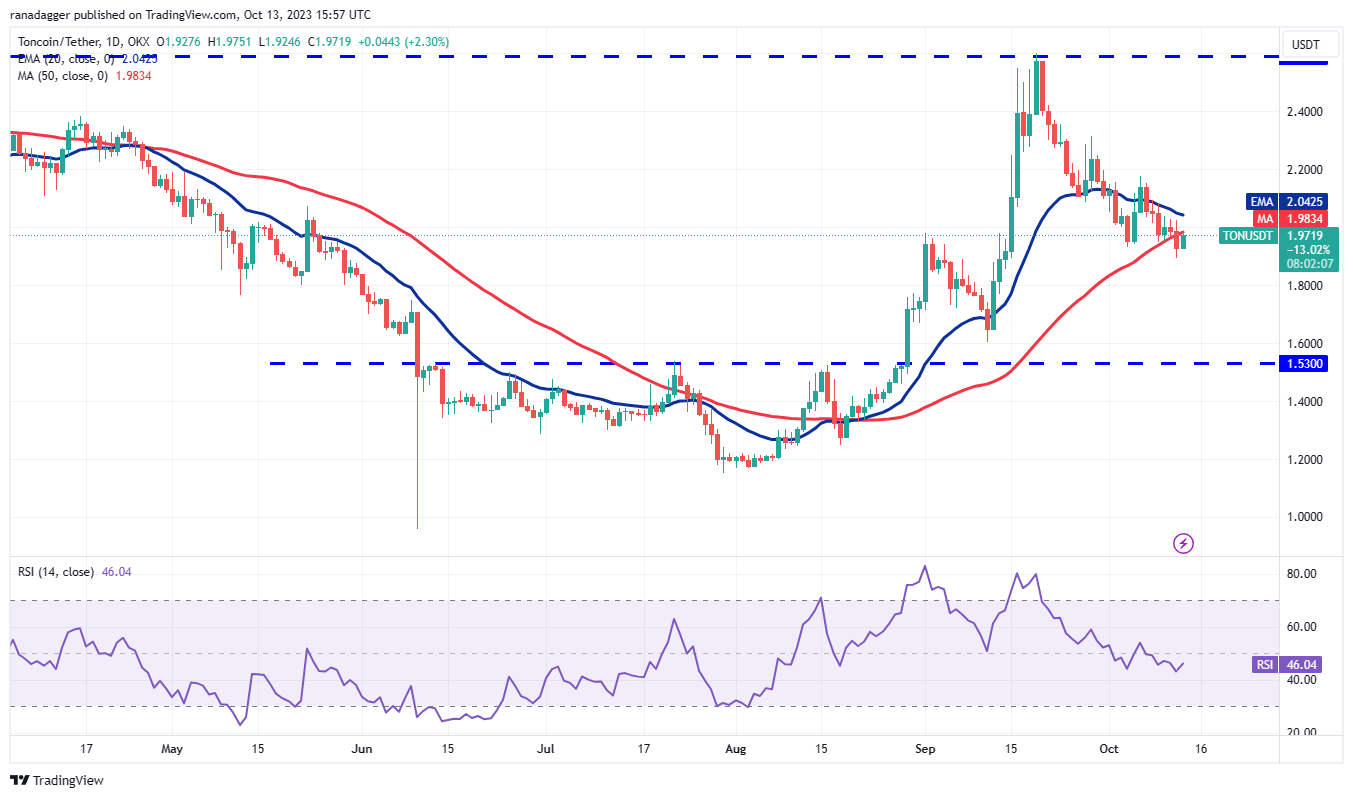
Toncoin (TON) has been undergoing a corrective phase over the last few days. Profit-taking by traders pushed the price below the 50-day SMA ($1.98) on Oct. 12.
 TON/USDT daily chart. Source: TradingView
The bulls are working to reclaim this level and propel the price back above the moving averages in the coming days. If they succeed, it would indicate that the drop below the 50-day SMA may have been a bear trap. This could pave the way for a potential rise to $2.31.
Alternatively, if the TON/USDT pair declines from the moving averages, it will imply that sentiment has turned negative and that every relief rally is being sold off. This will increase the risk of a fall to $1.60.
Polkadot price analysis
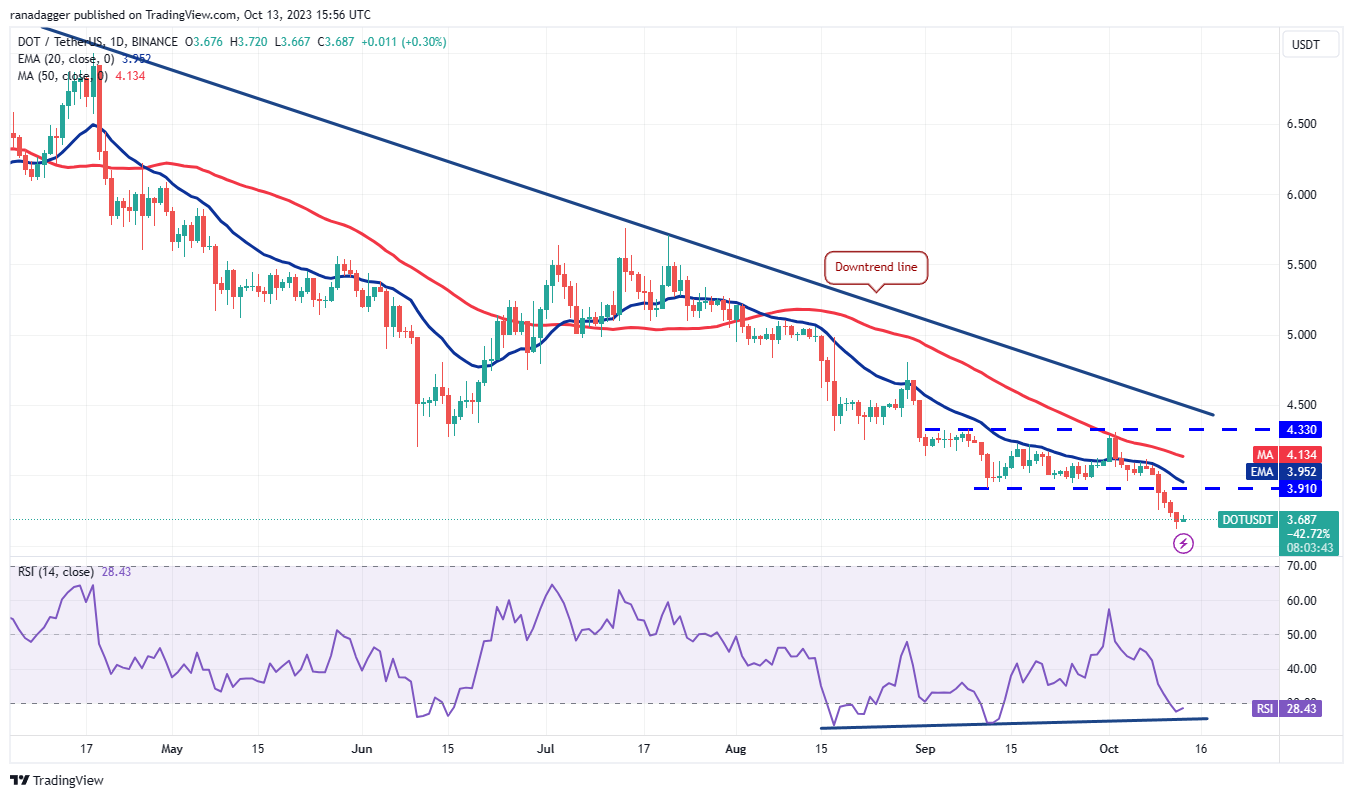
Polkadot (DOT) has continued its downward trend in recent days, reaching close to the target objective of $3.50 on Oct. 12. This level is expected to serve as strong support.
 DOT/USDT daily chart. Source: TradingView
On the way up, the 20-day EMA ($3.95) stands as a key level to monitor. If the price retraces from the 20-day EMA, it will indicate that traders are selling during relief rallies. This could enhance the likelihood of a drop below $3.50.
Conversely, if the bulls manage to push and maintain the price above the 20-day EMA, it will suggest that the markets have rejected lower levels. This may trap aggressive bears, leading to a short squeeze toward the downtrend line.
Polygon price analysis
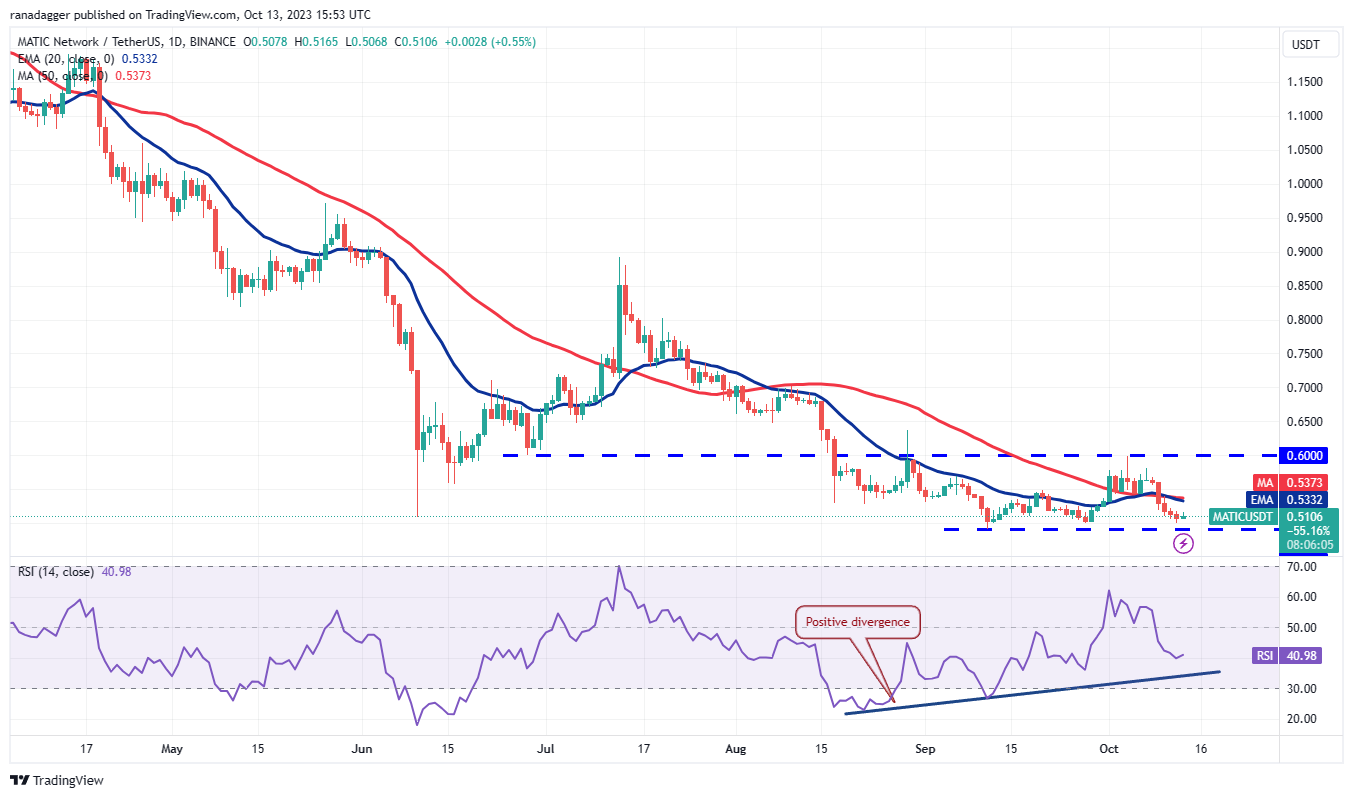
Polygon (MATIC) continues to weaken as it approaches the critical support at $0.49, indicating that bulls are hesitant to buy at higher levels.
 MATIC/USDT daily chart. Source: TradingView
In a range-bound market, traders typically buy near support and sell close to resistance. In this instance, the bulls are likely to vigorously purchase dips to $0.49. If the price rebounds from this level with strength, the MATIC/USDT pair may reach the moving averages.
If the price sharply declines from the moving averages, it will increase the likelihood of a break below $0.49. Should that occur, the pair could plunge to $0.45.
Conversely, a rally above the moving averages will indicate that the range-bound action may persist for a few more days.
This article does not provide investment advice or recommendations. Every investment and trading move carries risk, and readers should conduct their own research before making any decisions.