Disclaimer: Information found on CryptoreNews is those of writers quoted. It does not represent the opinions of CryptoreNews on whether to sell, buy or hold any investments. You are advised to conduct your own research before making any investment decisions. Use provided information at your own risk.
CryptoreNews covers fintech, blockchain and Bitcoin bringing you the latest crypto news and analyses on the future of money.
Bitcoin (BTC) surged by 28.5% in October, marking its second-highest monthly increase of the year, following a 40% surge in January. After this impressive performance in October, investors are left wondering if the bullish trend can persist and if Bitcoin can further its recovery in the future.
Bernstein mentioned in a report on Oct. 31 that Bitcoin might reach $150,000 by 2025. The firm is optimistic that the United States Securities and Exchange Commission will greenlight a spot Bitcoin exchange-traded fund by the first quarter of 2024, which could attract up to 10% of Bitcoin’s circulating supply.
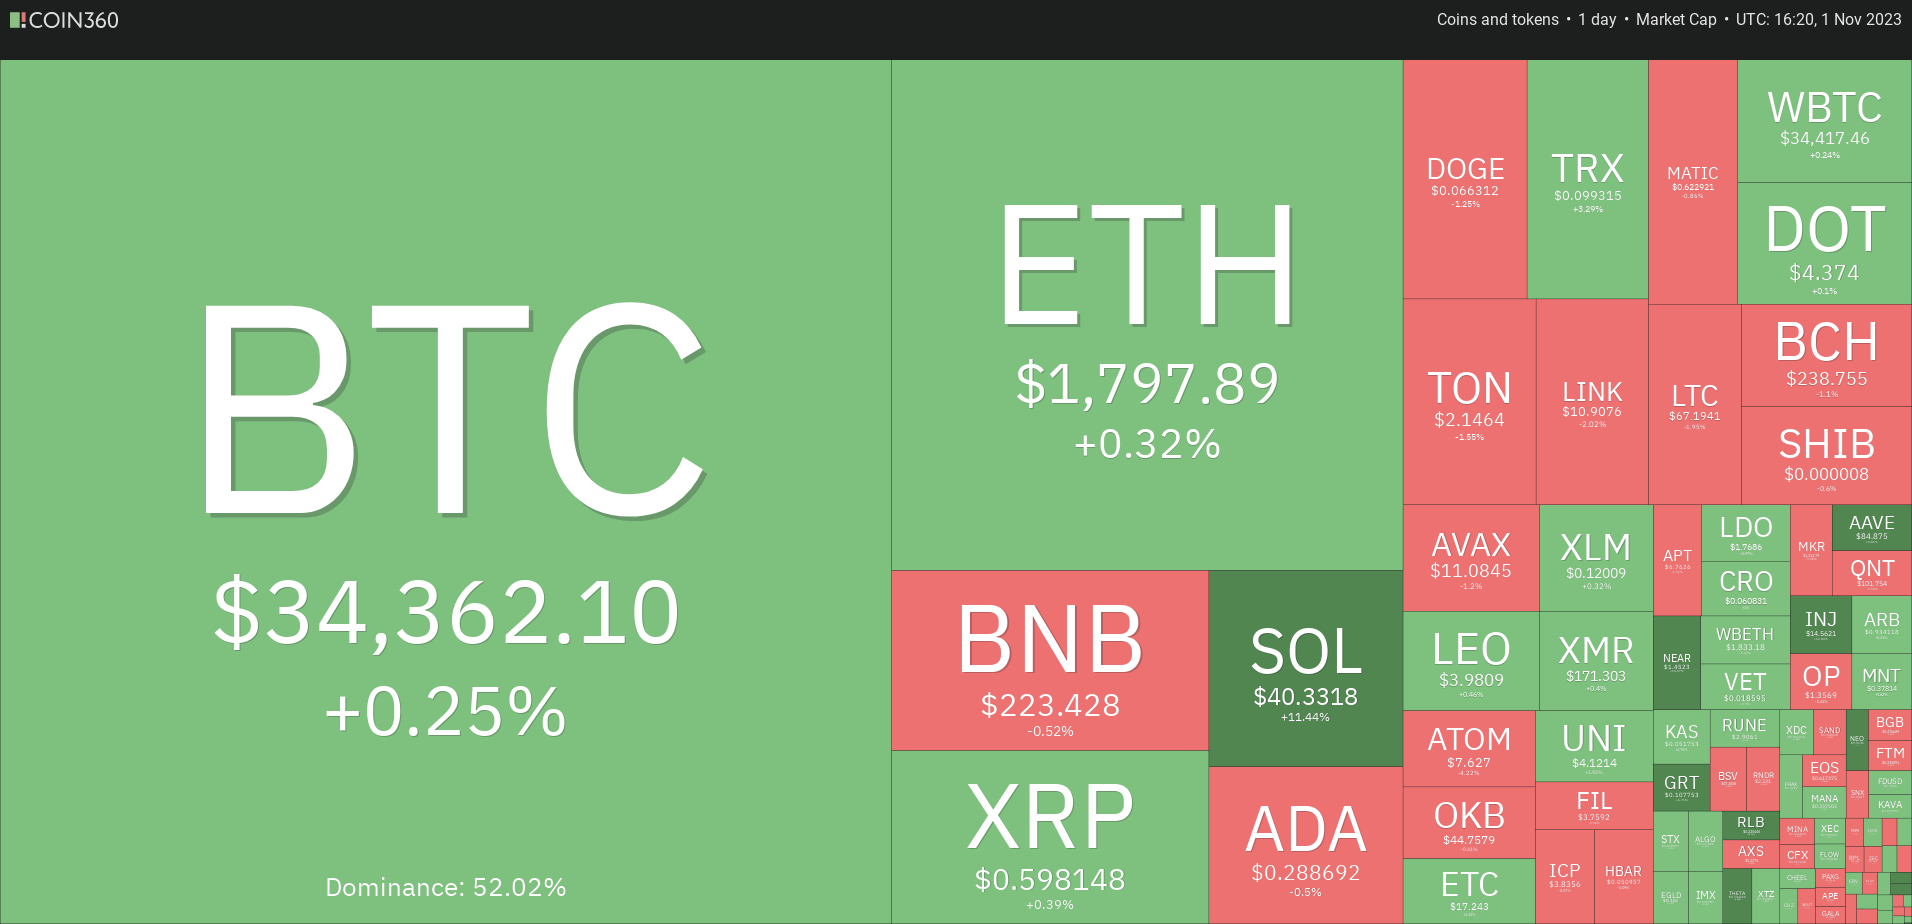
While the long-term outlook appears positive, short-term volatility may increase. On-chain analysis firm Material Indicators suggests that the bullish momentum is fading, which could lead to a retest of $33,000, although they expect an attempt at $36,000 beforehand.
Will Bitcoin rise above or fall below the current range? Could altcoins gain when Bitcoin consolidates?
Let’s examine the charts of the top 10 cryptocurrencies to find out.
Bitcoin price analysis
On Nov. 1, the bulls attempted to push Bitcoin above $35,280, but the bears persisted. This indicates profit-taking at elevated levels.
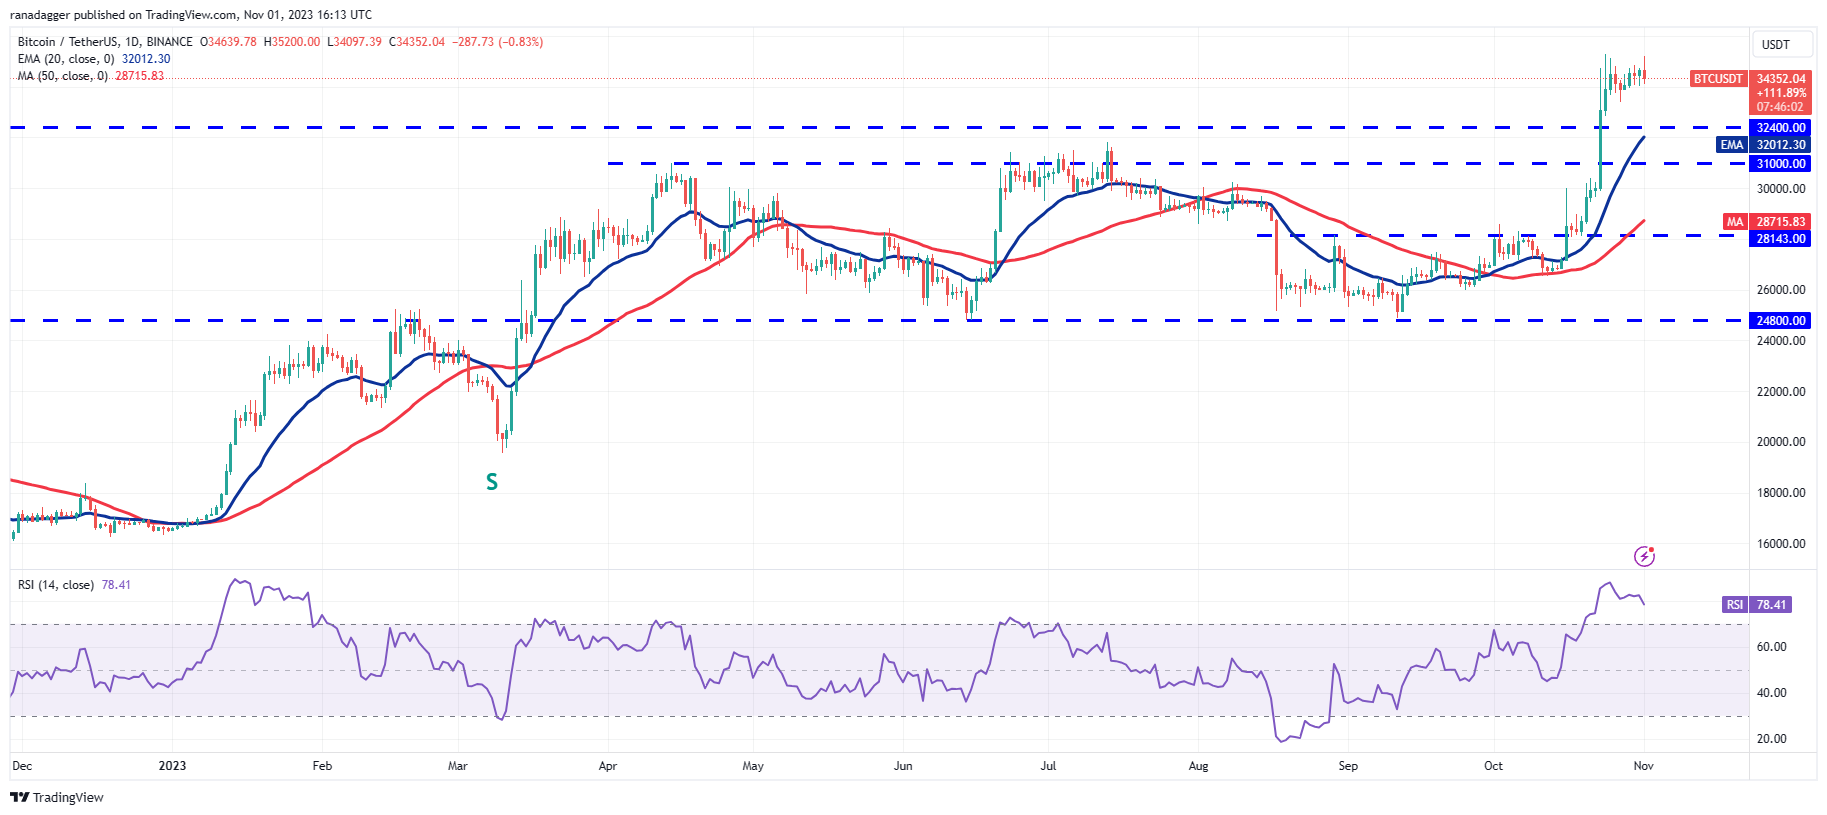
The relative strength index (RSI) remains in the overbought region, suggesting that consolidation may last for several more days. The critical level to monitor on the upside is $35,280, while on the downside, it’s $33,390.
If the price dips below this support, the BTC/USDT pair might fall to the 20-day exponential moving average ($32,012). This level is likely to see a fierce contest between bulls and bears.
Conversely, a break and close above the resistance of $35,280 would indicate the continuation of the uptrend. The pair could then rise to $40,000.
Ether price analysis
Ether (ETH) has maintained its position above the breakout level of $1,746, but the bulls are finding it challenging to initiate the next phase of the uptrend. This suggests that bears are attempting to reestablish control.
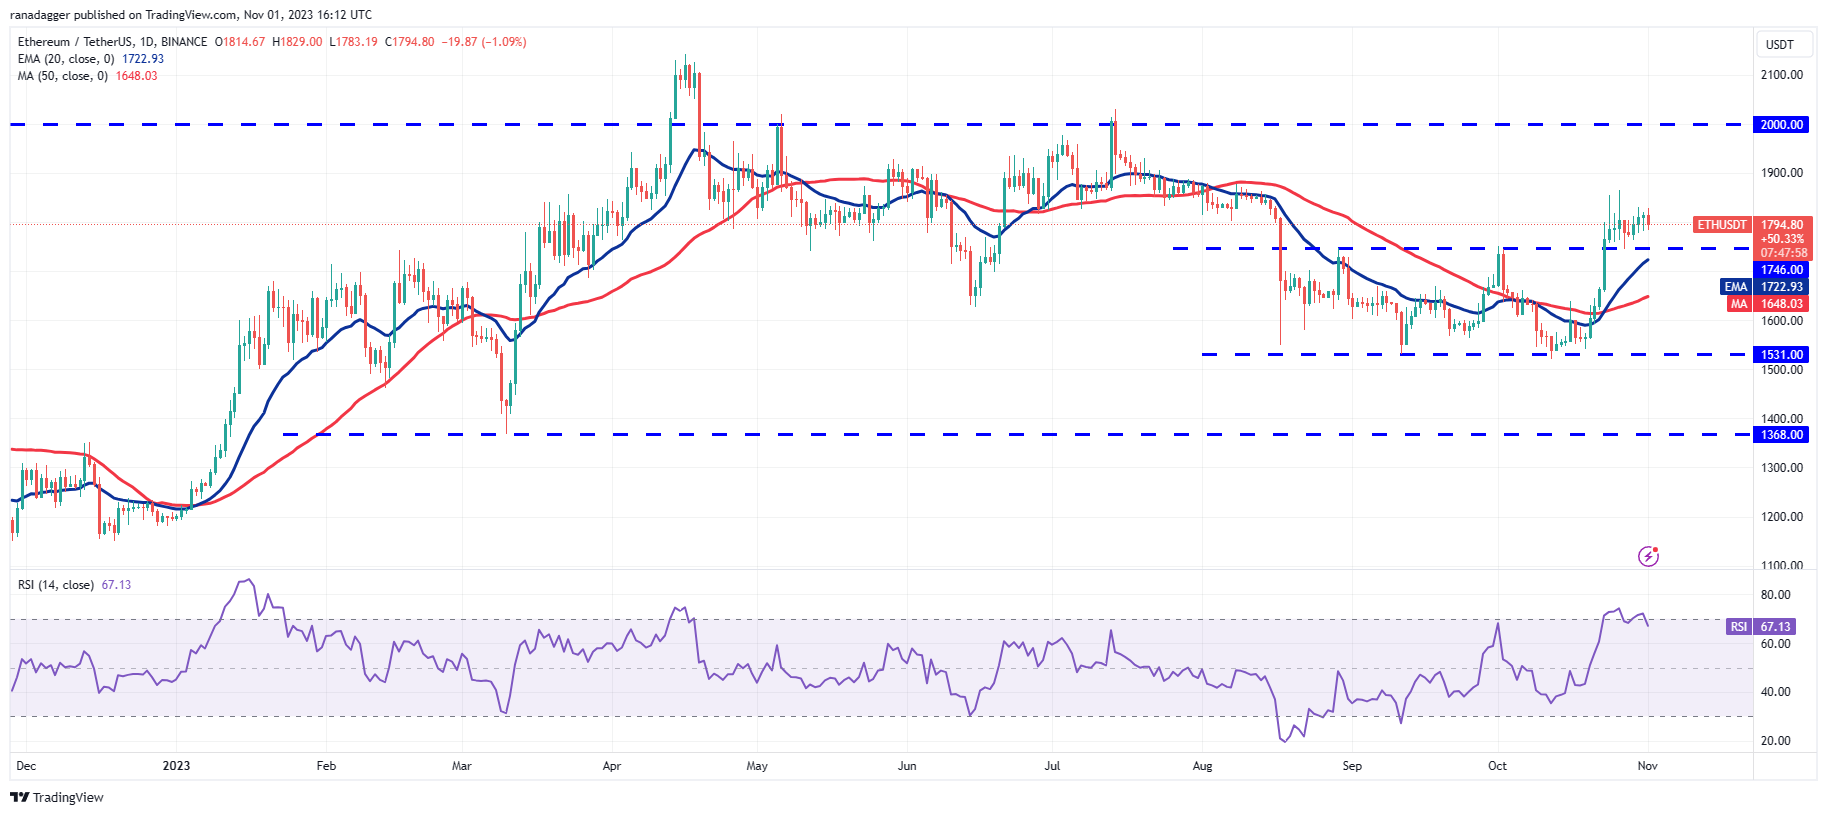
The key downside level to watch is $1,746. If bulls can convert this level into support, it will indicate a shift in sentiment towards the positive. This could enhance the likelihood of breaking above $1,865, with the ETH/USDT pair potentially soaring to $2,000, where bears are expected to mount a strong defense.
If the bears aim to take control, they need to push the price below the 20-day EMA ($1,723). This could catch aggressive bulls off guard, leading to long liquidations and a potential drop to the 50-day SMA ($1,648).
BNB price analysis
The bulls are struggling to keep BNB (BNB) above $230, indicating that buying interest is waning at higher levels.
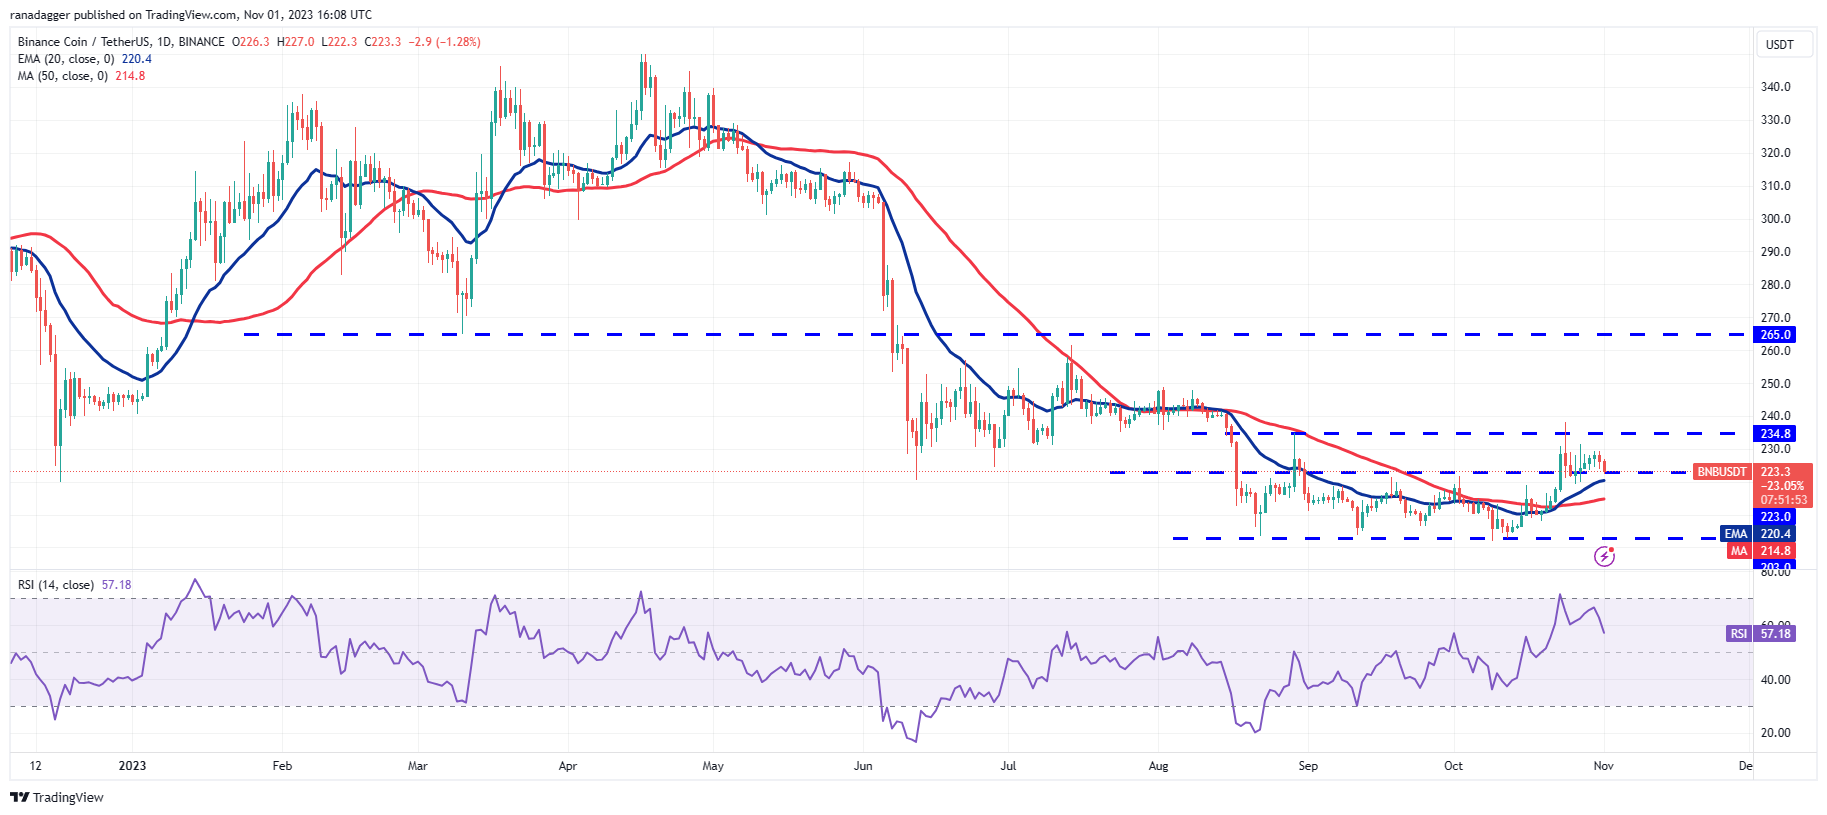
The BNB/USDT pair has declined and reached the breakout level of $223. Buyers are expected to defend the range between $223 and the 20-day EMA ($220). If the price rebounds from this range, bulls will make another attempt to push the pair toward the overhead resistance at $235.
On the other hand, if the price continues to drop and breaks below the 20-day EMA, it would indicate that the bears are regaining control, which could lead to a decline to the 50-day SMA ($214).
XRP price analysis
XRP (XRP) successfully broke and closed above the resistance level of $0.56 on Oct. 30, signaling the beginning of a new upward move.
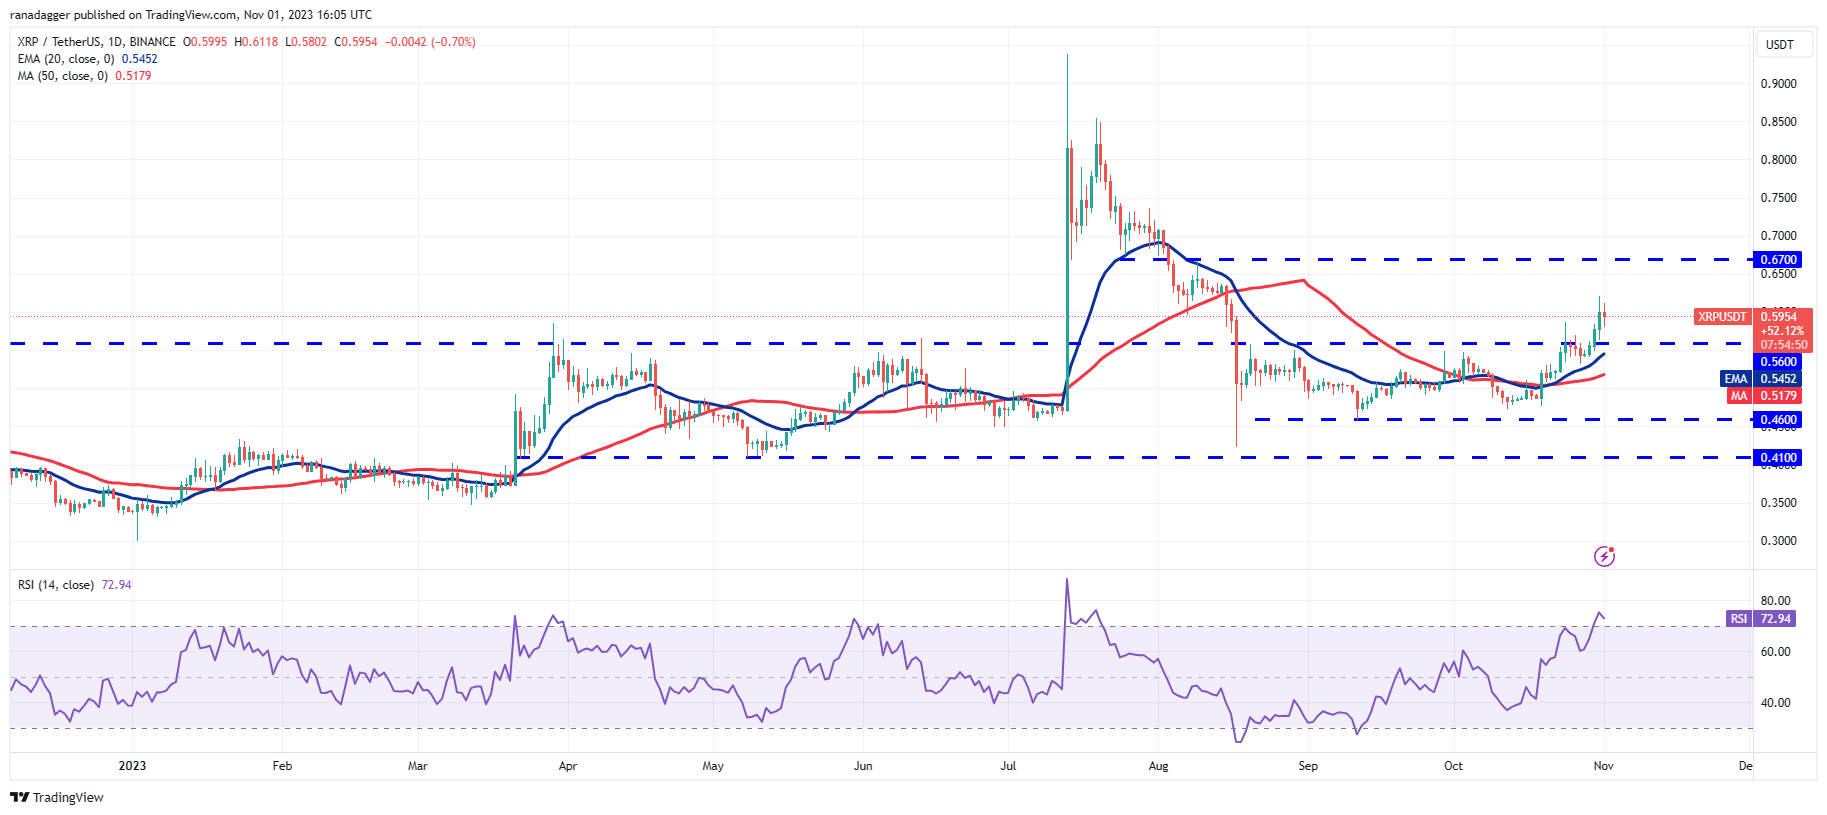
The 20-day EMA ($0.54) is trending upward, and the RSI is in the overbought region, indicating that the bulls possess a slight advantage. Buyers will attempt to capitalize on this lead and drive the price toward $0.67.
In contrast, the bears will aim to push the price back below the breakout level of $0.56 and the 20-day EMA. If they achieve this, the XRP/USDT pair may decline to the 50-day SMA ($0.52).
Solana price analysis
Solana (SOL) has been experiencing a robust recovery. After a brief pause around $34, the bulls asserted their dominance and broke above the resistance on Oct. 30.
Related Posts
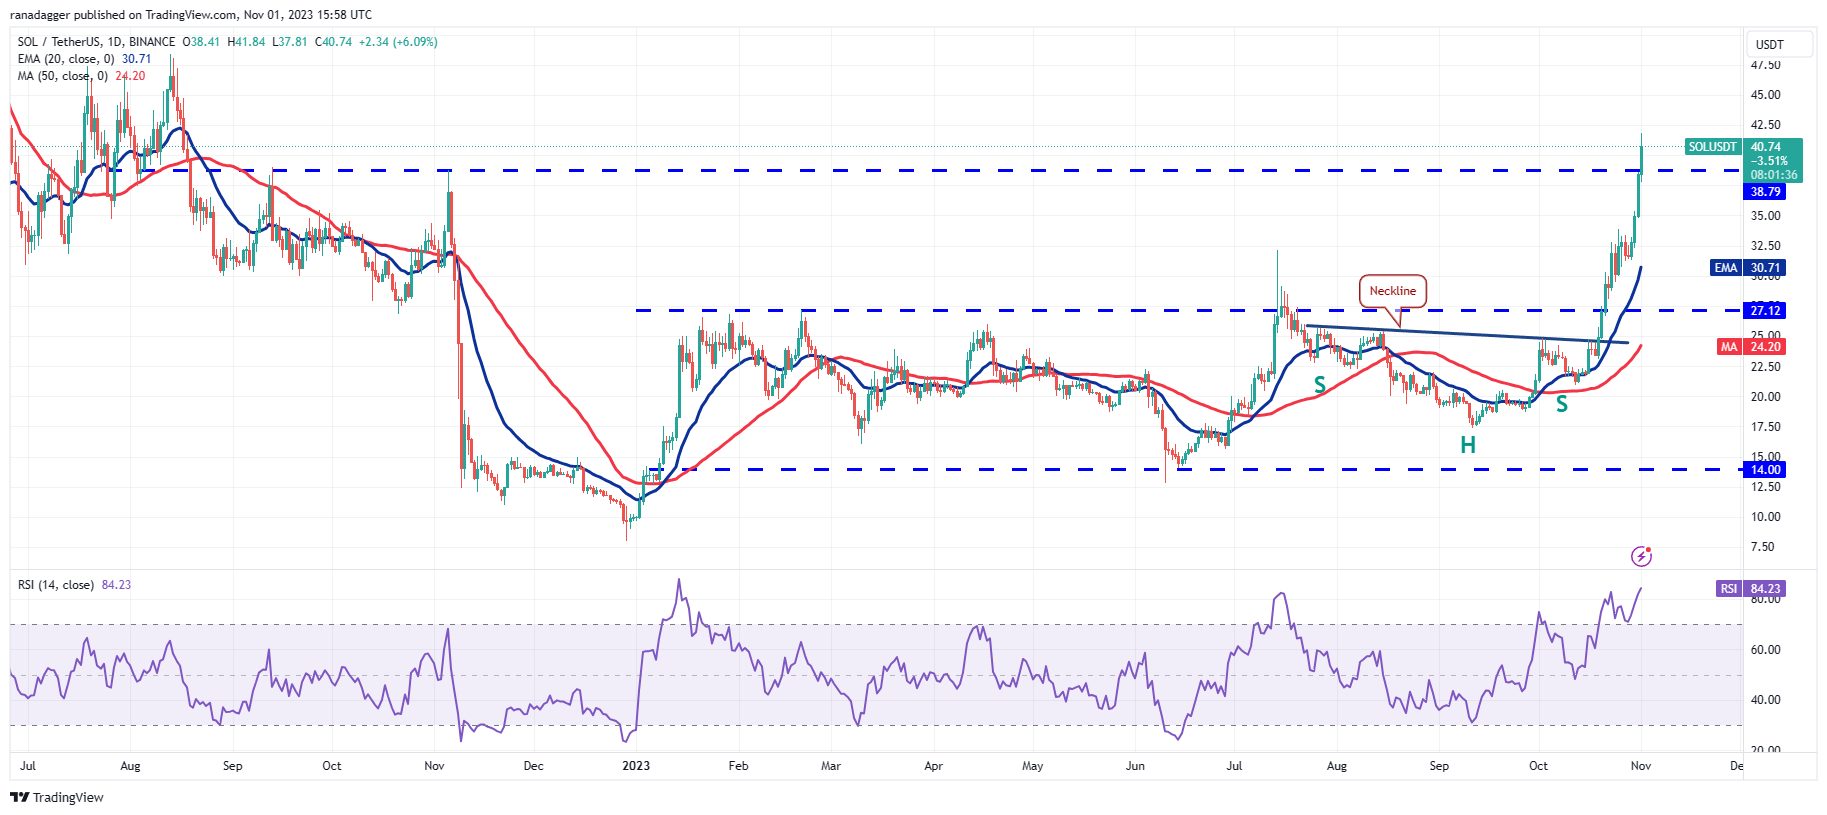
The buying momentum continued, with bulls overcoming the resistance at $38.79 on Nov. 1. If they can maintain the price above $38.79, the SOL/USDT pair may attempt to rally to $48.
Although the trend remains upward, the overbought levels on the RSI suggest that the rally may be overheated in the short term, which could hinder the bulls’ ability to sustain the upward movement. A break and close below $38.79 could prompt short-term traders to take profits, potentially dragging the pair down to $34.
Cardano price analysis
Cardano (ADA) retreated from the minor resistance at $0.30 on Oct. 31, indicating that short-term traders are realizing profits.
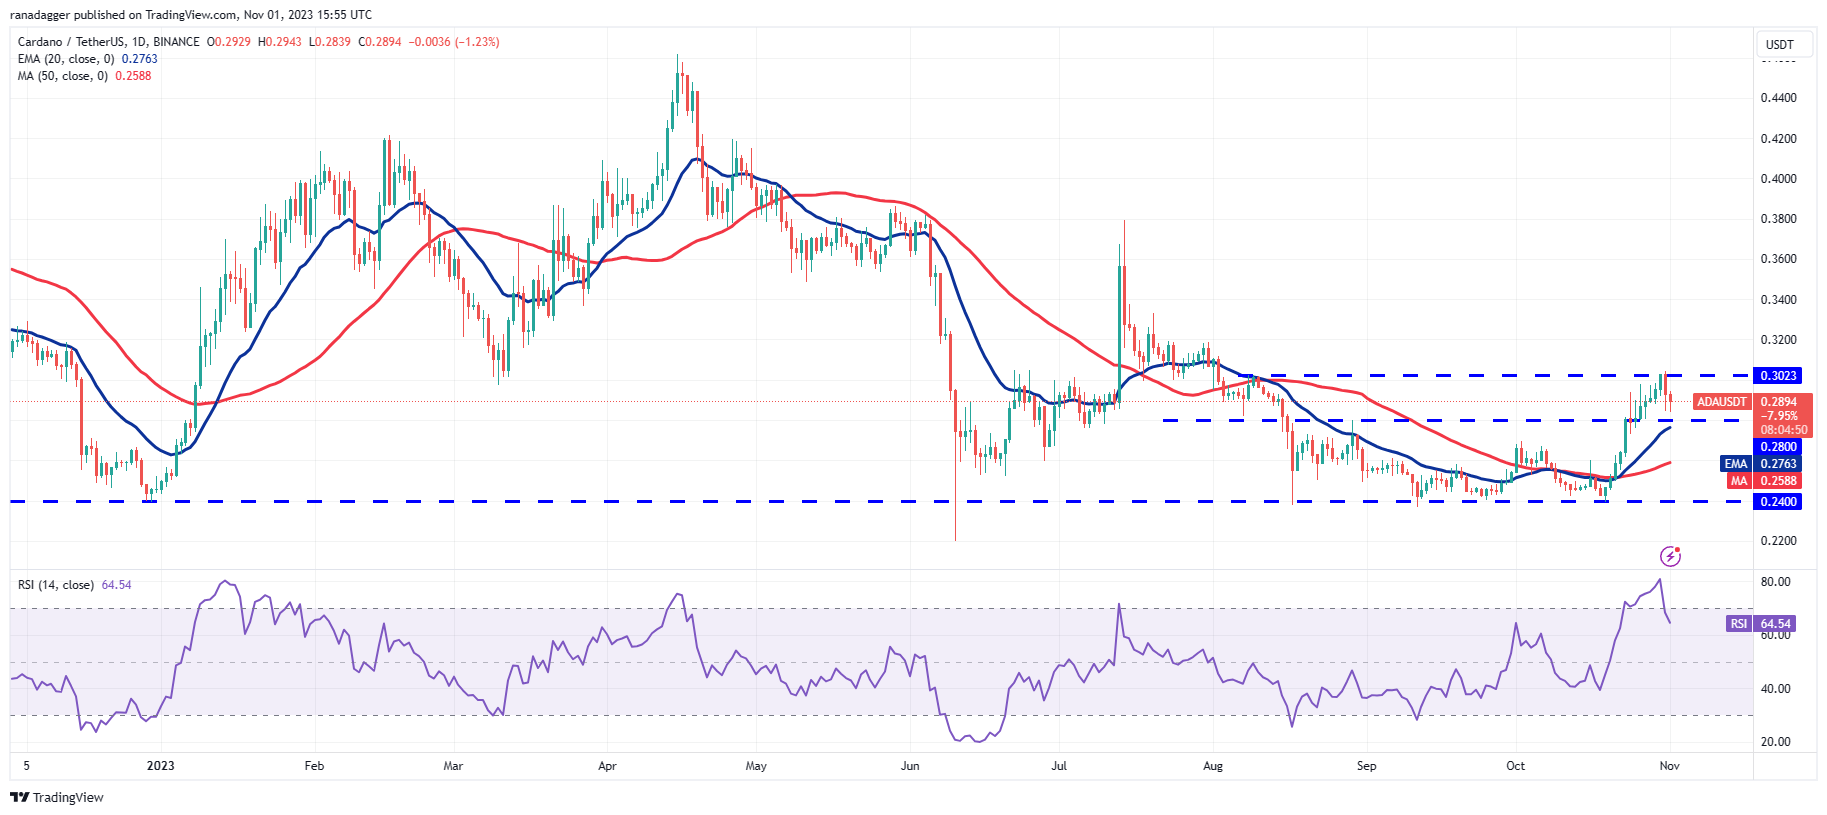
The immediate support on the downside is the 20-day EMA ($0.28), which buyers are expected to defend vigorously. A rebound from this level would imply a positive sentiment, suggesting traders are buying at lower prices, potentially pushing the ADA/USDT pair back to $0.30.
This outlook will be negated if the price continues to decline and falls below the 20-day EMA, indicating that the pair may oscillate between $0.24 and $0.30 for a longer period.
Dogecoin price analysis
The bulls have been facing difficulties in maintaining Dogecoin (DOGE) above the $0.07 resistance, suggesting that higher levels are drawing in sellers.
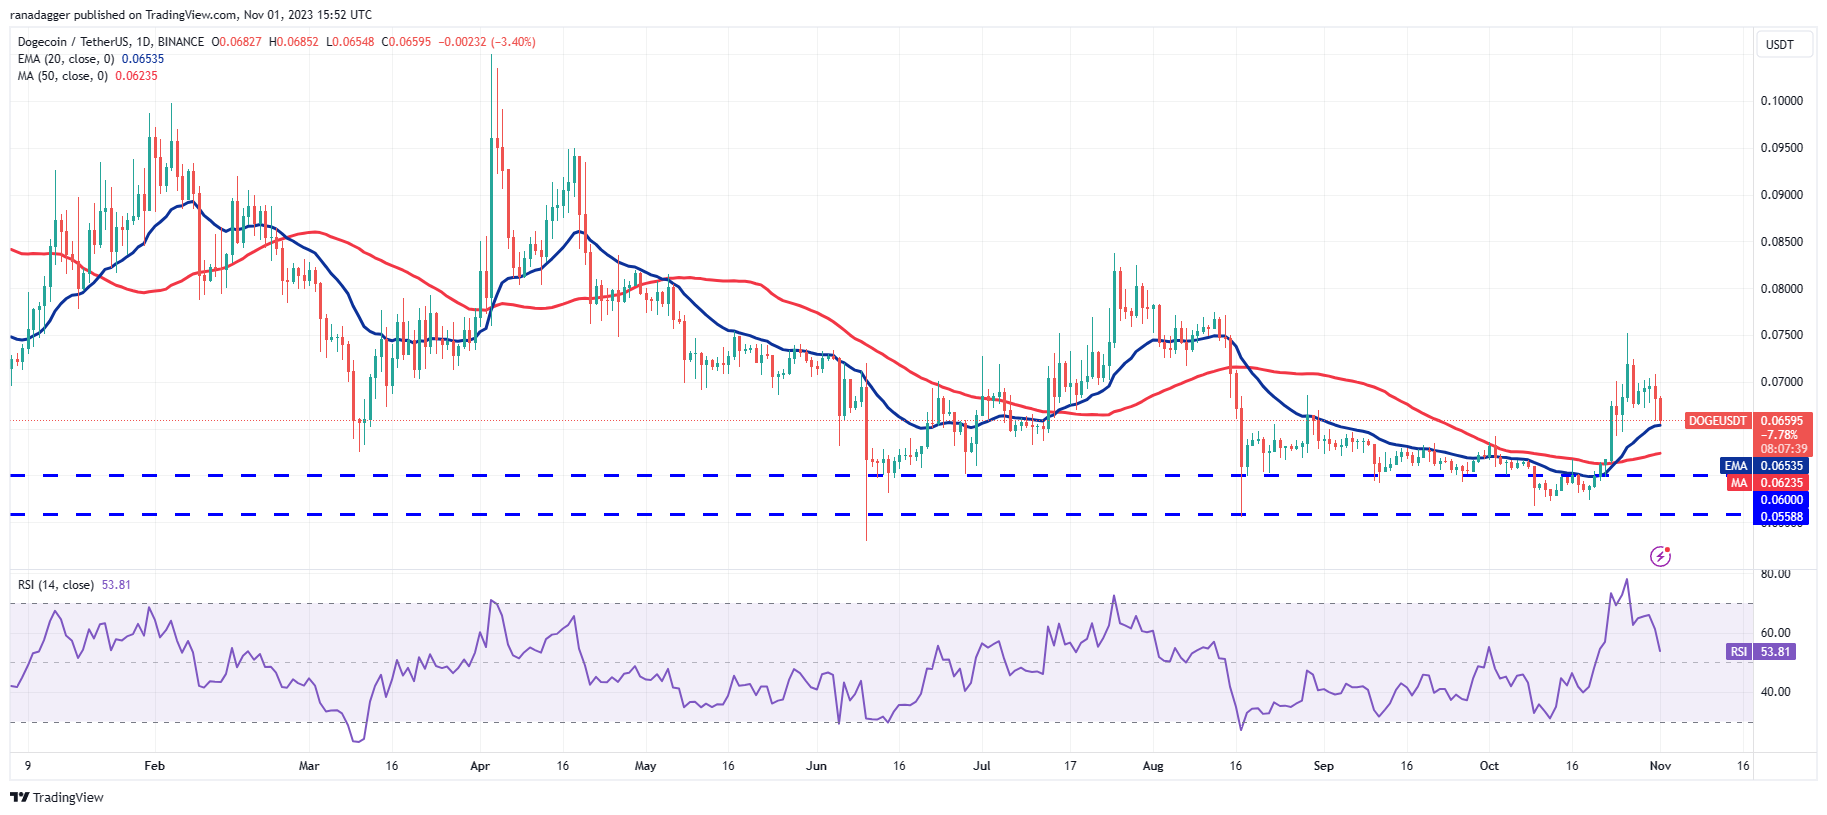
On Oct. 31, the bulls bought the dip to the 20-day EMA ($0.06), as evident from the long tail on the candlestick, but they failed to build on this strength. Sellers are once again attempting to pull the price back below the 20-day EMA. If they succeed, it would indicate that bulls are losing their grip, and the DOGE/USDT pair may then decline toward $0.06.
Alternatively, if the price rebounds off the 20-day EMA with sufficient strength, it would suggest that bulls are buying on dips, prompting them to attempt to break through the overhead resistance at $0.07 and start an upward movement toward $0.08.
Related: Bitcoin crash pre-halving? Stablecoin metric that marked 2019 top flashes warning
Toncoin price analysis
Toncoin (TON) has established a range between $1.89 and $2.31 over the past few days. The price reversed from $2.27 on Oct. 31, indicating that bears are still selling near the resistance.
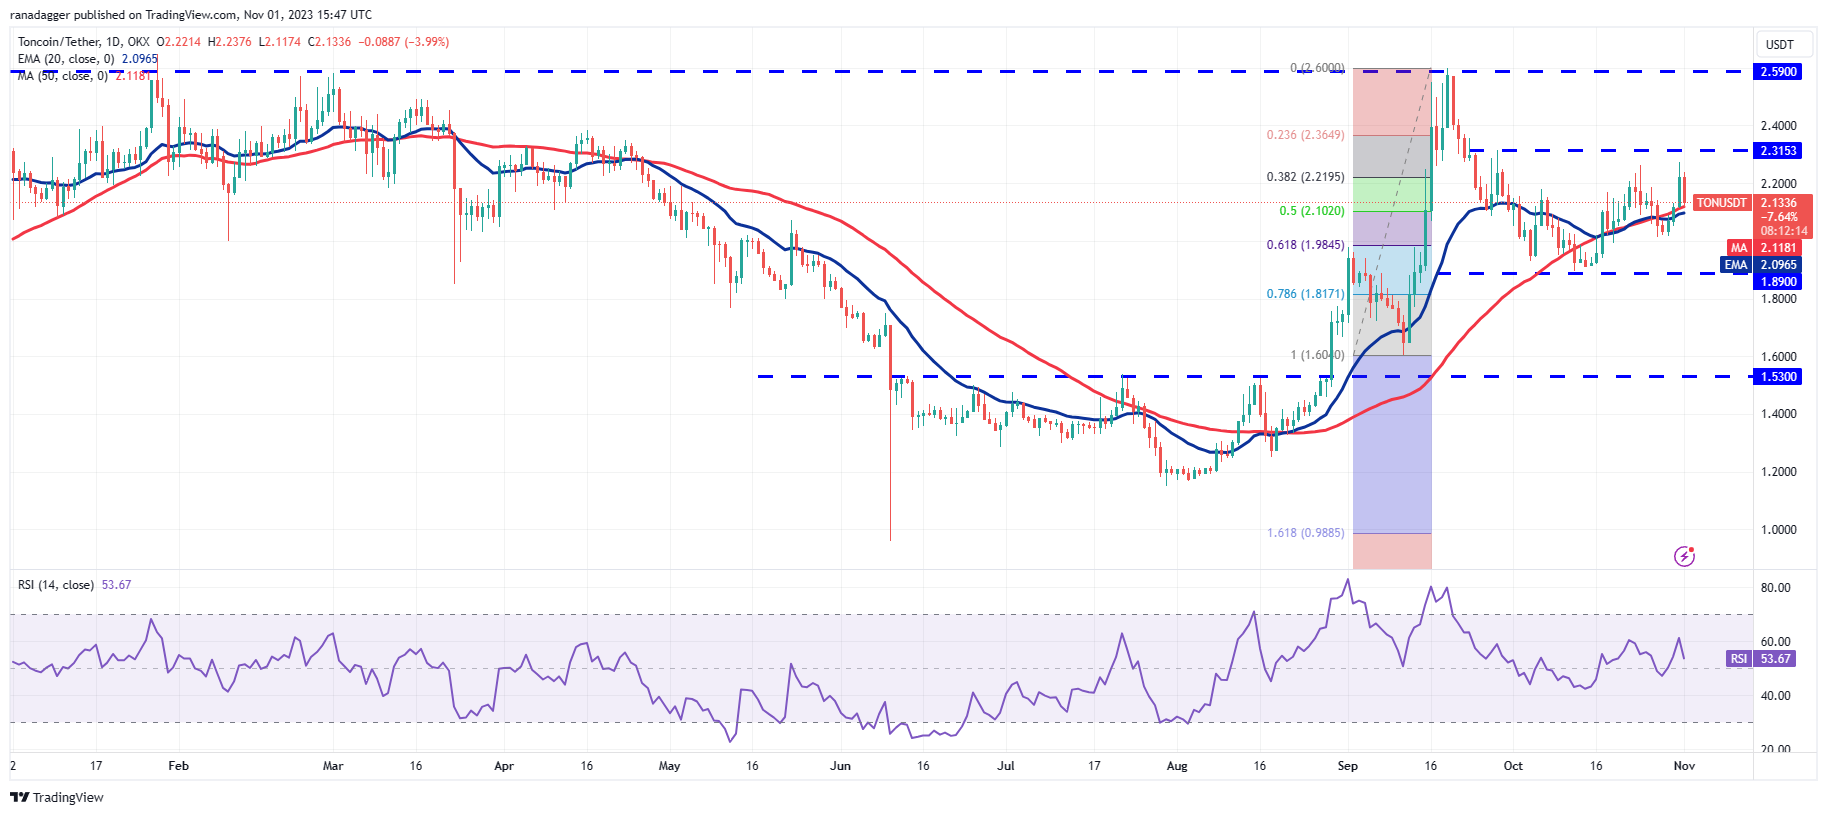
The TON/USDT pair has retreated to the immediate support at the moving averages. A strong rebound from this level will indicate a positive sentiment, suggesting traders see dips as buying opportunities. This could improve the chances of a rally above the overhead resistance at $2.31, potentially pushing the pair to $2.59.
In contrast, if the price continues to decline and breaks below the moving averages, it would imply that range-bound action may persist for a few more days.
Chainlink price analysis
The bulls have been striving to push and sustain Chainlink (LINK) above the resistance level of $11.50, but the long wicks on the candlesticks reveal that bears are active at higher price levels.
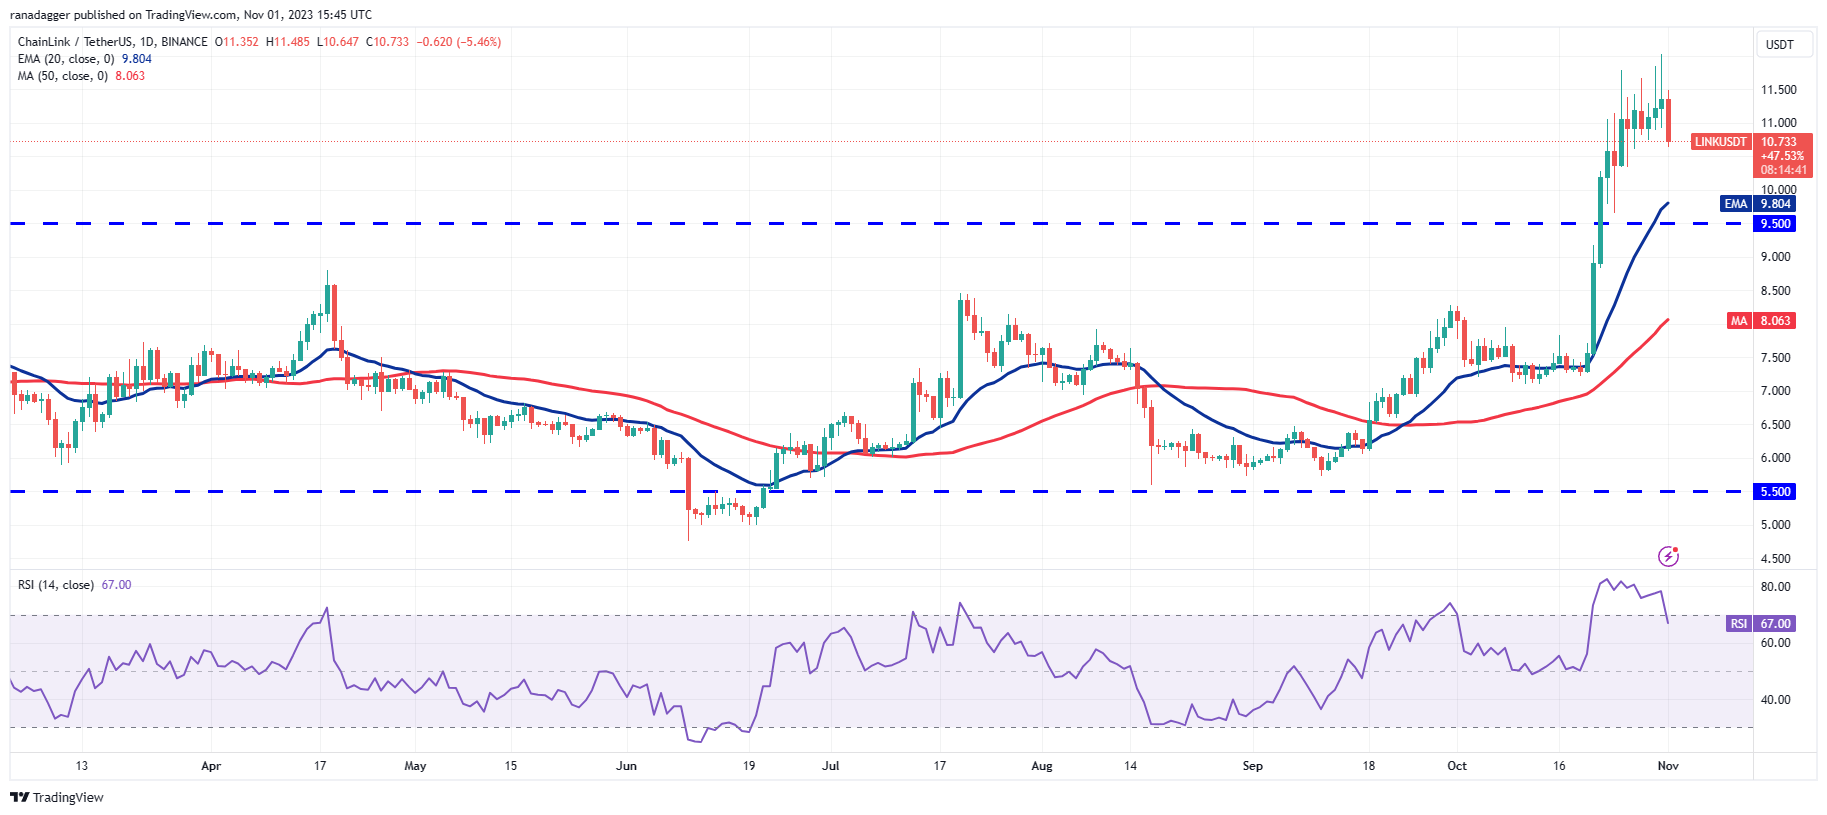
The decline on Nov. 1 indicates that bears are attempting to pull the price down to the 20-day EMA ($9.80), which is a crucial level to monitor. If the price rebounds from this level, the bulls will once again try to push the LINK/USDT pair above $11.50. If successful, the pair may rise to $13.50 and then to $15.
Conversely, if sellers manage to sink and maintain the price below $9.50, it would suggest they are regaining control, opening the door for a further decline to the 50-day SMA ($8.06).
Polygon price analysis
Buyers attempted to push Polygon (MATIC) above the resistance level of $0.66 on Oct. 31, but the bears held firm.
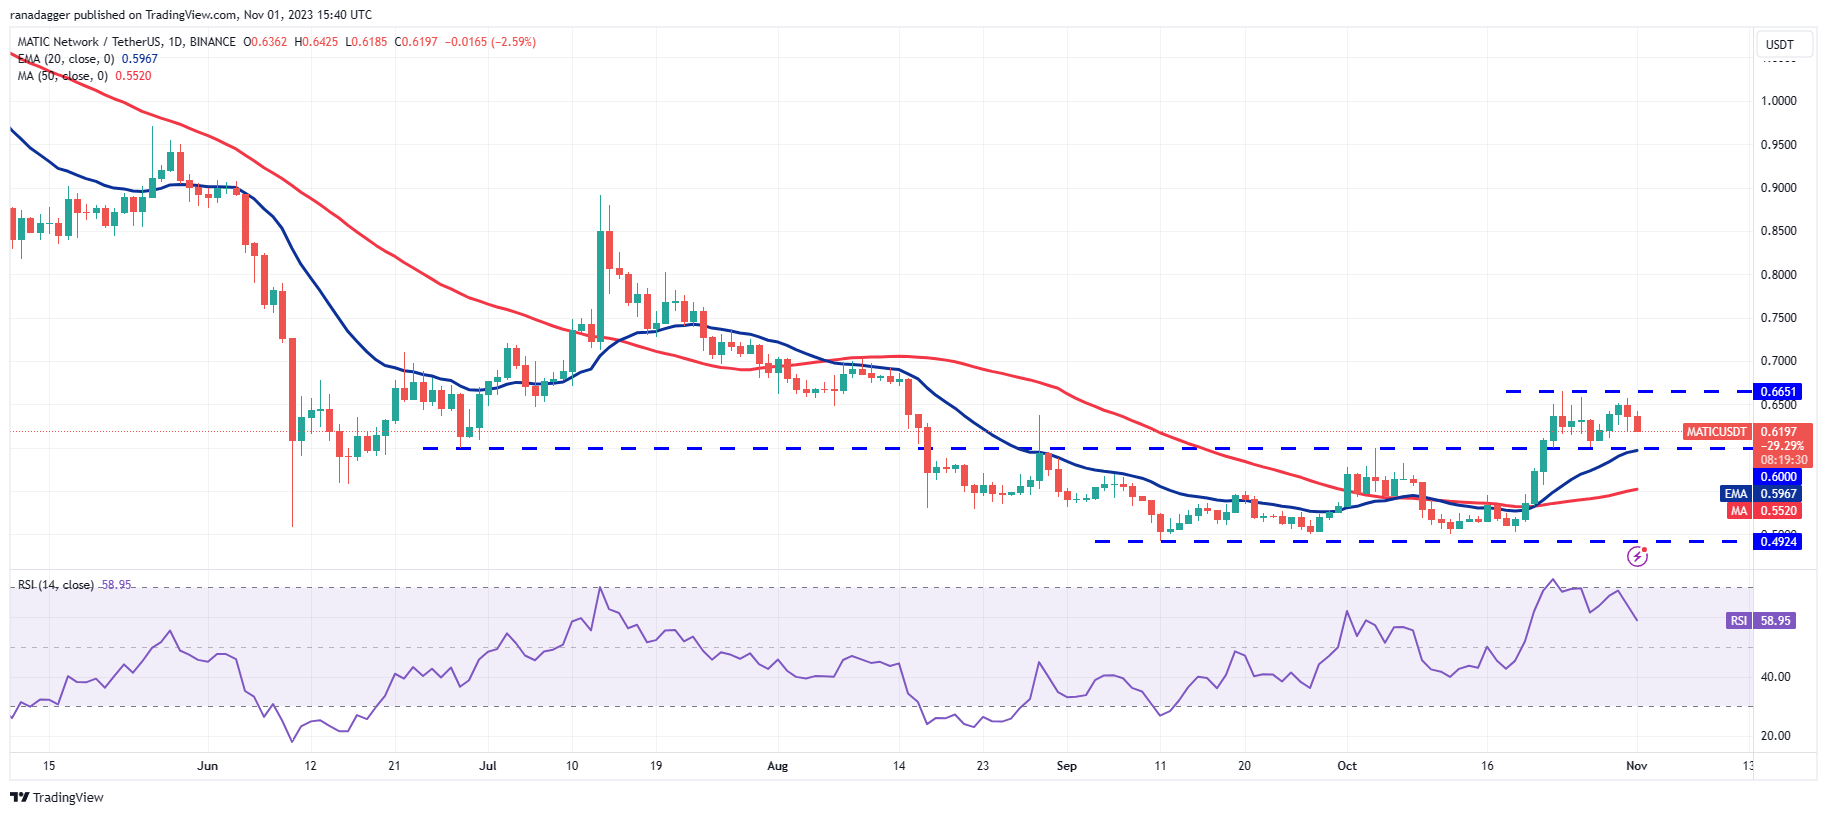
This indicates that the MATIC/USDT pair may consolidate within a tight range between $0.60 and $0.66 for some time. The rising moving averages and the RSI remaining in positive territory suggest that bulls have the upper hand.
If buyers push the price above $0.66, the pair could initiate the next phase of the relief rally toward $0.77. However, the bears are likely to have alternative strategies, aiming to pull the price back below $0.60 to trap aggressive bulls.
This article does not constitute investment advice or recommendations. Every investment and trading decision carries risk, and readers should conduct their own research when making choices.