Disclaimer: Information found on CryptoreNews is those of writers quoted. It does not represent the opinions of CryptoreNews on whether to sell, buy or hold any investments. You are advised to conduct your own research before making any investment decisions. Use provided information at your own risk.
CryptoreNews covers fintech, blockchain and Bitcoin bringing you the latest crypto news and analyses on the future of money.
While equity, oil, and bond markets have experienced turmoil, Bitcoin traders remain unfazed.
Bitcoin’s implied volatility remains consistent as traditional volatility indexes rise due to panic hedging.
 Bitcoin traders exhibit composure while traditional investors experience anxiety. (Kanchanara/Unsplash modified by CoinDesk)
Important details:
- Bitcoin’s implied volatility has shown significant stability during the ongoing conflict in Iran, which has now entered its third week, indicating a lack of fear-induced hedging among crypto investors.
- In contrast, traditional financial markets have witnessed sharp increases in volatility indicators like the VIX, OVX, and MOVE as traders scramble to acquire put options and protect against geopolitical risks.
Related Posts
The bitcoin price has remained largely unaffected during the two-week conflict with Iran. Notably, its key volatility indicators have also stayed consistent, suggesting that crypto traders are exhibiting less apprehension than their traditional market counterparts in equities, oil, and bonds.
Hostilities between Iran, the U.S., and Israel escalated into open conflict on February 28, leading to damage to oil infrastructure across the Middle East and disrupting tanker operations. Analysts cautioned that this unrest could lead to substantial price volatility and fear-driven hedging across different asset classes.
So far, their predictions have not fully materialized.
The 30-day implied volatility index for bitcoin, BVIV, has remained exceptionally stable, fluctuating between 55% and 60%, based on TradingView data. Implied volatility indicates the demand for options, and the stability implies that traders have not been actively purchasing put options to hedge against price drops.
Conversely, traditional market traders have reacted with anxiety, as evidenced by the increases in their corresponding volatility indexes.
Cboe’s crude oil volatility index, OVX, rose above 100% from 64%. The MOVE index, which monitors volatility in U.S. Treasury notes, increased to 85% from 73%, reaching a peak of 95% at one point, indicating widespread market uncertainty. The volatility index for gold, typically regarded as a safe haven during turbulent times, remained above 30%.
The discrepancy between bitcoin and traditional market indexes is significant. Asset prices can be volatile and influenced by unpredictable flows, but volatility indicators often provide a clearer understanding of investor sentiment, particularly regarding the demand for hedging against downside risks. In this context, BTC traders seem composed.
One potential explanation is that crypto sentiment was already fragile prior to the Iran conflict. Bitcoin’s price fell from an all-time high exceeding $126,000 in October 2025 to the low $60,000s in the following months, a decline that unsettled many bulls and compelled others to hedge against additional drops.
In this light, the Iran war has not been as shocking to the crypto market compared to stocks and other markets, which were trading near record highs or exhibited stability in the weeks leading up to the conflict.
According to an analysis by bitcoin-centric financial firm River, the cryptocurrency has produced average double-digit returns over 60-day spans during various geopolitical events since 2020.
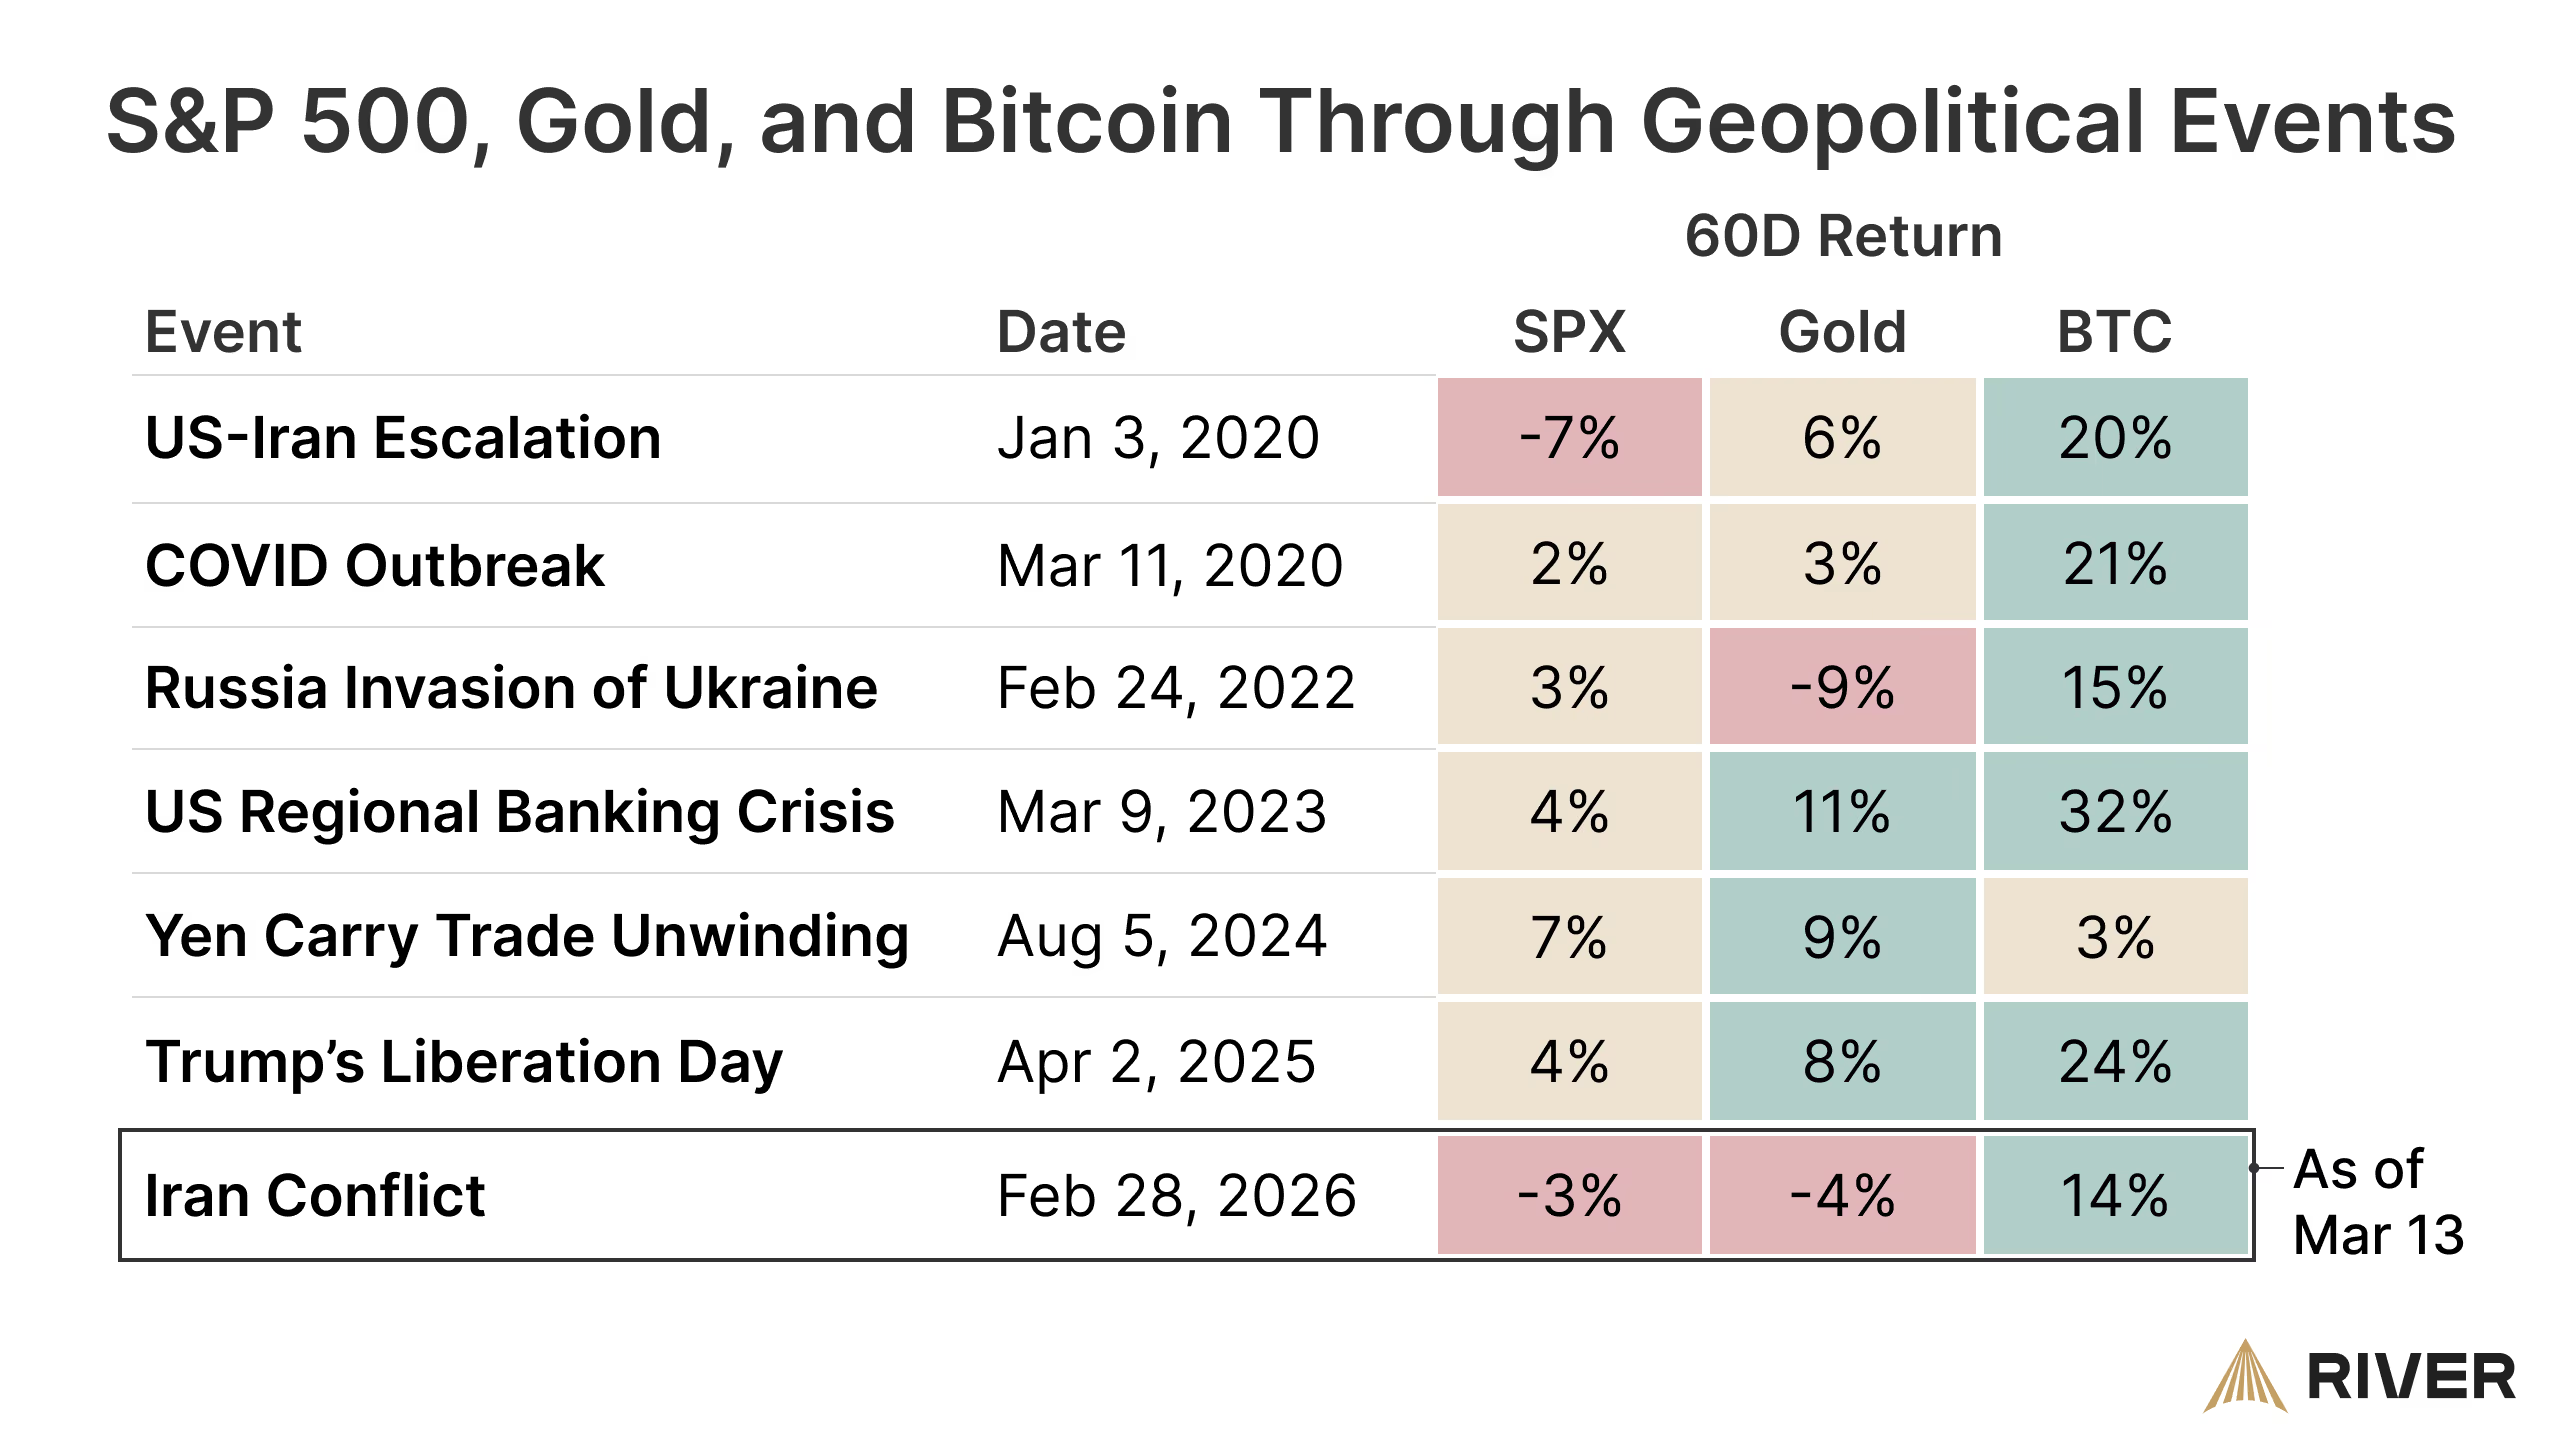 Bitcoin, gold, and S&P 500 performance amid geopolitical events. (River)
History appears to be repeating. Bitcoin has surged more than 10% to $74,000 in the past two weeks, based on CoinDesk data.
Overall, the implication is clear: BTC has remained resilient when it was most crucial. It remains to be seen if this stability will continue.