Disclaimer: Information found on CryptoreNews is those of writers quoted. It does not represent the opinions of CryptoreNews on whether to sell, buy or hold any investments. You are advised to conduct your own research before making any investment decisions. Use provided information at your own risk.
CryptoreNews covers fintech, blockchain and Bitcoin bringing you the latest crypto news and analyses on the future of money.
The value of Bitcoin (BTC) remained relatively stable on May 18 compared to the previous day’s closing price as traders sought more insight into the impending debt crisis in the United States.
Minor increases for Bitcoin as market sentiment improves
On May 17, U.S. President Joe Biden conveyed his optimism about resolving the impasse with Republicans to avert a default, which enhanced market sentiment. Following this, Bitcoin increased by 1.5%, surpassing $27,400 for the day.
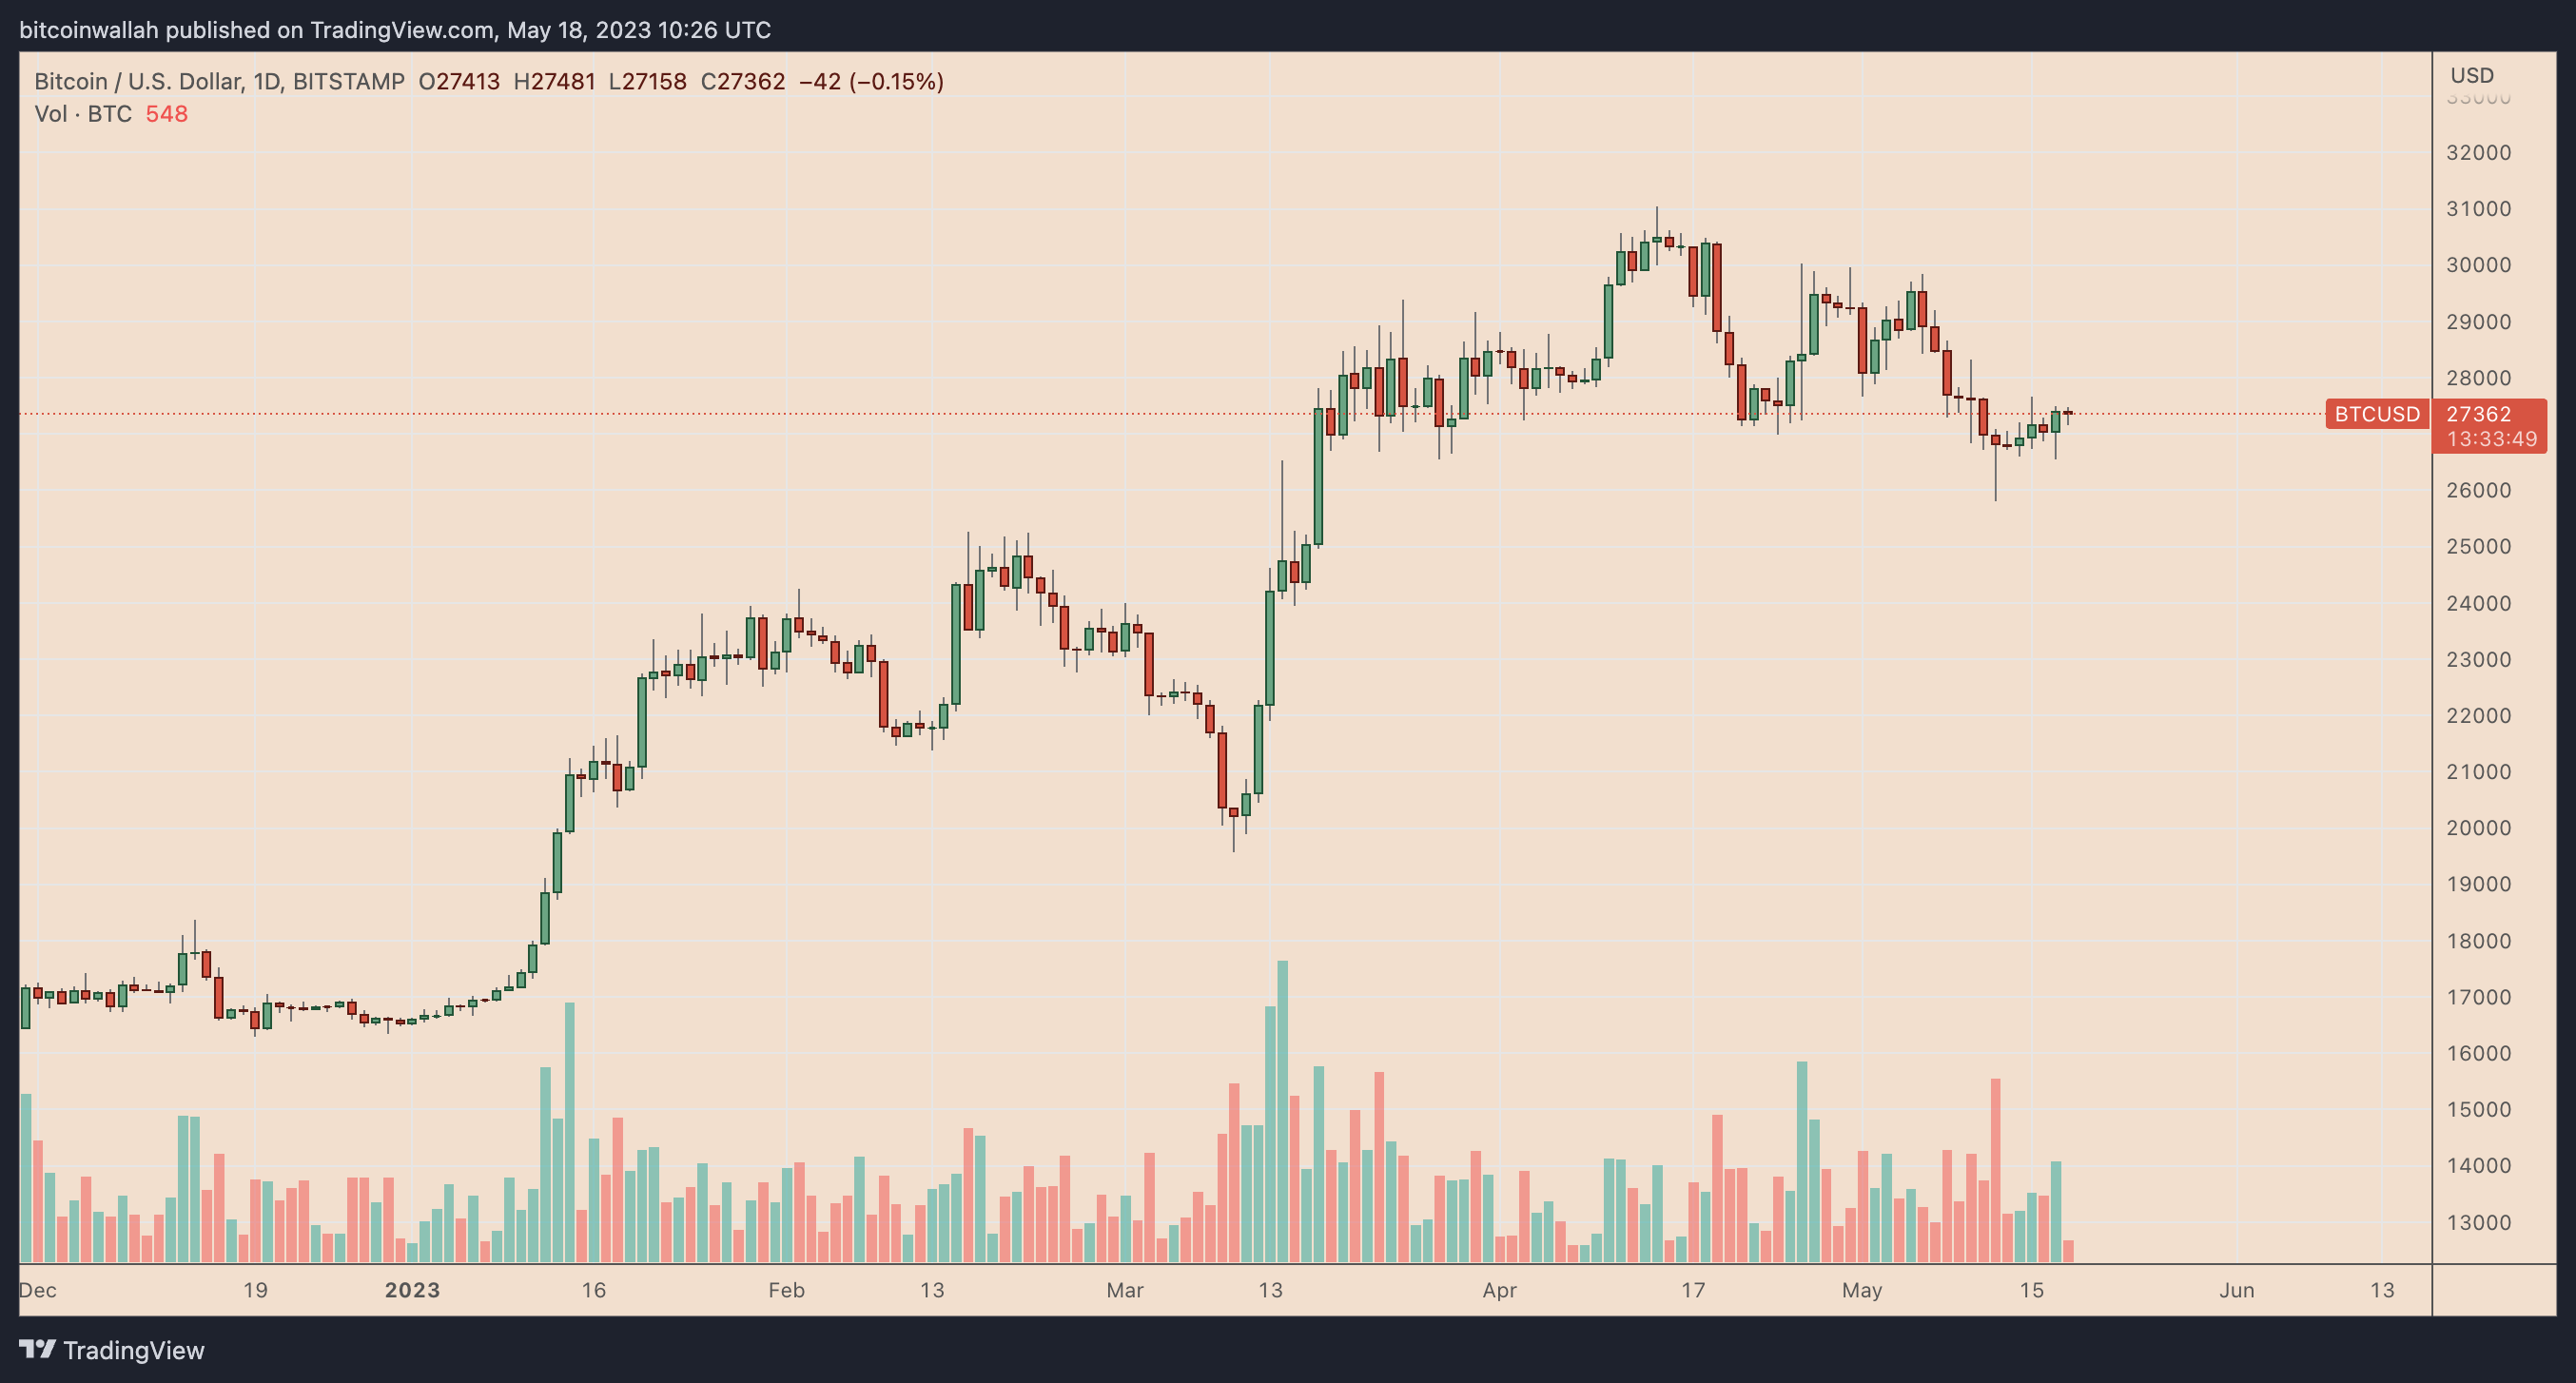 BTC/USD daily price chart. Source: TradingView
Bitcoin’s rebound may have also gained traction after Tether announced its plan to allocate 15% of its monthly operational profits to purchase Bitcoin.
What is Bitcoin’s value in other currencies? Check our Bitcoin & Cryptocurrency Calculator
In general, Bitcoin’s price has risen 65% year-to-date, yet it remains down 60% from its all-time high of $69,000 in November 2021.
Bitcoin price must navigate a stronger dollar
Bitcoin faces the risk of a decline in May due to a series of robust U.S. economic data released earlier this week, which brings the possibility of a June interest rate increase back into consideration.
For example, after two months of stagnation, the nation’s industrial output surged by 0.5% in April, exceeding the anticipated 0.1% growth.
Additionally, retail sales rose by 0.4% in April following a 0.7% drop in the prior month. This indicates that consumer spending remained resilient despite economic challenges.
Related Posts
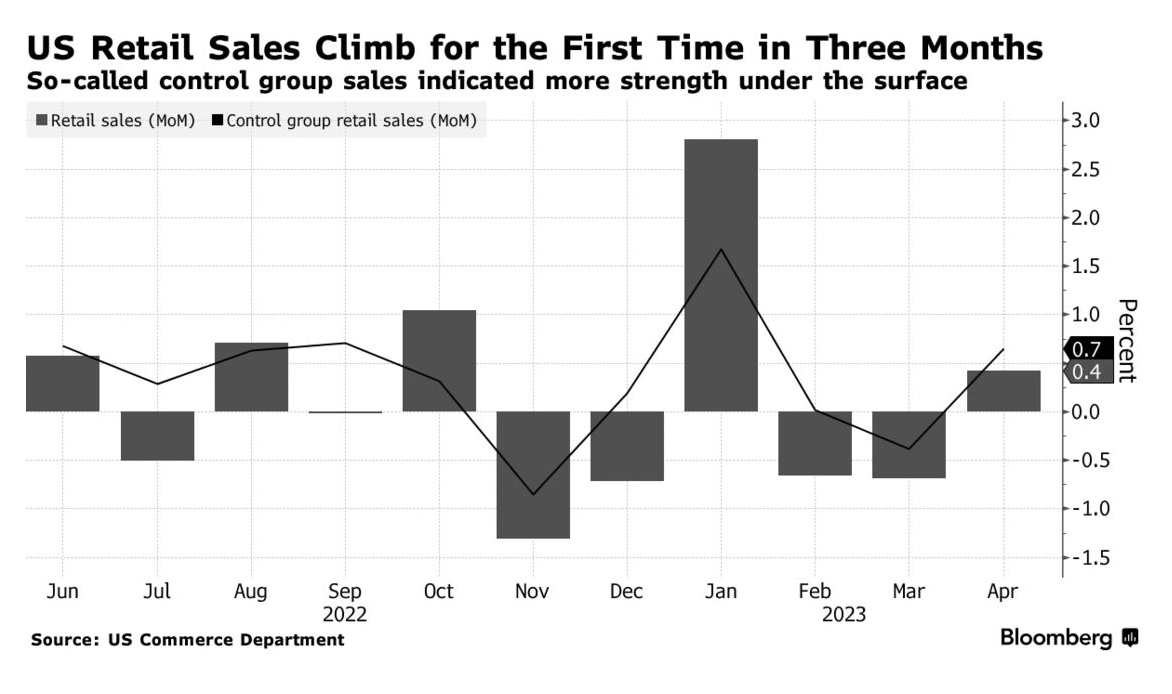 U.S. retail sales data in recent months. Source: Bloomberg
The potential for another rate increase has elevated U.S. Treasury yields, which has, in turn, increased demand for the U.S. dollar.
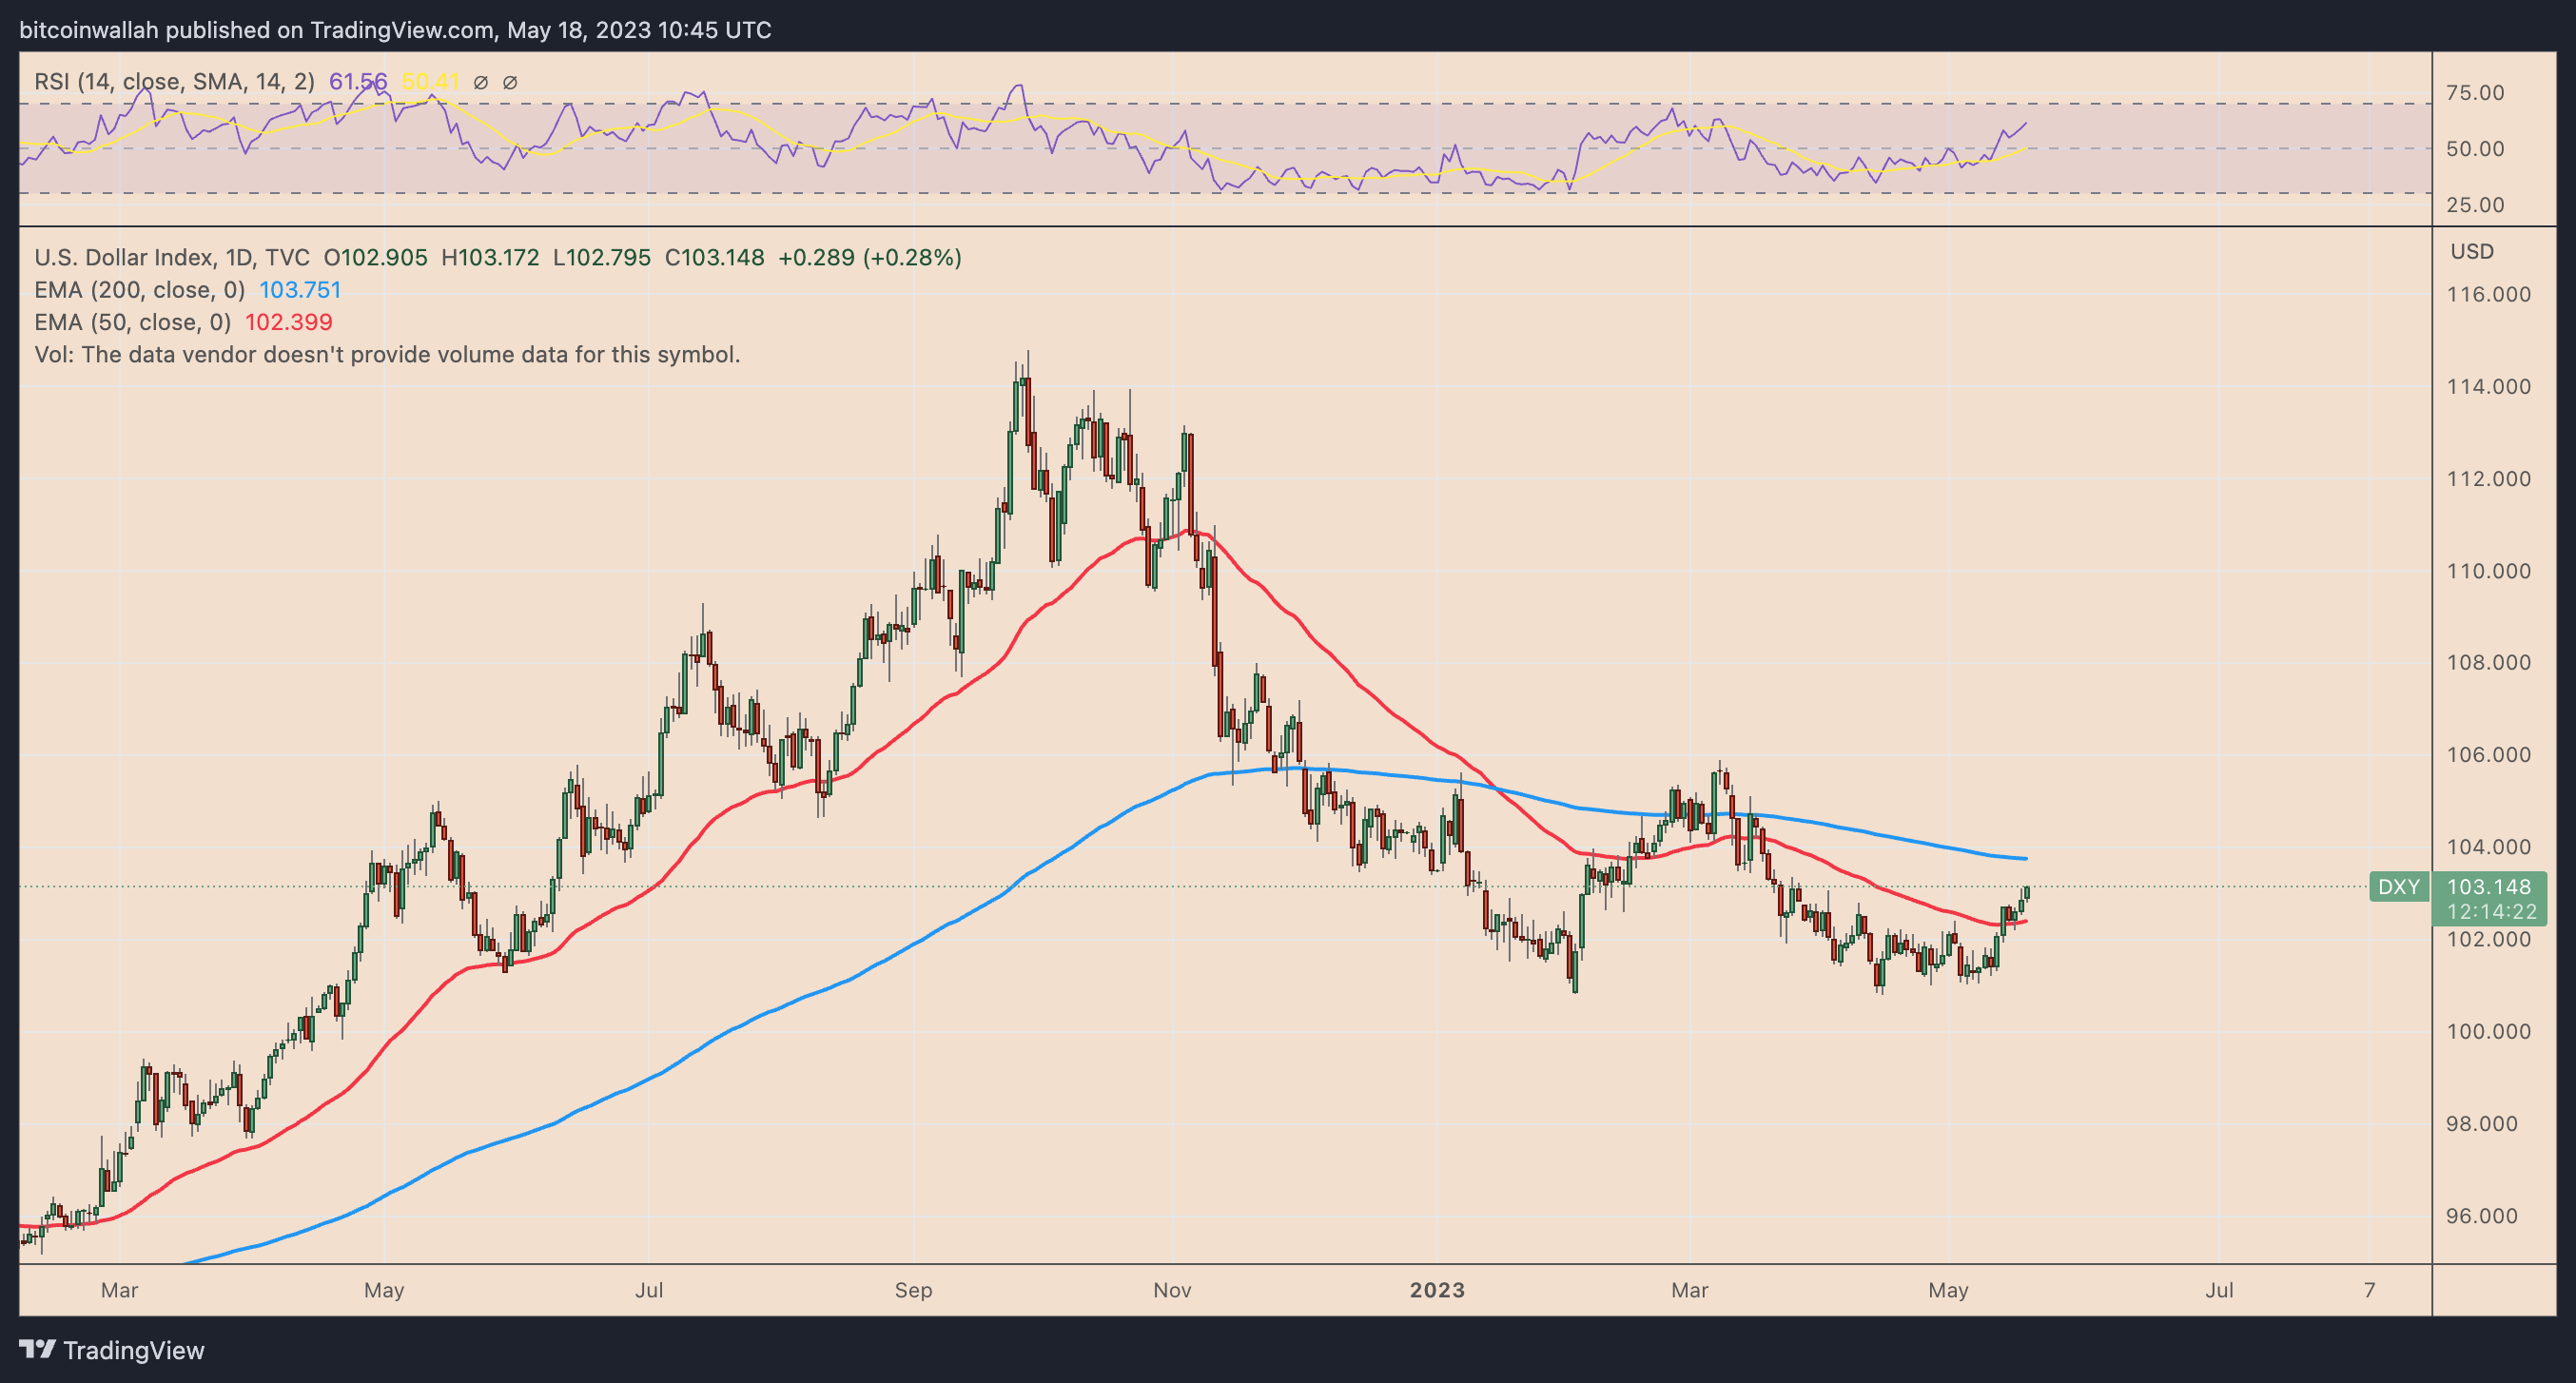 U.S. dollar index daily price chart. Source: TradingView
Bitcoin, which generally trades inversely to the dollar, may be at risk if the dollar strength index enters a new bullish phase.
BTC price technicals indicate bearish outlook
Technical analysis of Bitcoin’s price chart is also suggesting a bearish target of $25,000, a significant psychological price point, by June.
Related: Monitor these BTC price levels as Bitcoin risks losing $27K support
Bears contend that Bitcoin is encountering substantial selling pressure from its 50-day exponential moving average (50-day EMA; the red wave) around $27,670.
A retreat from this level could set BTC/USD on a path toward its 200-day EMA (the blue wave) near $24,860.
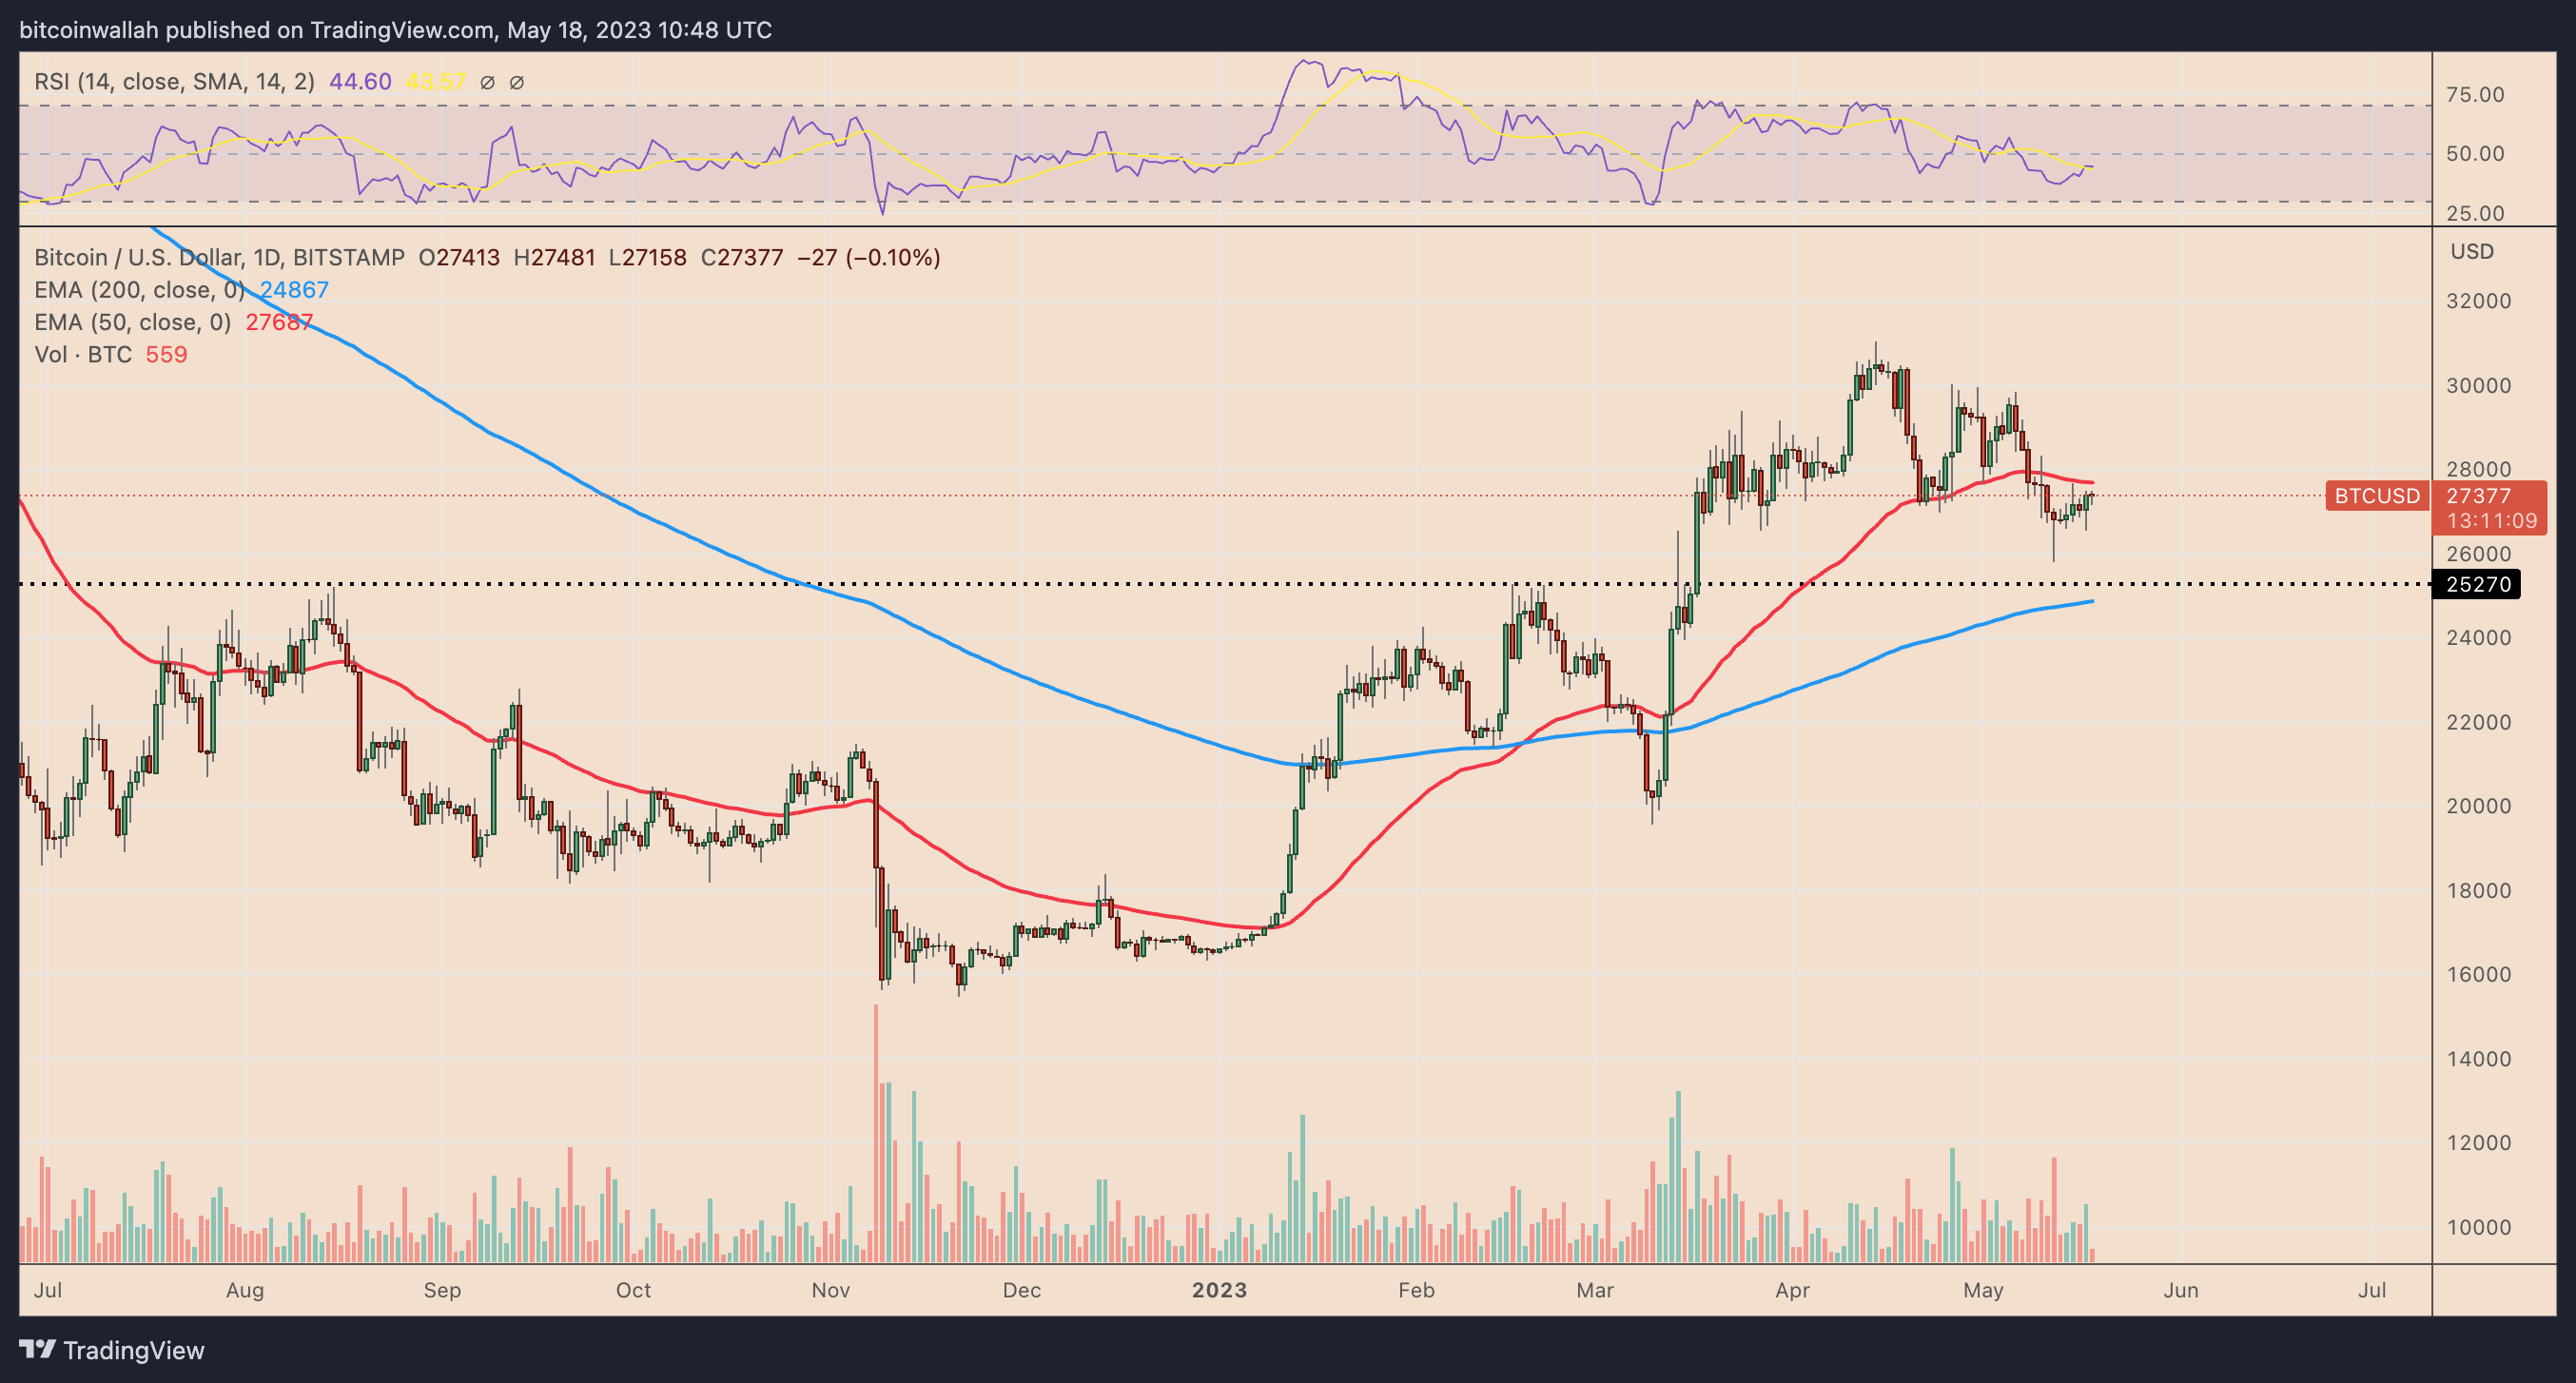 BTC/USD daily price chart. Source: TradingView
On the other hand, a breakthrough above Bitcoin’s 50-day EMA could negate the bearish scenario while directing BTC price toward $30,000 by June.
This article does not provide investment advice or recommendations. Every investment and trading decision carries risk, and readers should perform their own research before making any decisions.