Disclaimer: Information found on CryptoreNews is those of writers quoted. It does not represent the opinions of CryptoreNews on whether to sell, buy or hold any investments. You are advised to conduct your own research before making any investment decisions. Use provided information at your own risk.
CryptoreNews covers fintech, blockchain and Bitcoin bringing you the latest crypto news and analyses on the future of money.
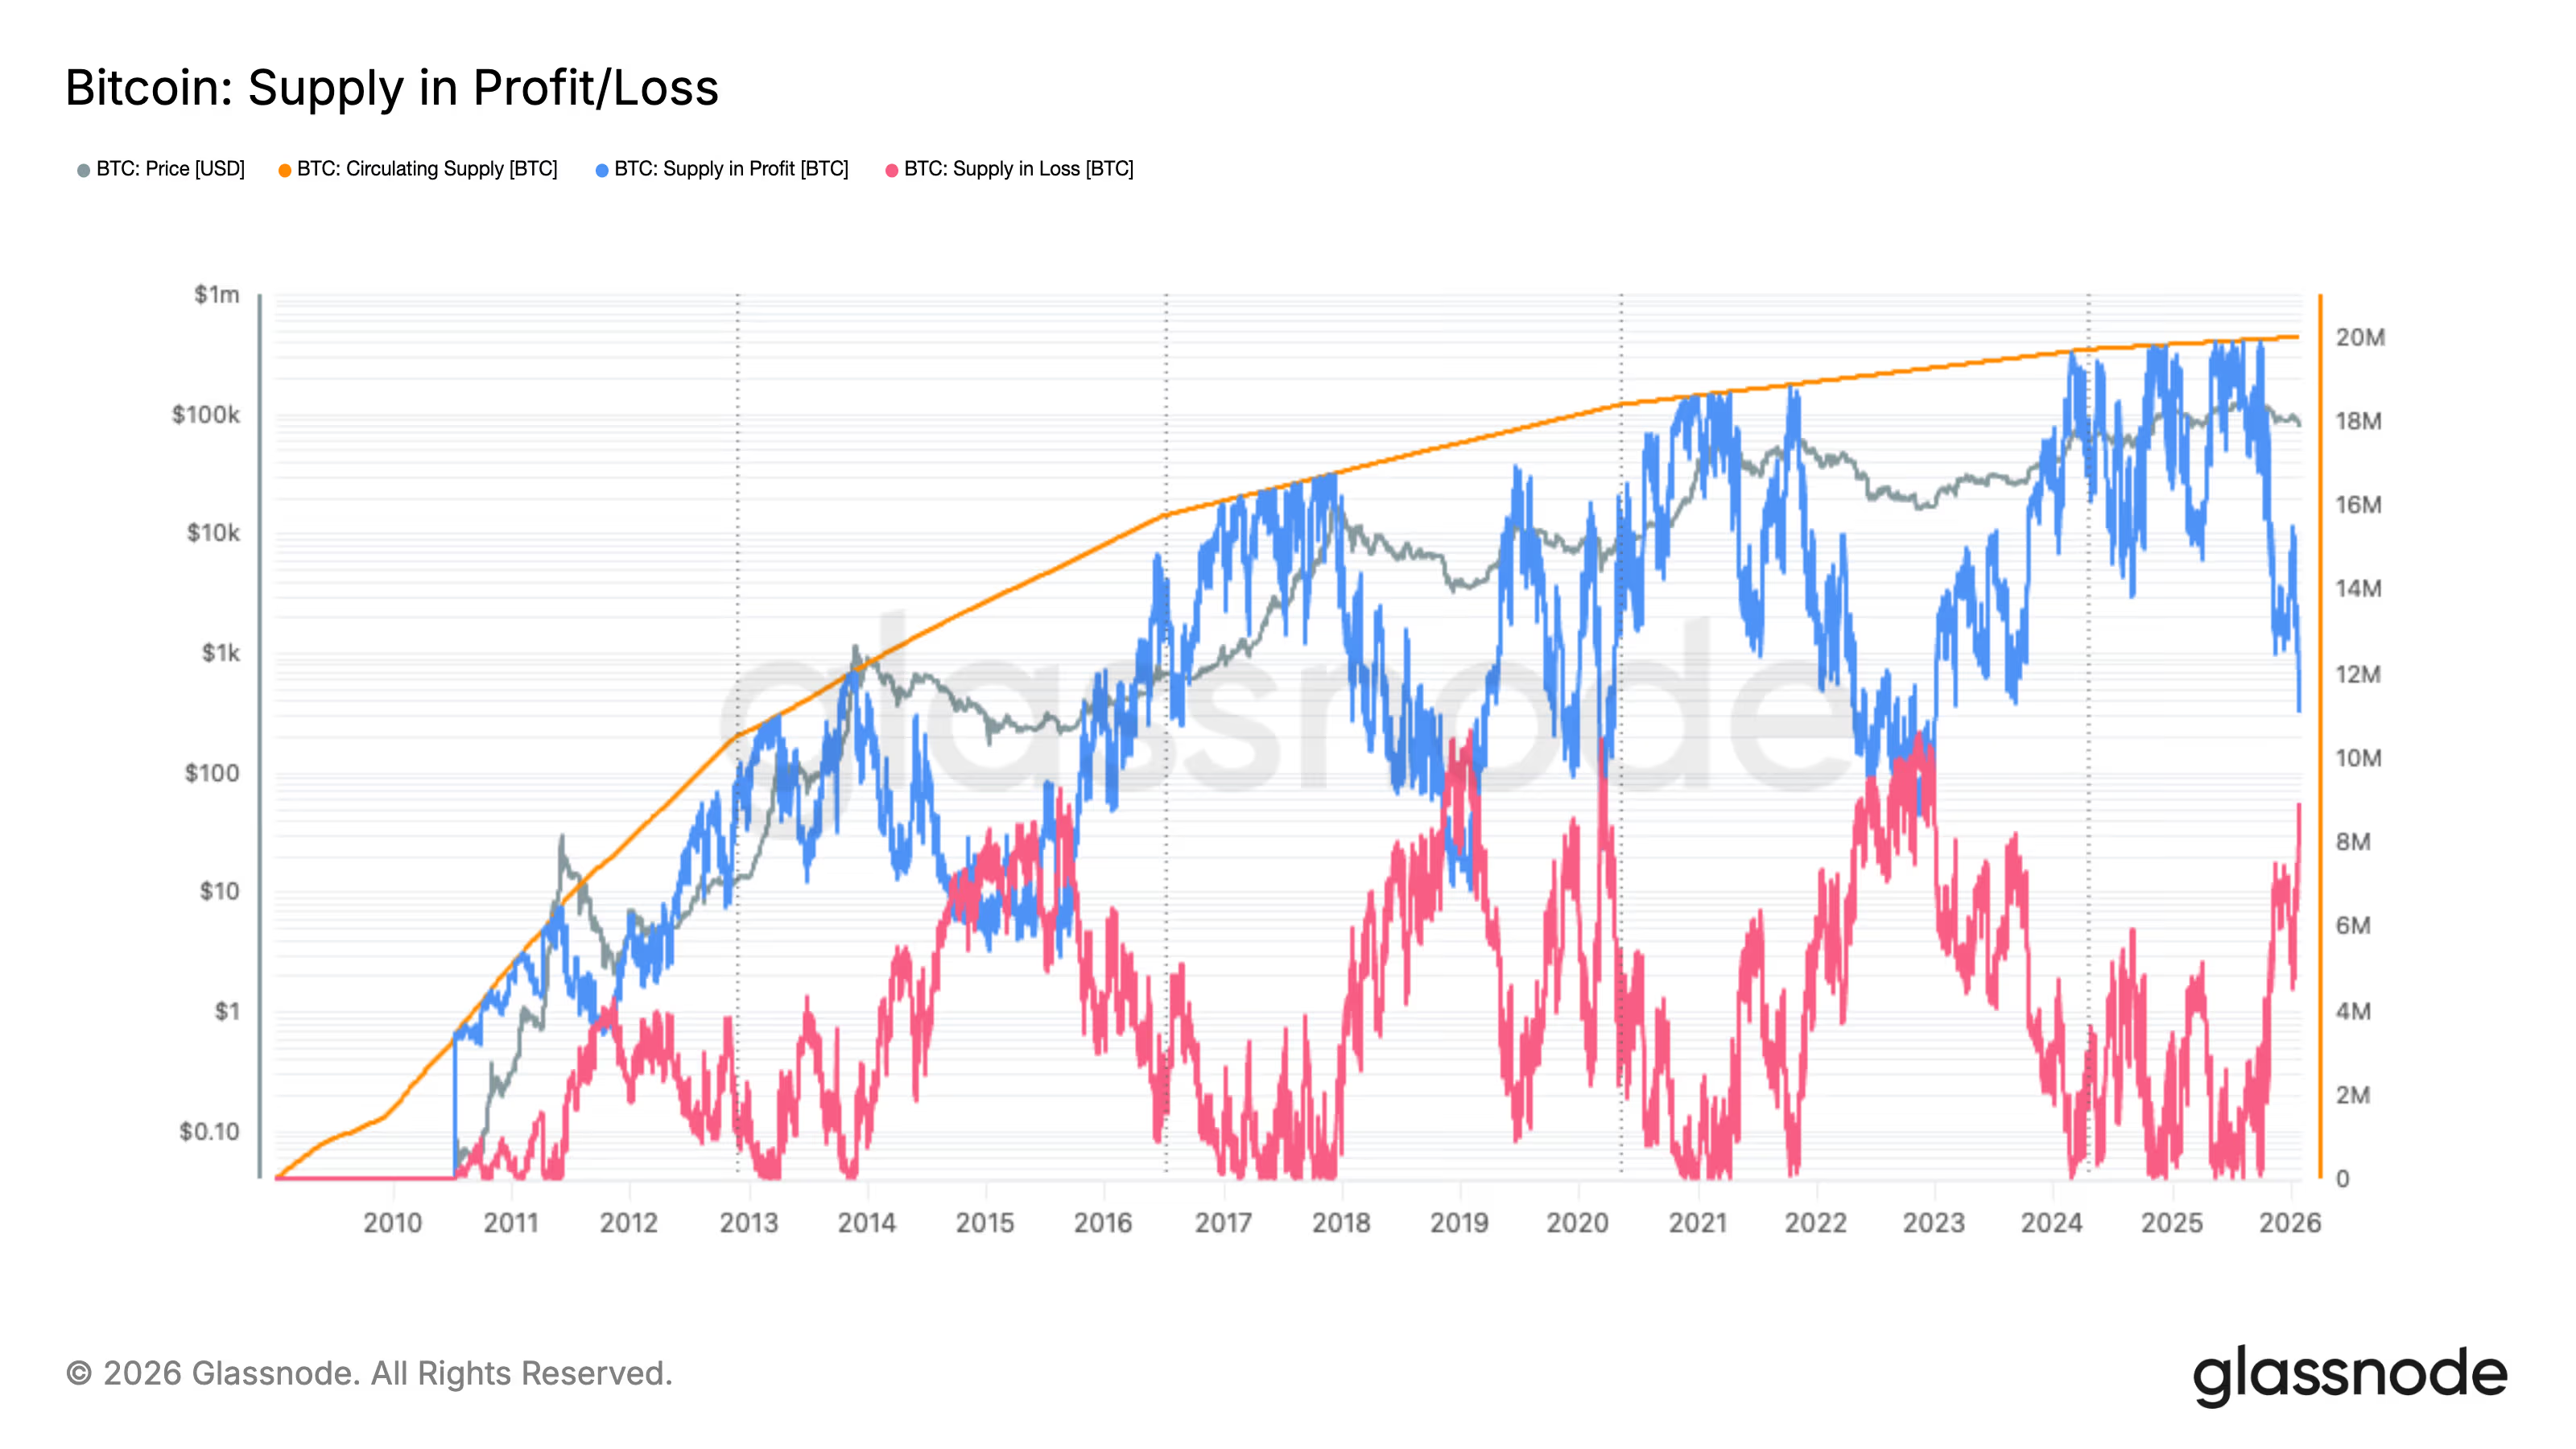
The convergence of bitcoin supply in profit and supply in loss has consistently aligned with significant market lows.
 BTC: Profit vs Loss Supply (Glassnode)
Key points:
- Currently, there are 11.1 million BTC in profit and 8.9 million BTC in loss; historical market bottoms have emerged when these figures approach each other.
- If such convergence takes place at existing cost basis levels, it would suggest a spot price around $60,000, reflecting similar bottom indicators observed in 2015, 2019, 2020, and 2022.
While bottom-fishing can be appealing yet challenging, those engaged in this strategy may find this proven on-chain indicator to be a valuable tool for identifying the bitcoin bear market bottom.
This metric, known as BTC supply in profit versus loss, measures the balance of bitcoin wallets that are in profit compared to those that are at a loss. Historical data indicates that when these two groups equalize, bear markets typically reach their nadir, making it a trusted indicator for capitulation and long-term investment potential.
STORY CONTINUES BELOWStay informed with the latest updates.Subscribe to the Crypto Daybook Americas Newsletter today. See all newslettersSign me up
Related Posts
Bulls may find reassurance in the prospect of this scenario occurring soon, as the numbers of those in profit and loss appear to be converging.
Data from Glassnode reveals that there are currently 11.1 million bitcoins in profit, indicating these coins were bought at prices lower than the current market rate. In contrast, 8.9 million BTC is at a loss.
A potential convergence may signify a market bottom similar to what happened in 2022 and 2018-19, as illustrated in the following chart.
 BTC: Profit vs Loss Supply (Glassnode)
The chart from Glassnode depicts the amount of BTC supply held in profit, represented in blue, and in loss, depicted in red, against the backdrop of the circulating supply.
As spot prices fluctuate above or below the aggregate cost bases, bitcoins transition between these two supply categories, offering insights into overall market positioning and investor sentiment.
Historically, points of convergence between these two groups have signified clear cycle bottoms. This was observed in November 2022 around $15,000 following the collapse of FTX, in March 2020 when bitcoin briefly dropped below $3,000 during the market turmoil caused by COVID-19, in January 2019 near $3,300, and again in 2015 just above $200.
We will see if history repeats itself.