Disclaimer: Information found on CryptoreNews is those of writers quoted. It does not represent the opinions of CryptoreNews on whether to sell, buy or hold any investments. You are advised to conduct your own research before making any investment decisions. Use provided information at your own risk.
CryptoreNews covers fintech, blockchain and Bitcoin bringing you the latest crypto news and analyses on the future of money.
A significant momentum indicator that has been reliably predicting price selloffs since October has just activated.
 The MACD histogram shows that bears currently dominate bitcoin. (geralt/Pixabay
What to know:
- A crucial technical indicator for bitcoin, the MACD histogram, has just turned negative, indicating a renewed trend towards bearish momentum.
- Since October, each bearish MACD cross has preceded significant bitcoin selloffs, while bullish crosses have resulted in only brief, weak recoveries.
- With the MACD signaling red once again despite bitcoin’s recent strength, traders should remain vigilant as historical patterns suggest another possible price decline.
Bitcoin bulls need to be alert: A significant momentum indicator that has been notably accurate in indicating selloffs since the leading cryptocurrency reached its all-time high in October has just activated.
The indicator in question is the moving average convergence divergence histogram, commonly referred to as the MACD. It has just crossed below zero for the third time, signifying a renewed bearish shift in momentum.
What is MACD anyway?
Before examining the market signal, let’s explore how the MACD functions.
The indicator comprises two lines. The first is the MACD line, which is derived by subtracting the 26-day exponential moving average (EMA) from the 12-day EMA. The difference between the two reflects momentum.
The second is the Signal line, which represents the nine-day exponential moving average of the MACD line itself.
Related Posts
The histogram is particularly noteworthy as it illustrates the disparity between the MACD and Signal lines.
When the histogram becomes positive, it indicates bullish momentum; conversely, when it turns negative, as it has now, it signals bearish momentum. In both instances, the slope’s steepness illustrates the strength of the momentum.
This indicator is widely utilized due to its ability to penetrate market noise, offering a clear view of trend strength and shifts. Currently, it is indicating a strong “bearish” signal.
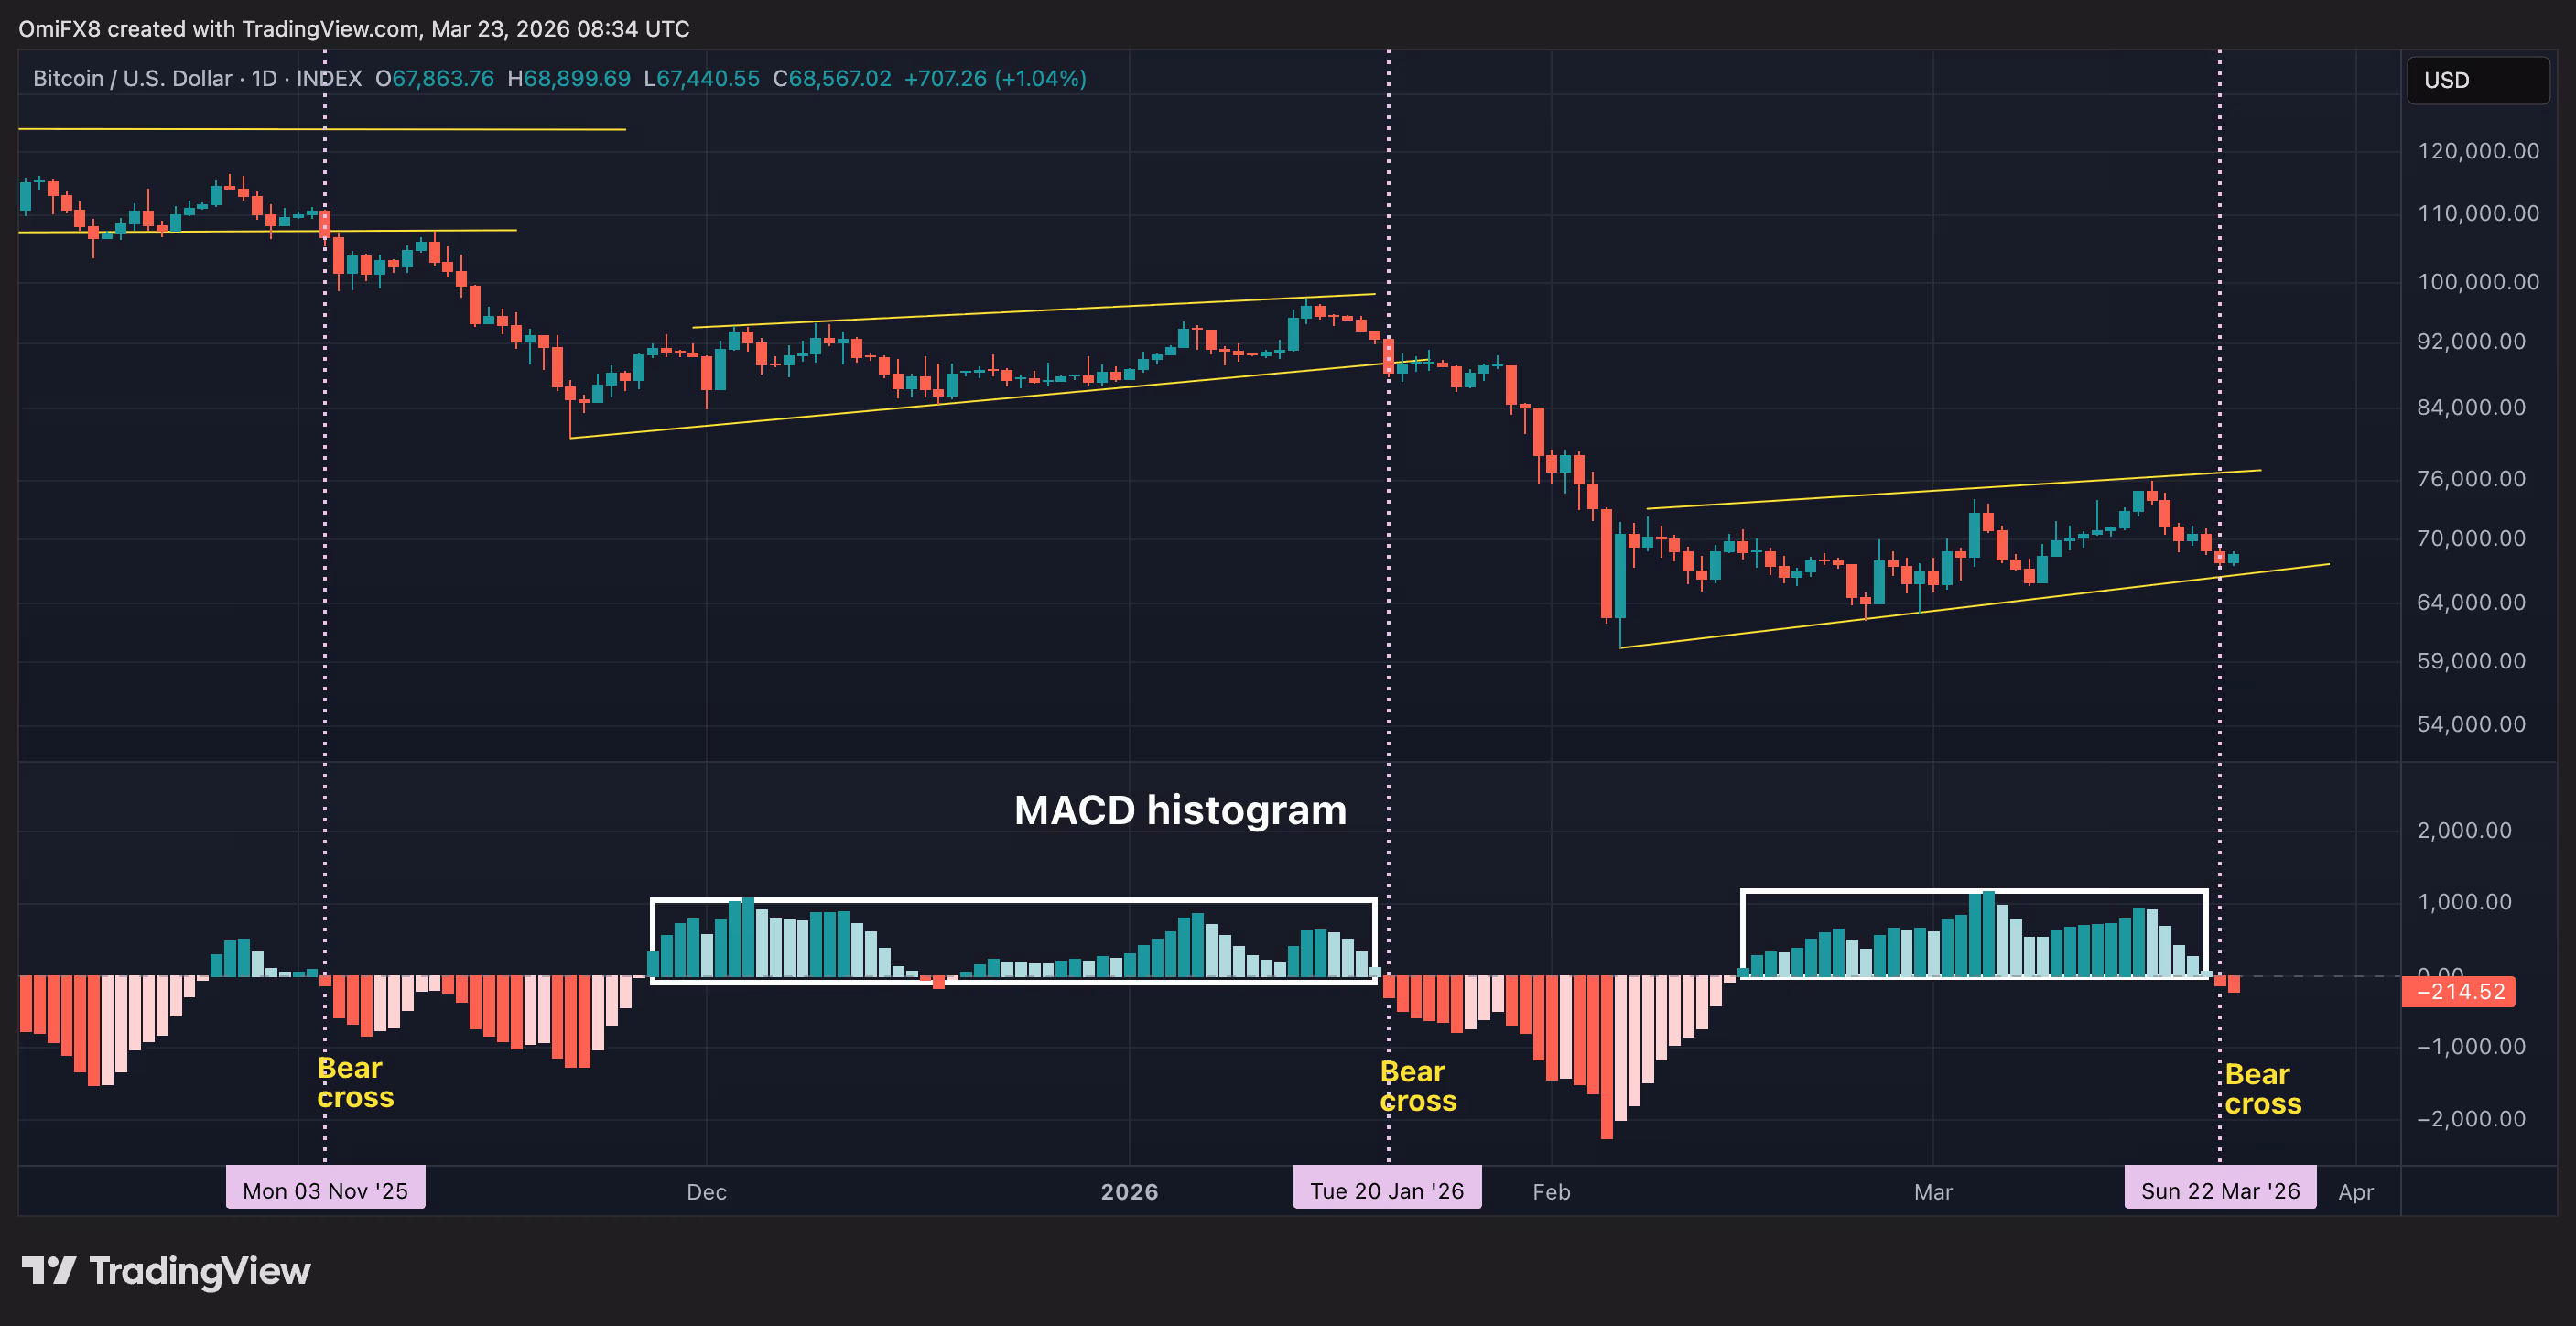 Bitcoin’s daily chart with the MACD histogram. (TradingView)
BTC experiences declines when MACD turns red
Since bitcoin reached above $126,000 in October, the MACD has maintained an almost flawless record. When it indicated a bearish trend, bitcoin experienced significant declines. Conversely, when it indicated a bullish trend, the resulting rebounds were weak and ineffective.
The data is compelling. Bitcoin’s extended period of fluctuating trading above $100,000 ended abruptly after the histogram crossed below zero on November 3. Prices fell from approximately $106,000 to $80,000 by November 21.
A brief recovery followed when the MACD shifted positive. However, this was fleeting. Just two months later, on January 20, the MACD signaled bearish again while bitcoin was near $90,000. The outcome mirrored previous instances — a sharp decline to nearly $60,000 by February 6, once again followed by a minor recovery, supported by a positive MACD that capped upside around $75,000.
To date, every bullish MACD cross has only led to disappointing recoveries that quickly diminish, setting the stage for further selloffs once the indicator turns red. This serves as a strong indication that sellers have a firm grip, effectively quashing any attempts by bulls to regain momentum.
Now, the indicator is signaling red once more. While prior performance does not guarantee future outcomes, it is prudent for traders to take note when a signal with such a solid track record is flashing red, as bitcoin’s strength during the ongoing conflict with Iran may soon falter.