Disclaimer: Information found on CryptoreNews is those of writers quoted. It does not represent the opinions of CryptoreNews on whether to sell, buy or hold any investments. You are advised to conduct your own research before making any investment decisions. Use provided information at your own risk.
CryptoreNews covers fintech, blockchain and Bitcoin bringing you the latest crypto news and analyses on the future of money.
Short-term Bitcoin holders sell off as data suggests possible long-term investment opportunity.
The price movements of Bitcoin indicate that the asset is in a vulnerable state, with a recent report from ARK Invest indicating that short-term Bitcoin investors were compelled to capitulate in August, as the proportion of Bitcoin supply in profit decreased by 14 percentage points.
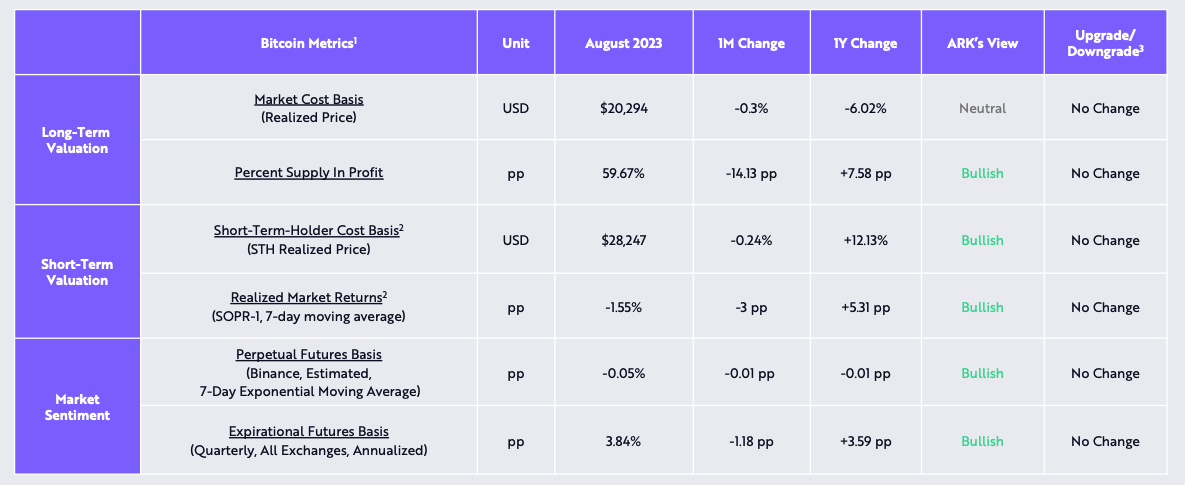 Bitcoin market sentiment and monthly valuation change in August. Source: ARK Invest
While numerous traders perceive significant price declines as opportunities to buy, at this stage of the Bitcoin (BTC) halving cycle, a significant bearish development was Bitcoin’s price dropping below its 200-week moving average (MA) for the first time since June 2023.
The chart below illustrates that the 200-week MA typically serves as a crucial support level during major downtrends, and ARK posits that any forthcoming bearish triggers could lead to the BTC price declining to as low as $20,300, where its realized price currently stands.
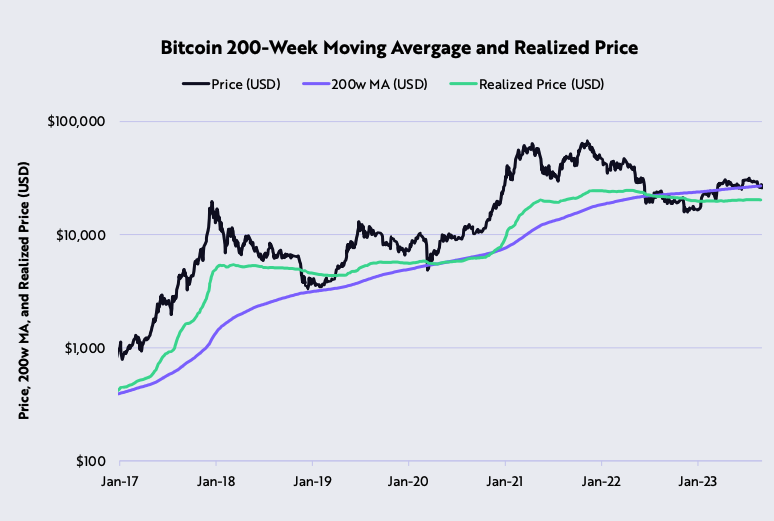 Bitcoin 200-week moving average and realized price. Source: ARK Invest
Despite the rather bleak short-term perspective for the cryptocurrency market, a more favorable interpretation of Bitcoin’s dip below the 200-week MA would emphasize that declines beneath the realized price and long-term moving averages have historically provided cyclical buying opportunities. Investors who purchased during price dips below these metrics in 2019, 2020, and early 2022 experienced substantial profits within the subsequent six months.
Analyst Ben Lilly recently referenced a comparable situation within the Bitcoin dominance metric, indicating that “Bitcoin’s about to take the driver’s seat again.”
Related Posts
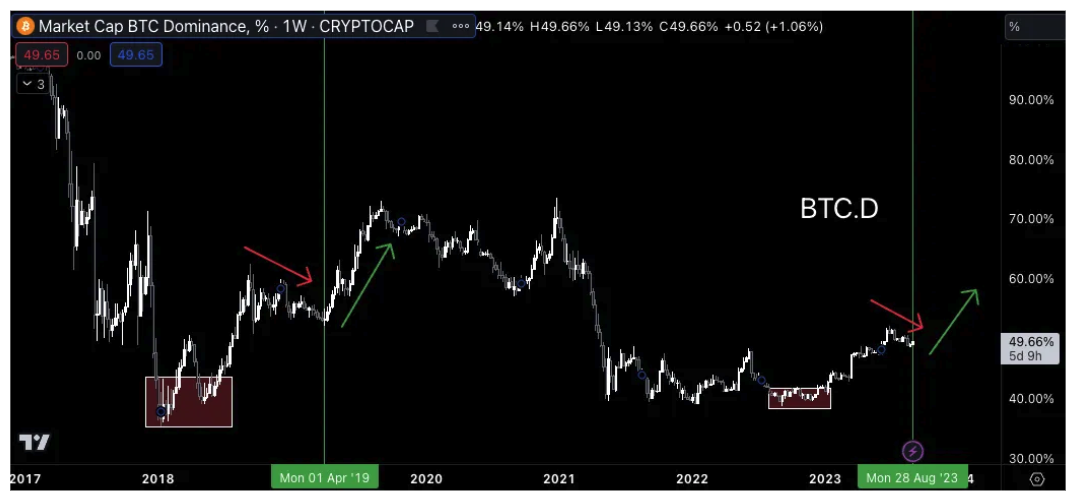 Bitcoin market cap dominance. Source: TradingView
According to Lilly:
“In terms of price action, right now I see a lot of similarities to what took place in 2019. And it has me anticipating a trend to unfold regarding Bitcoin over the next few weeks and possibly months. It has to do with Bitcoin dominance (BTC.D), a measure of Bitcoin’s market share of crypto based on its market cap. In the chart below, we can see that that rally in 2019 started back in 2018, when we got a nice double bottom (red box), followed by a solid run up until Q1 2019. Then, we trended down for a few months (first red arrow) before getting the massive reversal on April Fools’ Day (first green arrow).”
When comparing market participant sentiment from 2018-2019 to the current market sentiment, Lilly noted that today’s price movements remind him of the pre-reversal phase in 2019 when “we were in a winter, everybody was low energy, nobody cared about bitcoin or crypto.”
Stablecoin market cap statistics also indicate a lack of bullish investor sentiment, and according to ARK, the observation that “the 90-day supply of aggregate stablecoins has dropped more than 20% from $162 billion in March 2022 to $120 billion today” highlights the reduction in market liquidity and investors’ confidence in engaging with Bitcoin and altcoins.
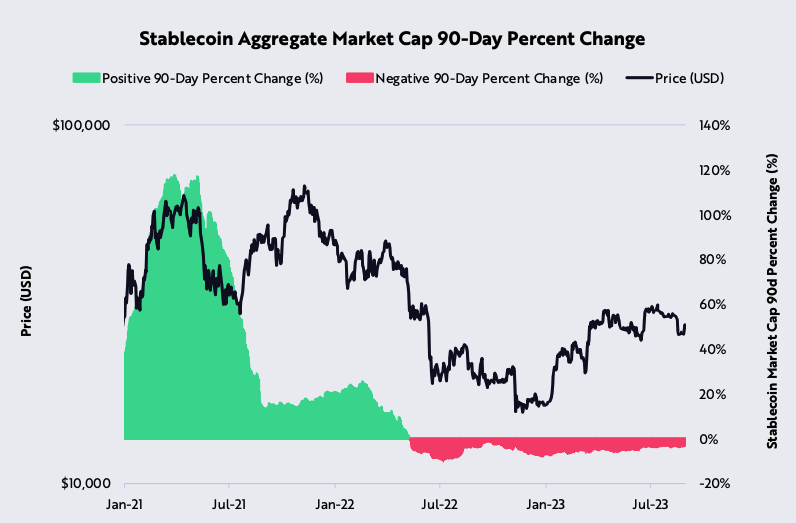 Stablecoin aggregate market cap 90-day percentage change. Source: ARK Invest
Clearly, the prospect of spot Bitcoin exchange-traded funds (ETFs) is on the minds of nearly all retail and institutional investors, and until one is approved or the narrative surrounding the upcoming Bitcoin halving takes precedence over the “ETF approval triggering a bull market narrative,” the market dynamics outlined above are likely to continue.
This article does not contain investment advice or recommendations. Every investment and trading move involves risk, and readers should conduct their own research when making a decision.