Disclaimer: Information found on CryptoreNews is those of writers quoted. It does not represent the opinions of CryptoreNews on whether to sell, buy or hold any investments. You are advised to conduct your own research before making any investment decisions. Use provided information at your own risk.
CryptoreNews covers fintech, blockchain and Bitcoin bringing you the latest crypto news and analyses on the future of money.
Bitcoin (BTC) and several prominent cryptocurrencies have retraced from their recent local peaks, indicating that traders are taking profits. The pressing question for many traders is whether this pullback presents a buying opportunity or if the trend has shifted downward.
John Bollinger, the creator of Bollinger Bands, mentioned in a recent tweet that Bitcoin has declined from the upper Bollinger Band and has reached the middle band, close to its breakout point. He described this as a “logical place” and urged traders to “pay attention.”
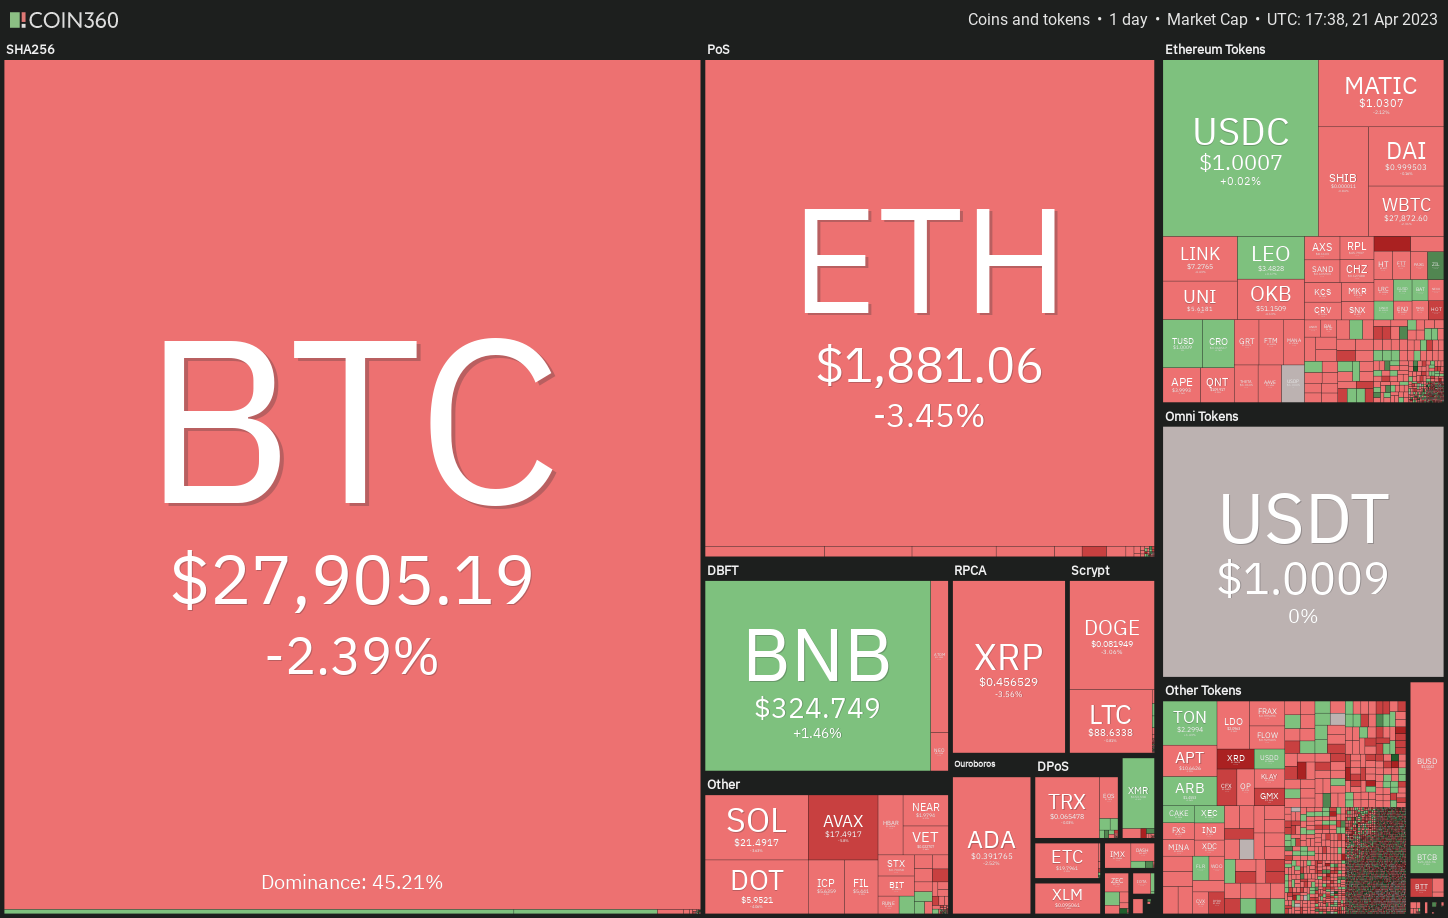 Daily cryptocurrency market performance. Source: Coin360
This correction may concern short-term crypto traders; however, for long-term investors who believe a bottom has been established, it could be an opportunity to enhance their portfolios with preferred cryptocurrencies. It is generally advisable to refrain from purchasing during a decline and to wait for prices to stabilize before resuming buying.
What levels might serve as significant support? Let’s analyze the charts of the top-10 cryptocurrencies to determine this.
Bitcoin price analysis
On April 19, Bitcoin fell and closed below the 20-day exponential moving average ($28,869). This marked the first close beneath the 20-day EMA since March 13, indicating a sign of weakness.
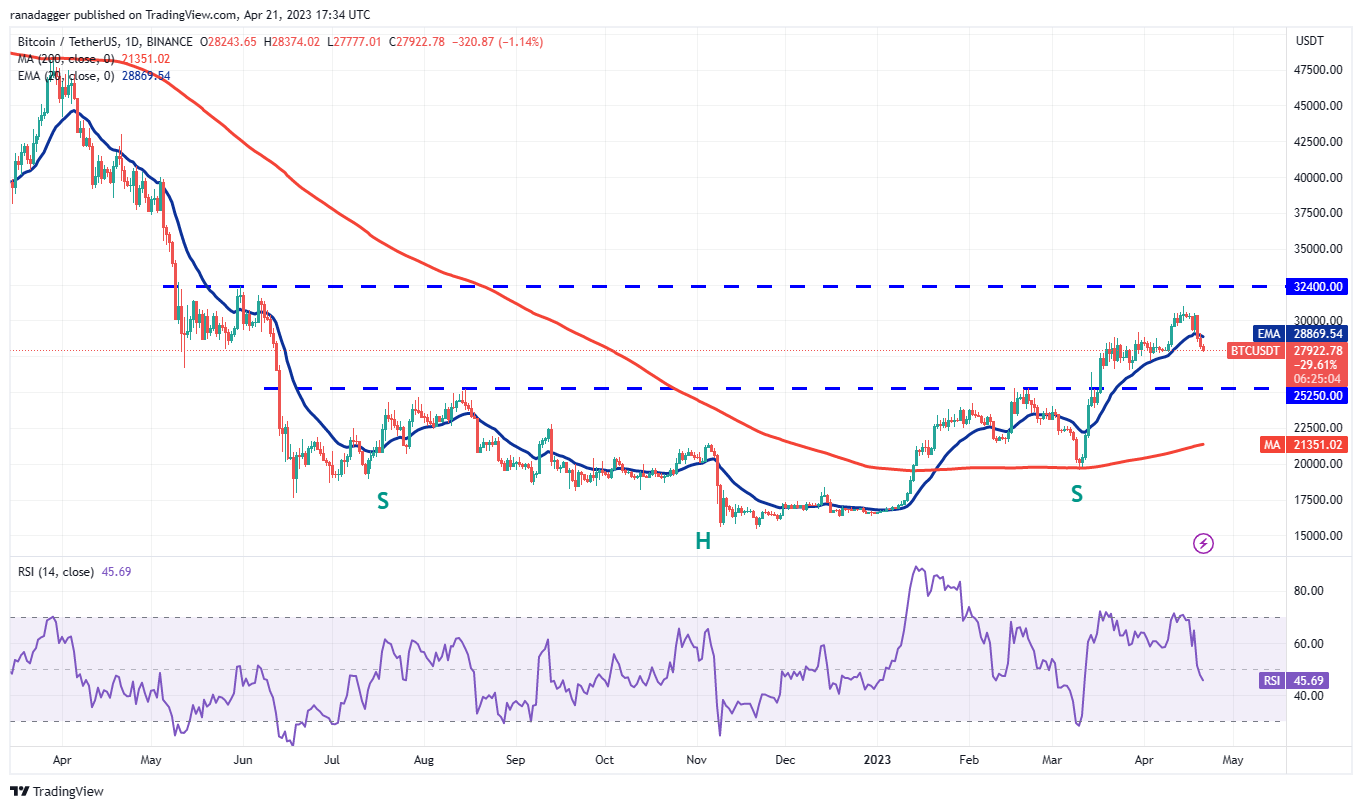 BTC/USDT daily chart. Source: TradingView
Buyers attempted to initiate a recovery on April 20 but were unable to surpass the resistance at the 20-day EMA. This suggests that sellers are trying to convert this level into resistance. The BTC/USDT pair may next decline to $26,500 and subsequently to the neckline of the inverse head and shoulders (H&S) pattern at $25,250.
If the price bounces off $25,250, it will indicate that the neckline is functioning as a higher support level. The bulls will then aim to push the price back above the 20-day EMA. If successful, the pair may rise to $32,400.
Ether price analysis
The bulls attempted to keep the price above the 20-day EMA ($1,942) on April 19 and 20, but the bears had other intentions. They maintained selling pressure and pulled Ether (ETH) below the 20-day EMA on April 21.
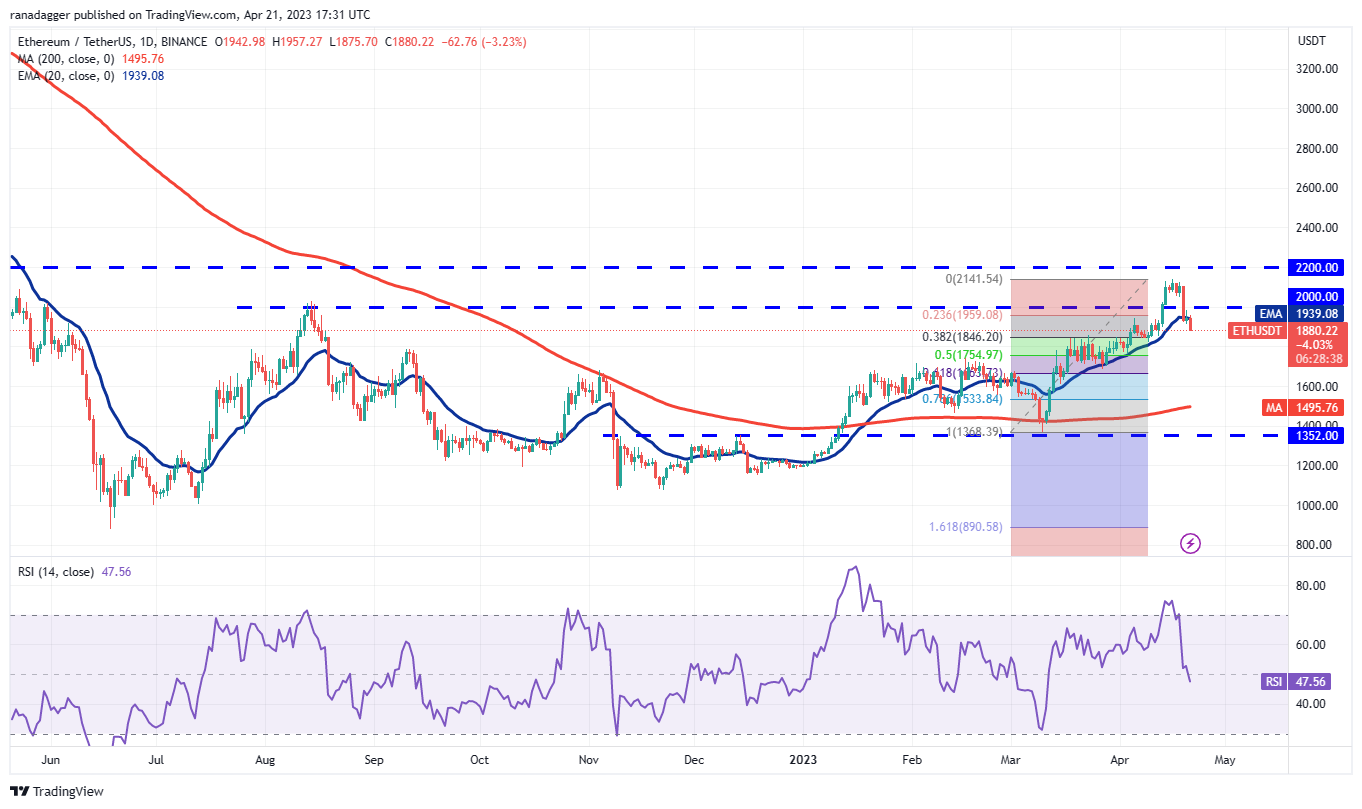 ETH/USDT daily chart. Source: TradingView
The initial support on the downside is the 38.2% Fibonacci retracement level of $1,846. This level is likely to attract significant buying interest from the bulls. If the price rebounds from this level, it enhances the chances of a rally to $2,200.
Conversely, if the price continues to decline and breaks below $1,846, the ETH/USDT pair could fall to the 50% retracement level of $1,755 and then to the 61.8% retracement level of $1,663.
BNB price analysis
BNB (BNB) bounced off the $318 support on April 21 and climbed above the 20-day EMA ($324). This indicates that the bulls are making a concerted effort to halt the decline at $318.
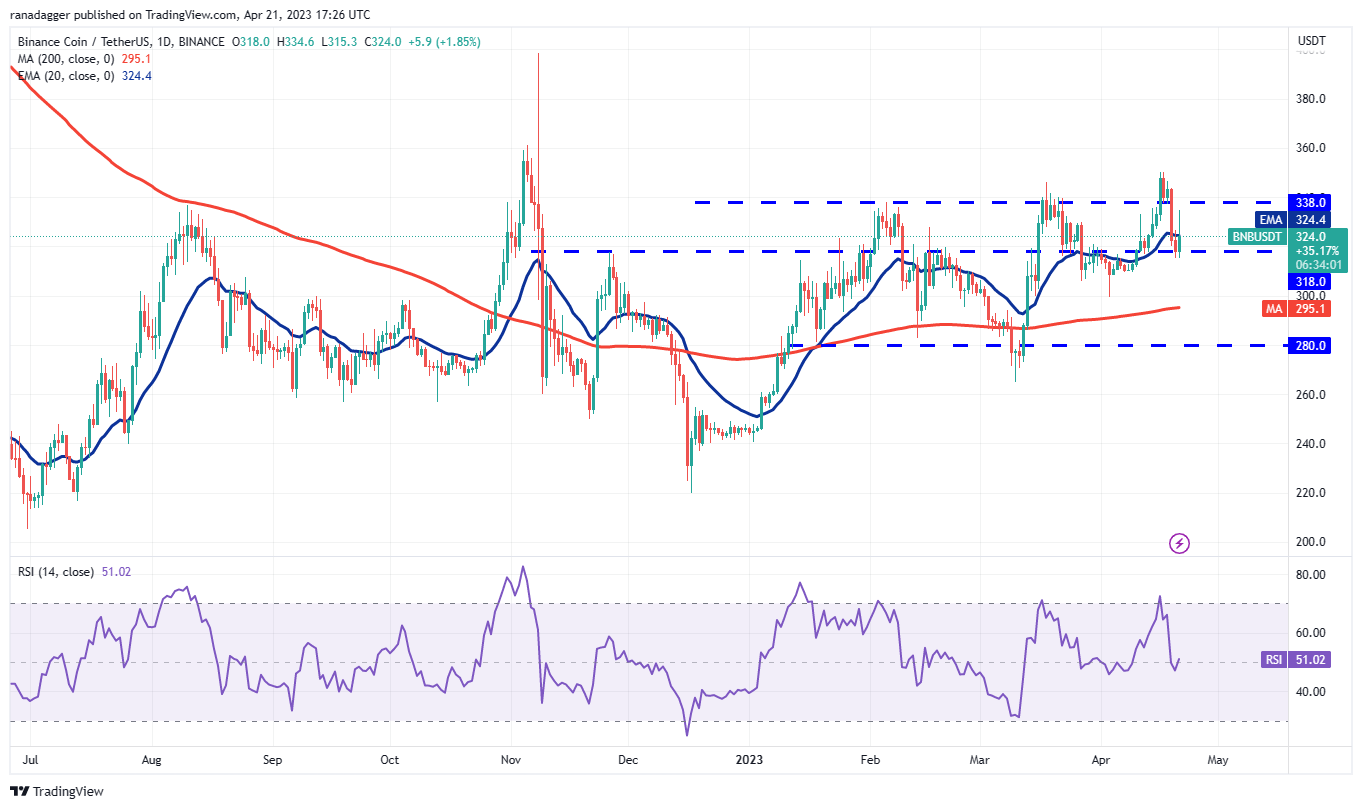 BNB/USDT daily chart. Source: TradingView
The flat 20-day EMA and the relative strength index (RSI) just above the midpoint do not provide a clear advantage to either the bulls or the bears. If bulls push the price above the $338 to $350 resistance zone, the BNB/USDT pair may gain momentum and surge toward $400.
On the other hand, if the price turns down again and breaks below $318, it will indicate that sellers remain active at higher levels. The pair may then decline to the 200-day simple moving average ($295), which is a critical level for the bulls to defend.
XRP price analysis
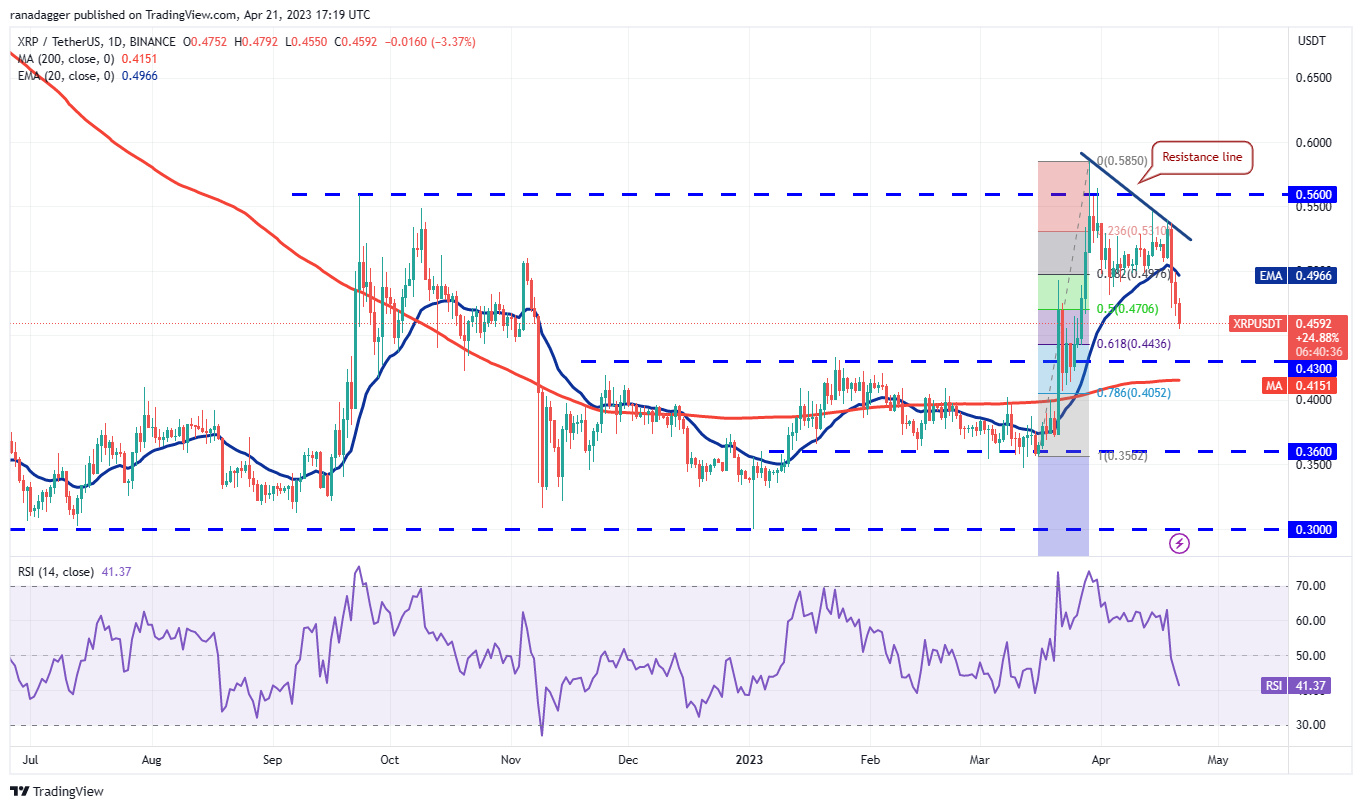
The bulls attempted to initiate a recovery in XRP (XRP) and push the price above the 20-day EMA ($0.49) on April 19 and 20, but the bears were unyielding.
 XRP/USDT daily chart. Source: TradingView
The bulls tried to halt the decline near the 50% Fibonacci retracement level of $0.47, but the bears maintained selling pressure and pulled the price below this level. The XRP/USDT pair may next drop to the 200-day SMA ($0.41).
The pair appears to be trading within a broad range between $0.56 and $0.30 for the time being. If the price rebounds off the 200-day SMA, the pair may trade in the upper half of the range, while a break below it may confine the pair to the lower half.
Cardano price analysis
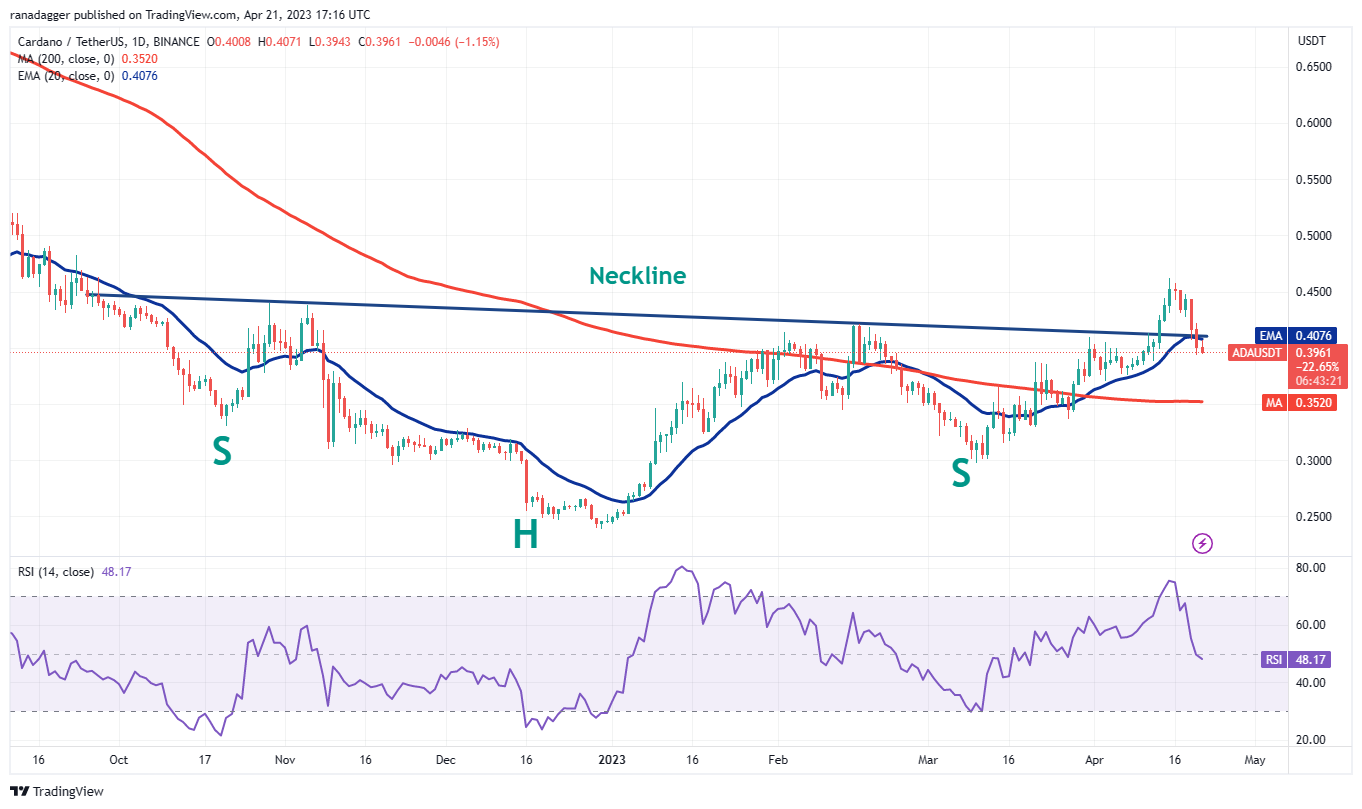
The bears successfully pulled Cardano (ADA) back below the neckline of the inverse H&S pattern on April 20. This indicates that the bears are regaining strength.
 ADA/USDT daily chart. Source: TradingView
If bears manage to keep the price below the neckline, it will suggest that the breakout on April 13 may have been a bull trap. This could lead to long liquidations, potentially extending the decline to the 200-day SMA ($0.35), a level likely to attract strong buying from the bulls.
The flat 20-day EMA ($0.40) and the RSI near the midpoint do not provide a clear advantage to either side. If bulls wish to prevail, they must push and maintain the price above the neckline. The ADA/USDT pair may then rise to $0.46.
Related Posts
Dogecoin price analysis
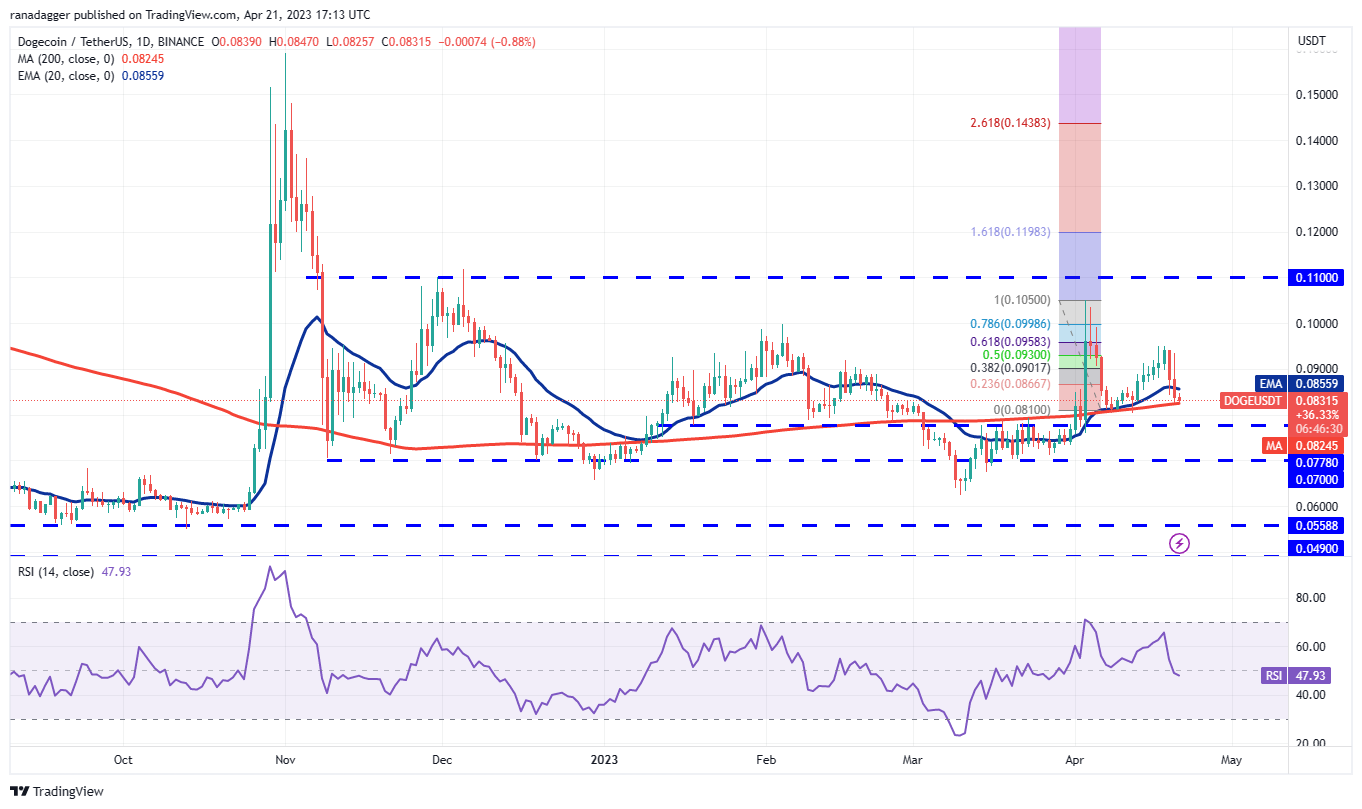
Dogecoin (DOGE) experienced significant volatility on April 19 and 20. The bulls are attempting to hold the 200-day SMA ($0.08) but are encountering strong resistance from the bears.
 DOGE/USDT daily chart. Source: TradingView
If the price declines from the 20-day EMA ($0.09), it will indicate that bears are selling during every minor rally. This would heighten the risk of a drop below the 200-day SMA. If that occurs, the DOGE/USDT pair may plunge to the critical support at $0.07.
This negative outlook will be negated if the price rebounds from the current level and rises above $0.10. This would indicate strong buying near the 200-day SMA. The pair may then reach $0.11, where the bulls may again face significant resistance from the bears.
Polygon price analysis
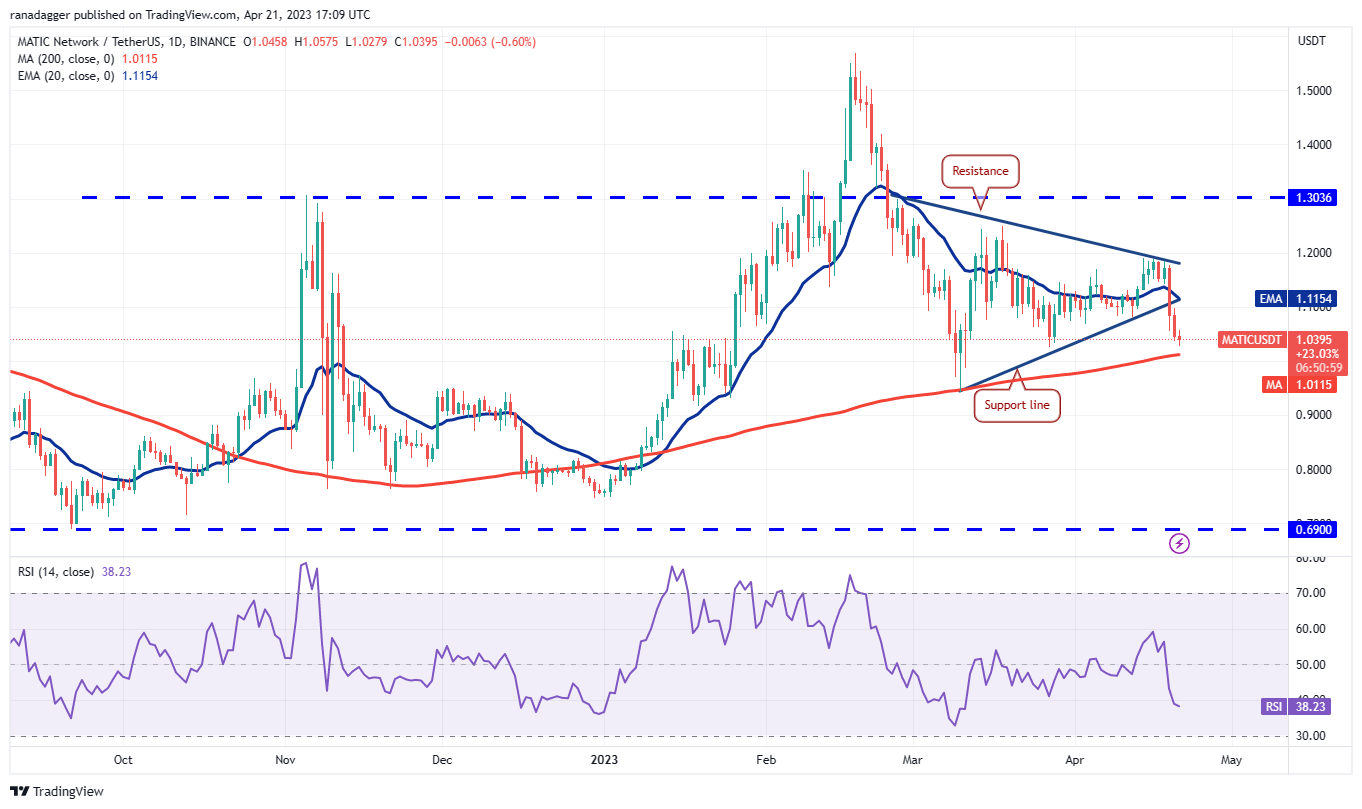
The uncertainty surrounding the symmetrical triangle pattern in Polygon (MATIC) resolved negatively with a break below the support line on April 19.
 MATIC/USDT daily chart. Source: TradingView
The bulls are attempting to defend the 200-day SMA ($1.01), but any recovery is likely to encounter strong resistance at the 20-day EMA ($1.11). If the price declines from the 20-day EMA, it will increase the likelihood of a break below the 200-day SMA. This could escalate selling and drive the MATIC/USDT pair toward the pattern target of $0.74.
Conversely, if bulls manage to push the price above the 20-day EMA, it will indicate robust buying at lower levels. The pair may then rise to the resistance line of the triangle. A break and close above this level may shift the advantage to the bulls.
Related: Warren Buffett was wrong about a 'rat poison' Bitcoin portfolio, data shows
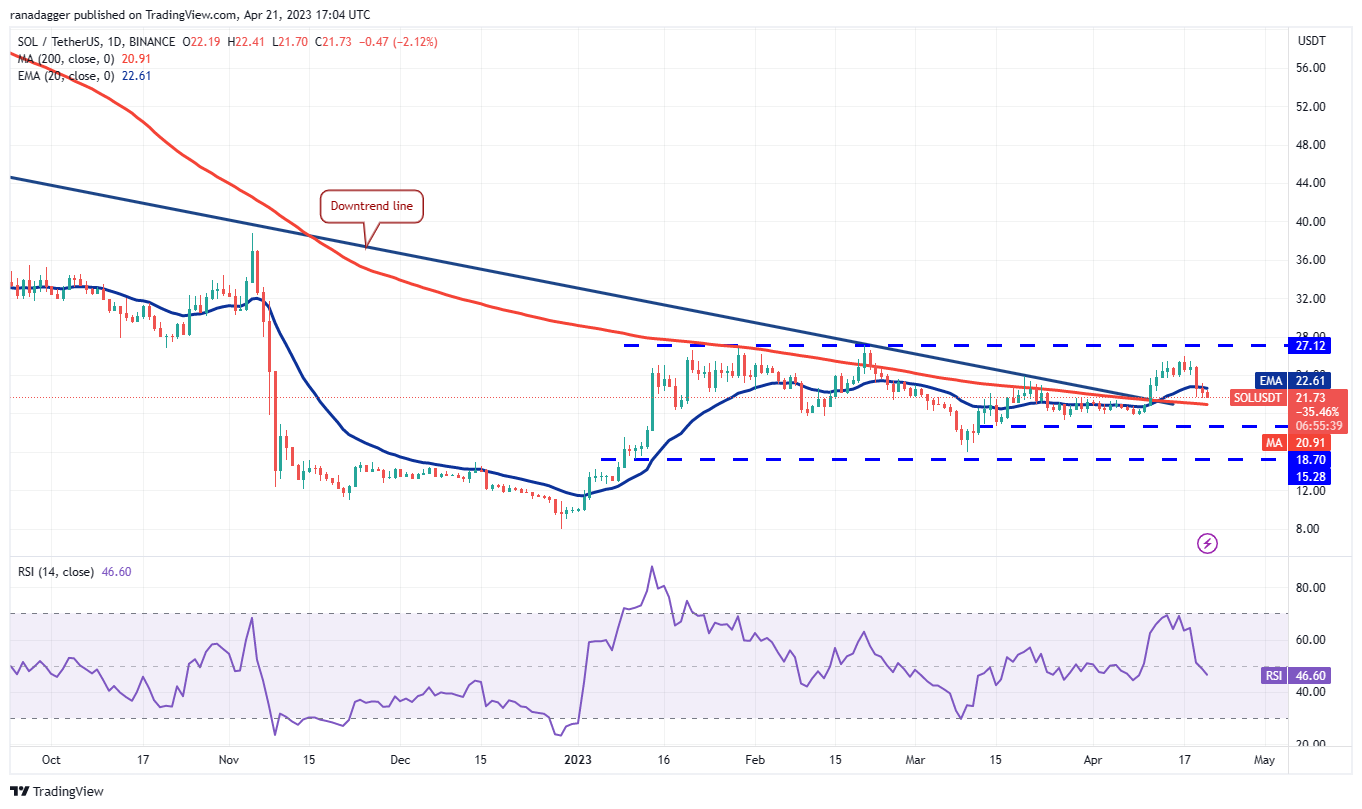
Solana price analysis
Solana (SOL) has been caught between the 20-day EMA ($22.61) and the 200-day SMA ($20.91) for the last two days.
 SOL/USDT daily chart. Source: TradingView
Although the bears have pulled the price below the 20-day EMA, they have yet to retest the 200-day SMA. This indicates a lack of aggressive selling at lower levels.
The 20-day EMA is flattening, and the RSI is just below the midpoint, suggesting a range-bound movement in the near term.
The SOL/USDT pair may fluctuate within the broad range between $27.12 and $15.28 for a while. If the price falls below the 200-day SMA, the pair may decline to $18.70, but if the price rises above the 20-day EMA, the pair may surge to $27.12.
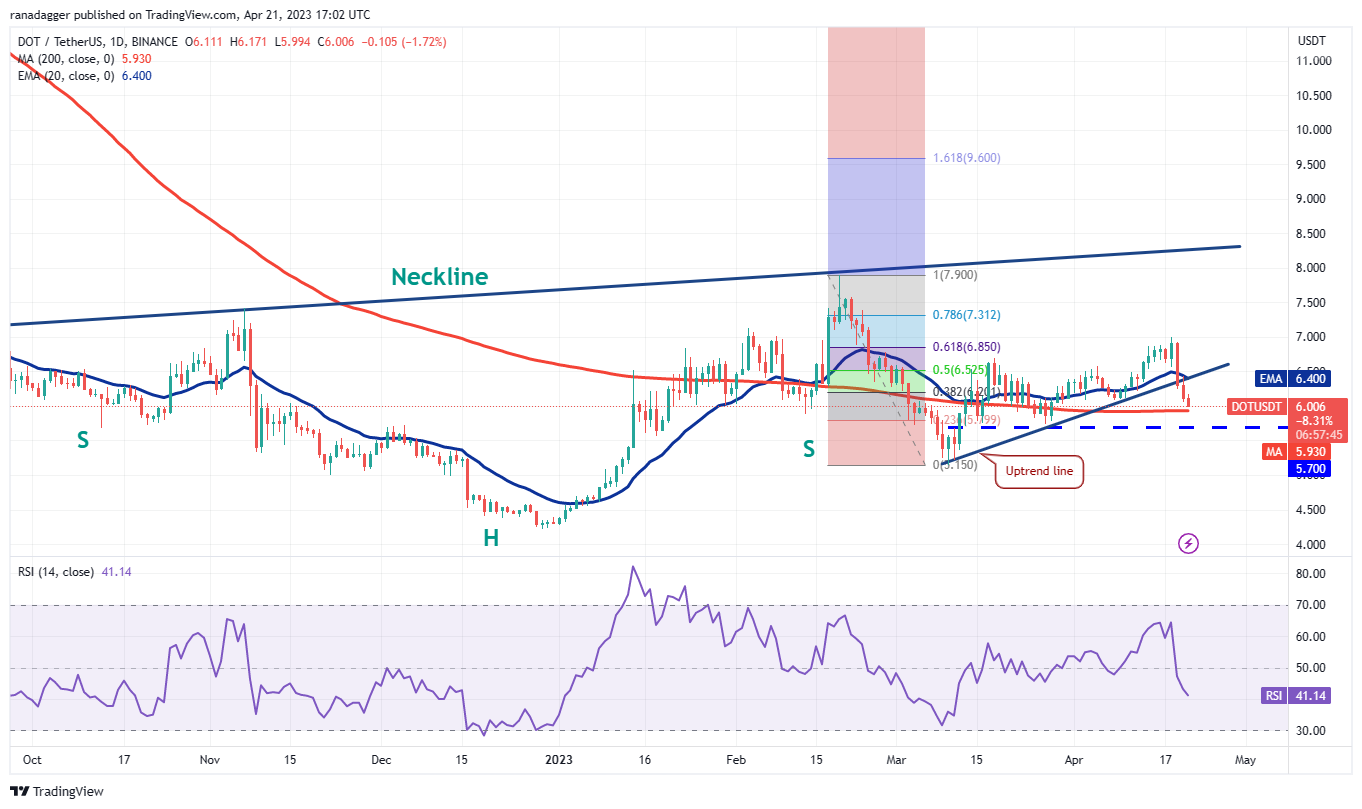
Polkadot price analysis
Polkadot (DOT) sharply declined and fell below the uptrend line on April 19. This reflects aggressive selling by the bears.
 DOT/USDT daily chart. Source: TradingView
The bulls attempted to push the price back above the 20-day EMA on April 20, but the long wick on the candlestick indicates that the bears successfully defended this level. This initiated a downward movement toward the 200-day SMA ($5.93).
Buyers are expected to vigorously protect the area between the 200-day SMA and $5.70 because if they fail, selling pressure may escalate further, and the DOT/USDT pair could drop to $5.15. This bearish outlook will be invalidated in the short term if bulls manage to push and maintain the price above the uptrend line.
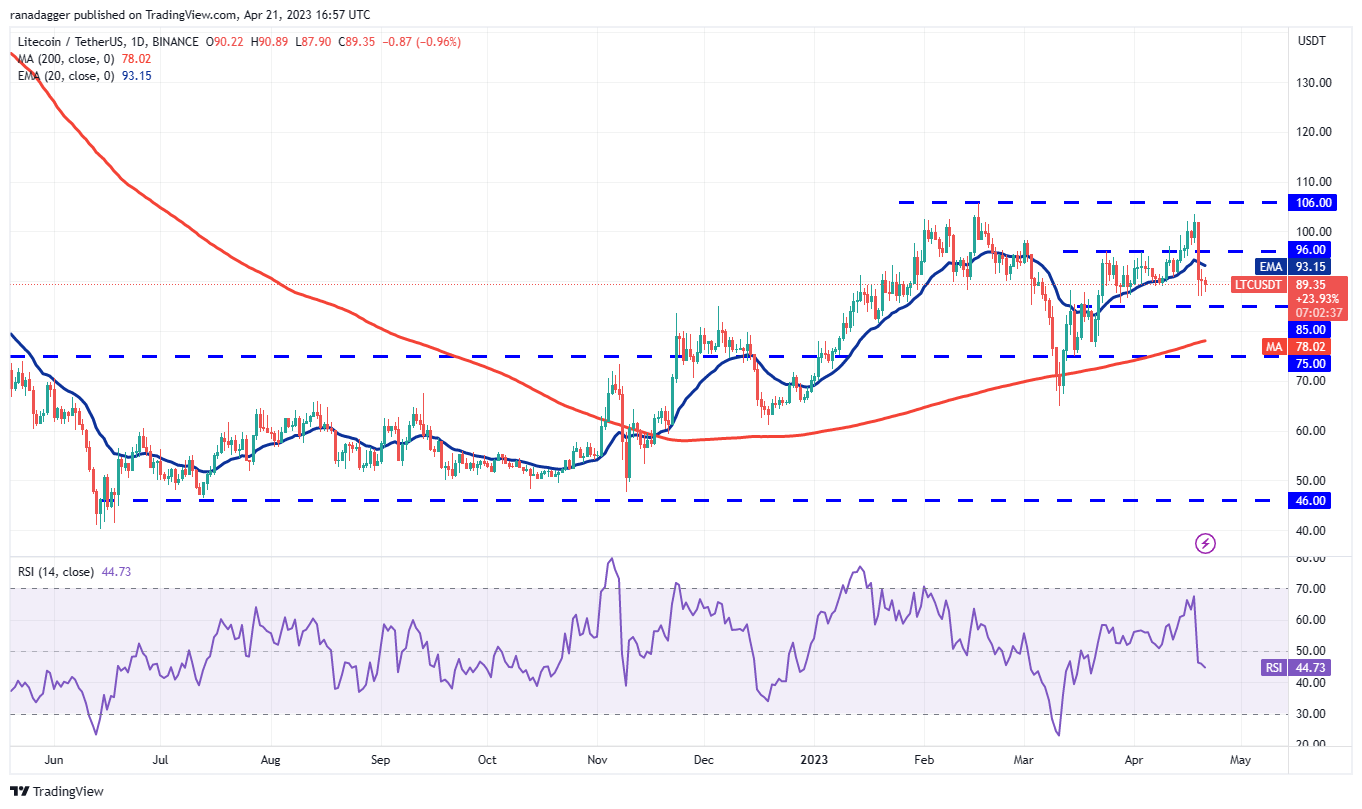
Litecoin price analysis
Litecoin (LTC) fell below the 20-day EMA ($93) on April 19, indicating a weakening of bullish momentum.
 LTC/USDT daily chart. Source: TradingView
Buyers attempted to push the price back above the 20-day EMA on April 20, but the bears did not relent. This suggests that sellers are trying to convert the 20-day EMA into resistance.
The sellers will next aim to strengthen their position by driving the price below the strong support at $85. If they succeed, the LTC/USDT pair may reach the 200-day SMA ($78).
If bulls wish to avert this decline, they must quickly push the price above the 20-day EMA and the overhead resistance of $96.
This article does not contain investment advice or recommendations. Every investment and trading move involves risk, and readers should conduct their own research when making a decision.
This article is for general information purposes and is not intended to be and should not be taken as legal or investment advice. The views, thoughts, and opinions expressed here are the author’s alone and do not necessarily reflect or represent the views and opinions of Cointelegraph.