Disclaimer: Information found on CryptoreNews is those of writers quoted. It does not represent the opinions of CryptoreNews on whether to sell, buy or hold any investments. You are advised to conduct your own research before making any investment decisions. Use provided information at your own risk.
CryptoreNews covers fintech, blockchain and Bitcoin bringing you the latest crypto news and analyses on the future of money.
The stock markets in the United States are attempting to rebound following reports that discussions regarding the debt ceiling are progressing positively, potentially averting a debt default. In contrast, the cryptocurrency markets are not exhibiting the same level of optimism. On May 17, Bitcoin (BTC) fell back below the $27,000 support level, suggesting that buyers are having difficulty maintaining the recent relief rallies.
Institutional investors appear to be taking profits amid macroeconomic uncertainties. According to CoinShares’ Digital Asset Fund Flows Report, there has been a total outflow of $200 million from digital asset investment products over the last four weeks.
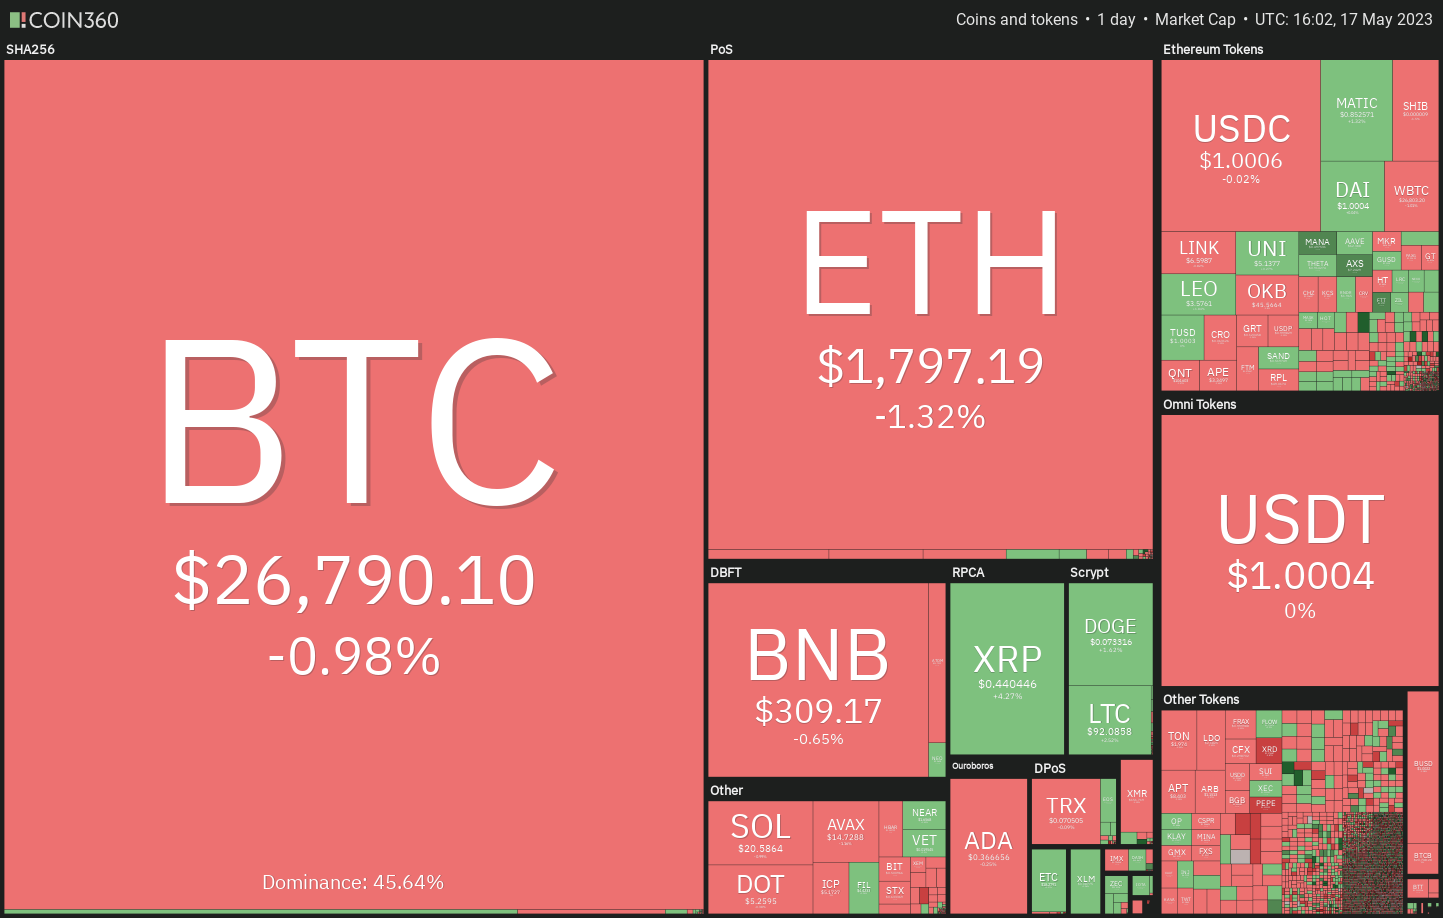 Daily cryptocurrency market performance. Source: Coin360
While the short-term outlook remains pessimistic, the chart structure for Bitcoin has not been compromised. Bitcoin has retraced approximately 15% from its recent peak of $31,000 reached on April 14, yet it continues to stay above $25,000, indicating that the current weakness may represent a corrective phase within a bullish trend.
What are the critical support levels that bulls must maintain to initiate the next rally for Bitcoin and altcoins? Let’s analyze the charts of the top 10 cryptocurrencies to uncover the details.
Bitcoin price analysis
Bitcoin’s recovery faced resistance at the 20-day exponential moving average (EMA) at $27,694 on May 15, signaling that market sentiment remains negative and that bears are selling during rallies.
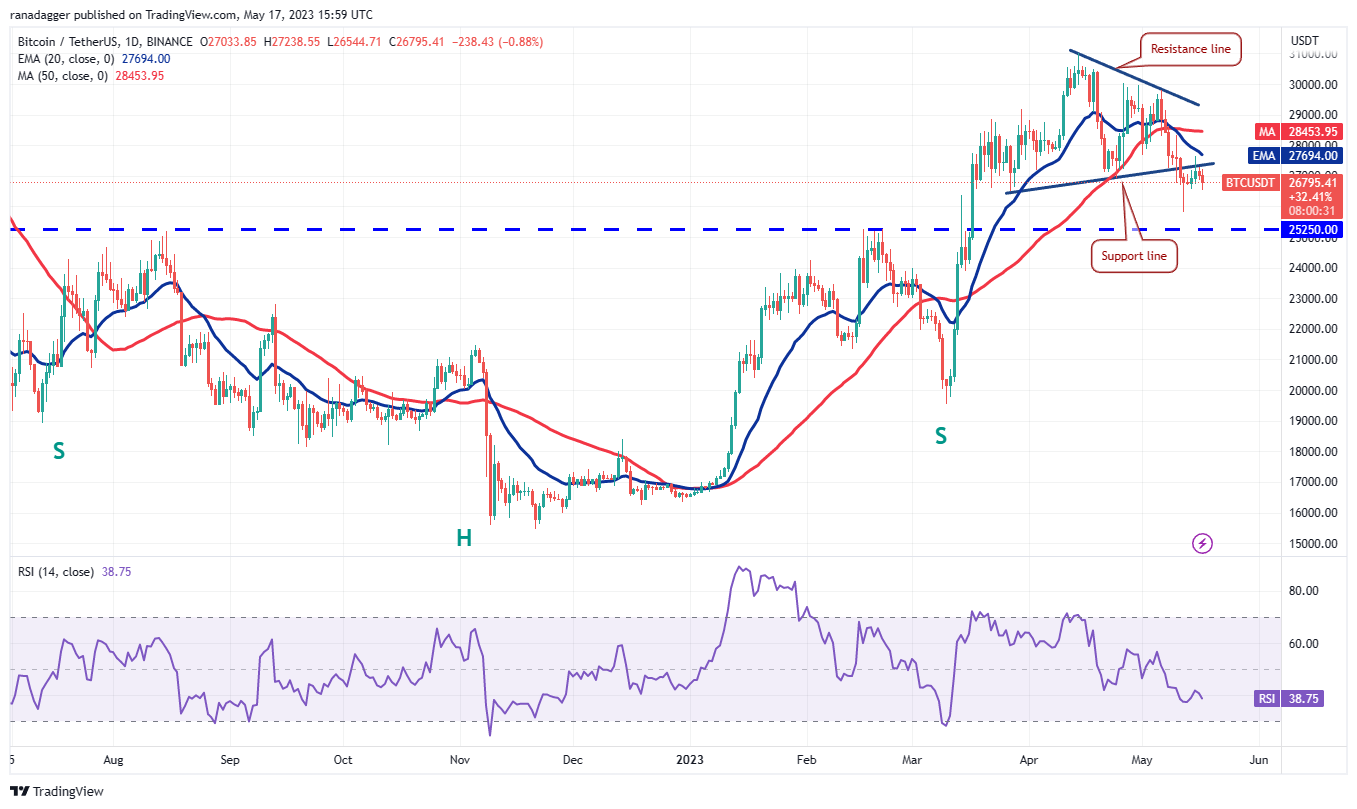 BTC/USDT daily chart. Source: TradingView
Bears will attempt to push the price below the immediate support at $26,500, which could pave the way for a decline to $25,250. This level is crucial to monitor, as a breach below it may intensify selling pressure. The BTC/USDT pair could then potentially drop to $20,000.
Conversely, if the price rebounds from $25,250, it would indicate that bulls are trying to defend the neckline of the inverse head-and-shoulders pattern. Initiating a new rally will be challenging for the bulls, as the recovery is likely to encounter selling pressure at the moving averages and again at the resistance line.
Ether price analysis
Ether (ETH) declined from the 20-day EMA ($1,844) on May 17, indicating that bears are vigorously defending this level.
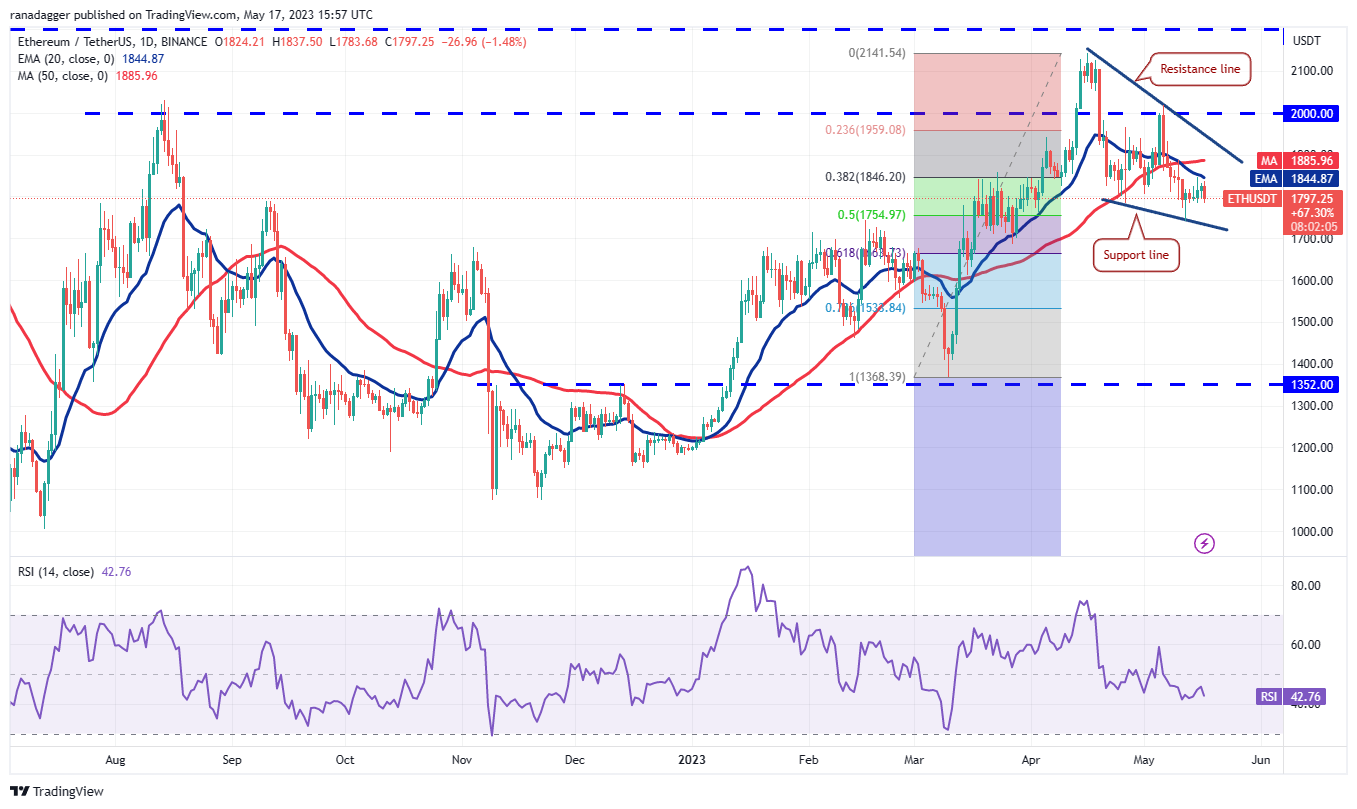 ETH/USDT daily chart. Source: TradingView
The recent price movements have formed a falling wedge pattern, and the ETH/USDT pair may slide to the support line. This is a significant level to monitor because if bears manage to push the price below the wedge, the pair could fall to $1,600.
Alternatively, if the price bounces off the support line, bulls will make another attempt to push the pair above the 20-day EMA. If successful, the pair could rise to the resistance line of the wedge.
BNB price analysis
BNB (BNB) declined from the 20-day EMA ($316) on May 15, indicating that bears are active at higher price levels.
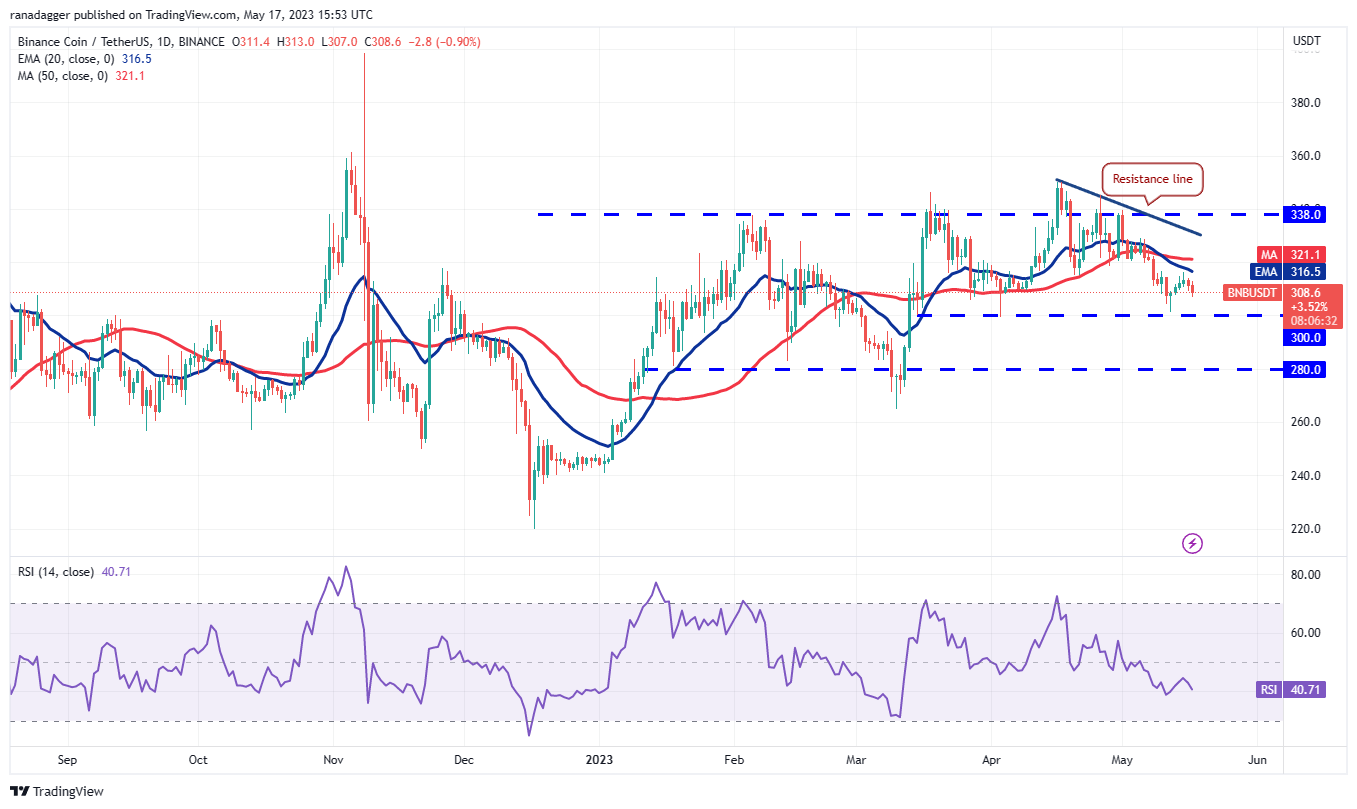 BNB/USDT daily chart. Source: TradingView
Sellers will again attempt to drive the price down to the strong support at $300. This level is critical for bulls to defend, as a failure to do so could result in the BNB/USDT pair extending its decline to $280.
On the other hand, if the price rebounds from $300, it will indicate demand at lower levels. The pair could then rise again to the moving averages. Buyers will need to overcome this hurdle to improve the chances of a rally to the resistance line.
XRP price analysis
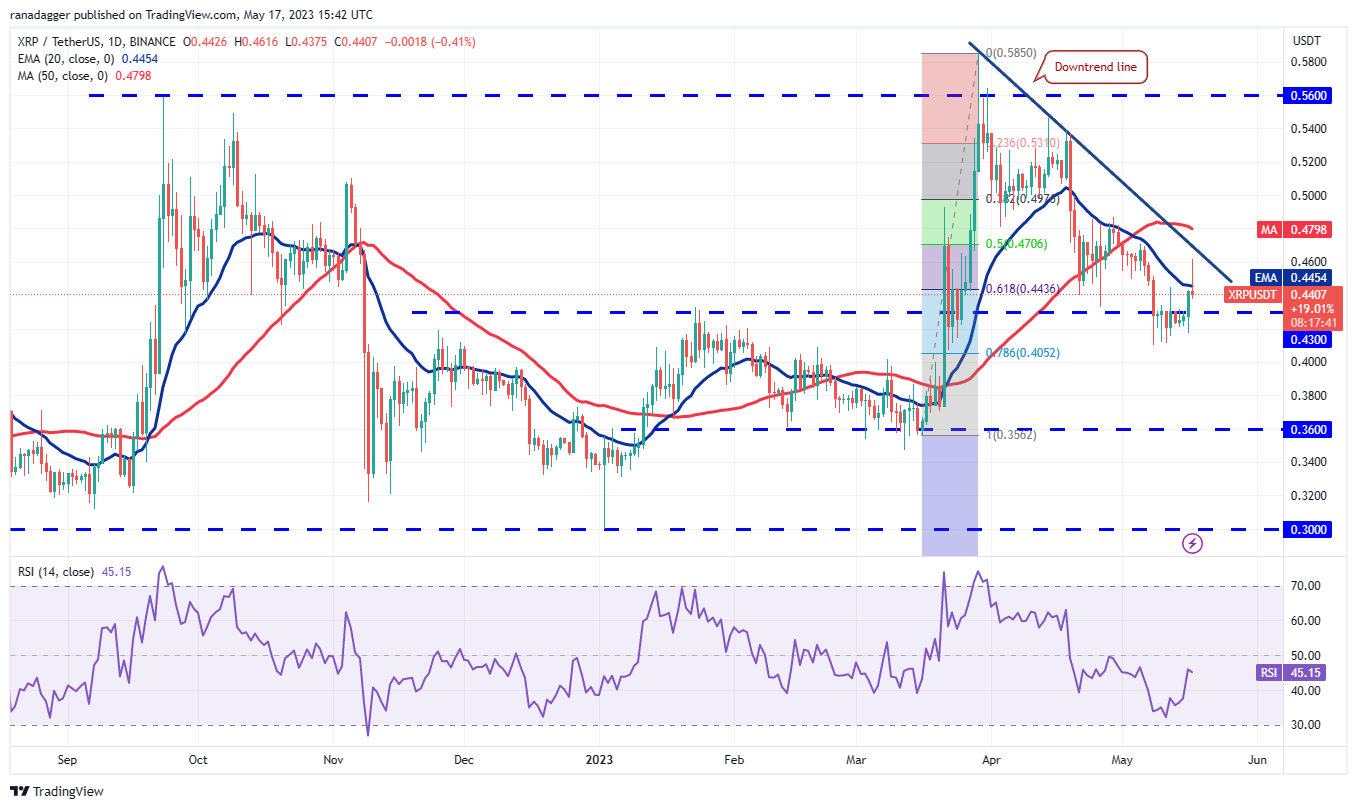
After trading within a narrow range near $0.43 for several days, XRP (XRP) broke above the overhead resistance on May 16.
 XRP/USDT daily chart. Source: TradingView
Bulls continued their buying momentum and pushed the price above the 20-day EMA ($0.44) on May 17. However, the long wick on the day’s candlestick indicates that bears are selling during relief rallies at the downtrend line. This suggests that the XRP/USDT pair may fluctuate between the downtrend line and $0.40 for a period.
Buying pressure could increase if bulls manage to drive and maintain the price above the 50-day simple moving average (SMA) at $0.48. This may clear the way for a potential rally to the overhead zone of $0.54 to $0.58.
Cardano price analysis
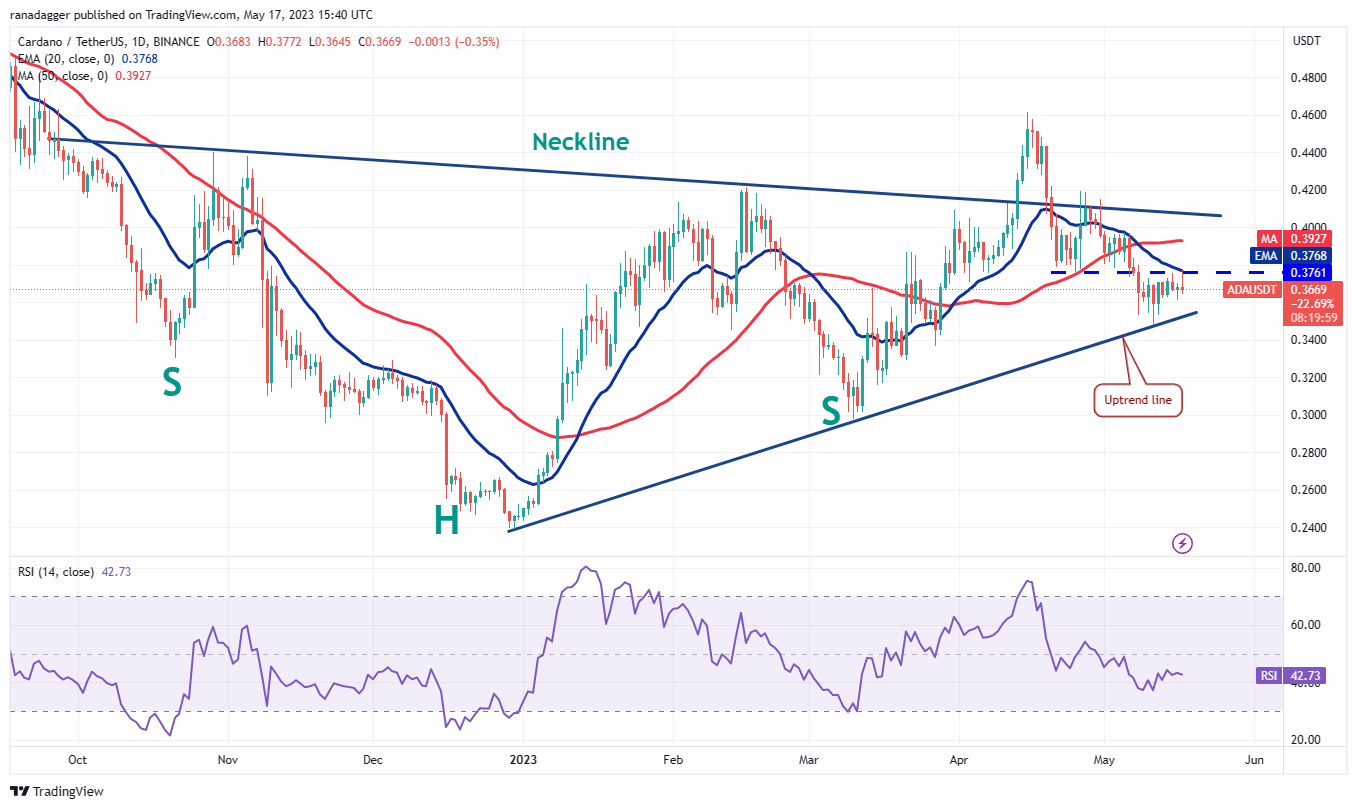
Bulls attempted to push Cardano (ADA) above the $0.38 resistance on May 15 and May 17, but the long wick on the candlesticks indicates that bears are fiercely defending this level.
 ADA/USDT daily chart. Source: TradingView
The 20-day EMA ($0.37) is trending downward, and the relative strength index (RSI) is near 43, suggesting that bears have a slight advantage. Sellers will next attempt to push the price below the uptrend line. If successful, the ADA/USDT pair could decline to $0.30.
Related Posts
Conversely, if the price rebounds from the current level or the uptrend line and rises above $0.38, it will indicate that bulls are regaining control. The pair may then rally to $0.42, which is likely to act as a strong resistance level again.
Dogecoin price analysis
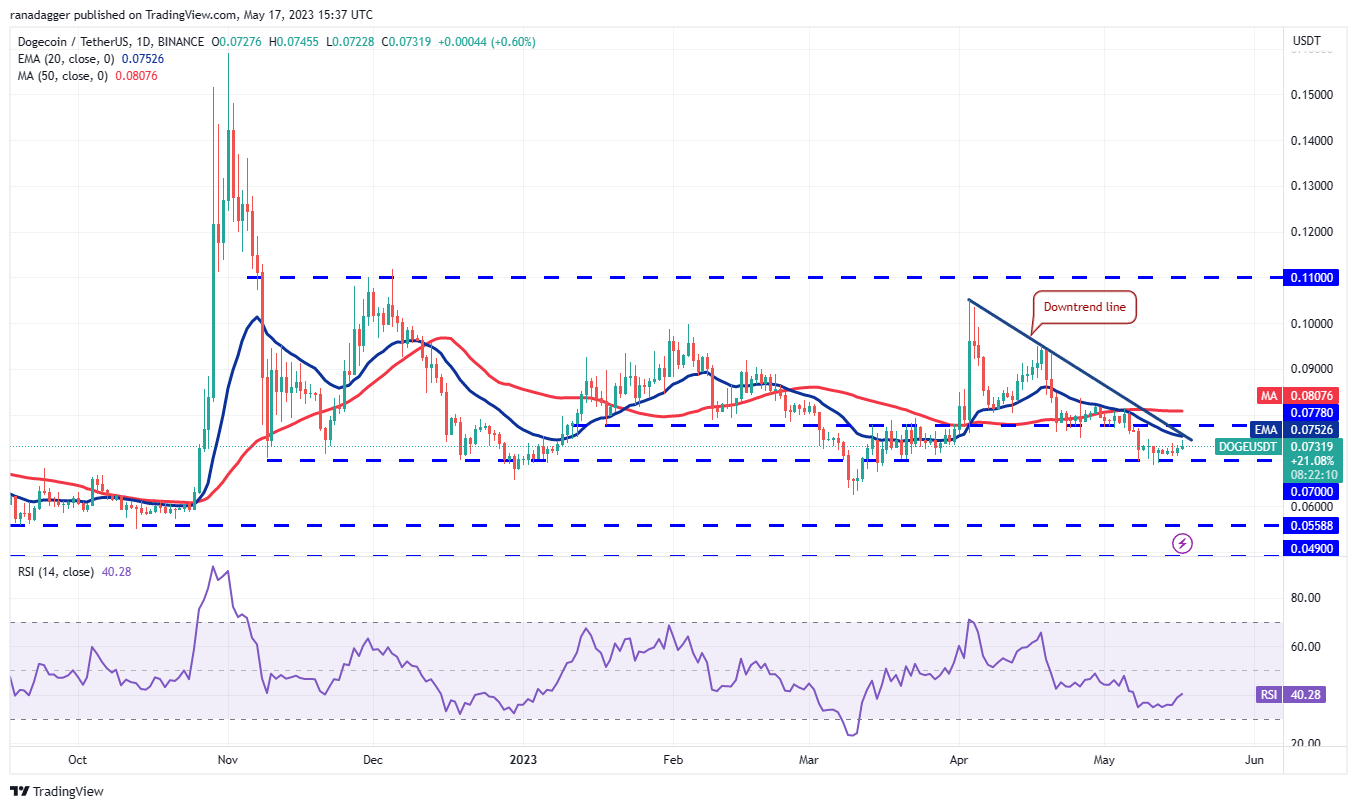
Dogecoin (DOGE) is finding buyers at $0.07, but the inability to achieve a significant bounce suggests that demand is waning at higher levels.
 DOGE/USDT daily chart. Source: TradingView
Bears are expected to vigorously defend the area between the downtrend line and the 50-day SMA ($0.08). If the price declines from this zone, bears will make another attempt to push the DOGE/USDT pair below $0.07.
Another scenario is that the price rises from the current level and surpasses the 50-day SMA. If this occurs, it will indicate the beginning of a strong relief rally. The pair may initially rally to $0.10 and subsequently to $0.11.
Polygon price analysis
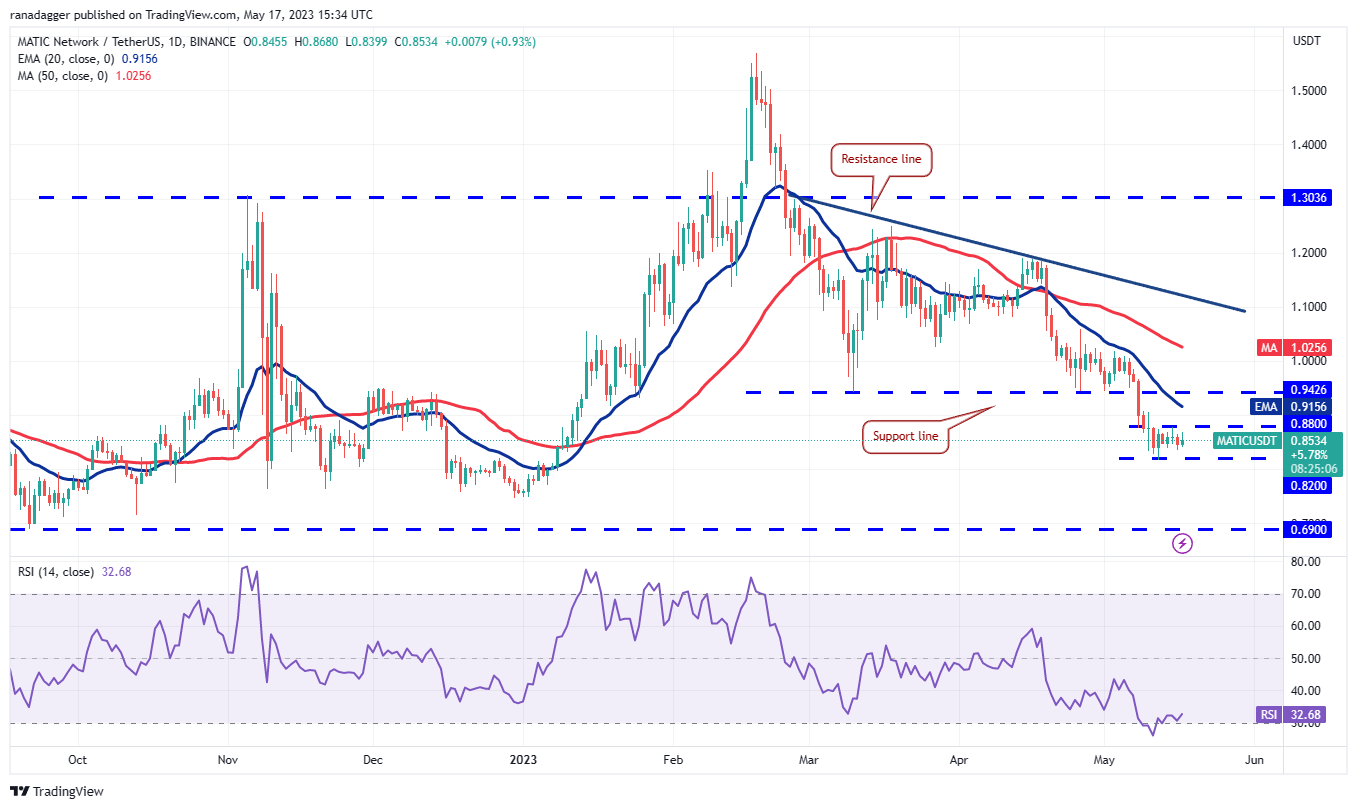
Polygon (MATIC) has been trading within a narrow range between $0.82 and $0.88 for the past few days, reflecting indecision among buyers and sellers.
 MATIC/USDT daily chart. Source: TradingView
The declining moving averages and the RSI near oversold territory indicate that bears are in control. If the price breaks below $0.82, selling pressure could increase, and the MATIC/USDT pair may fall to $0.69.
On the upside, bulls are likely to encounter significant resistance in the area between the 20-day EMA ($0.91) and $0.94. A breakout above this zone will be the first sign that selling pressure is easing.
Related: Why is XRP price up today?
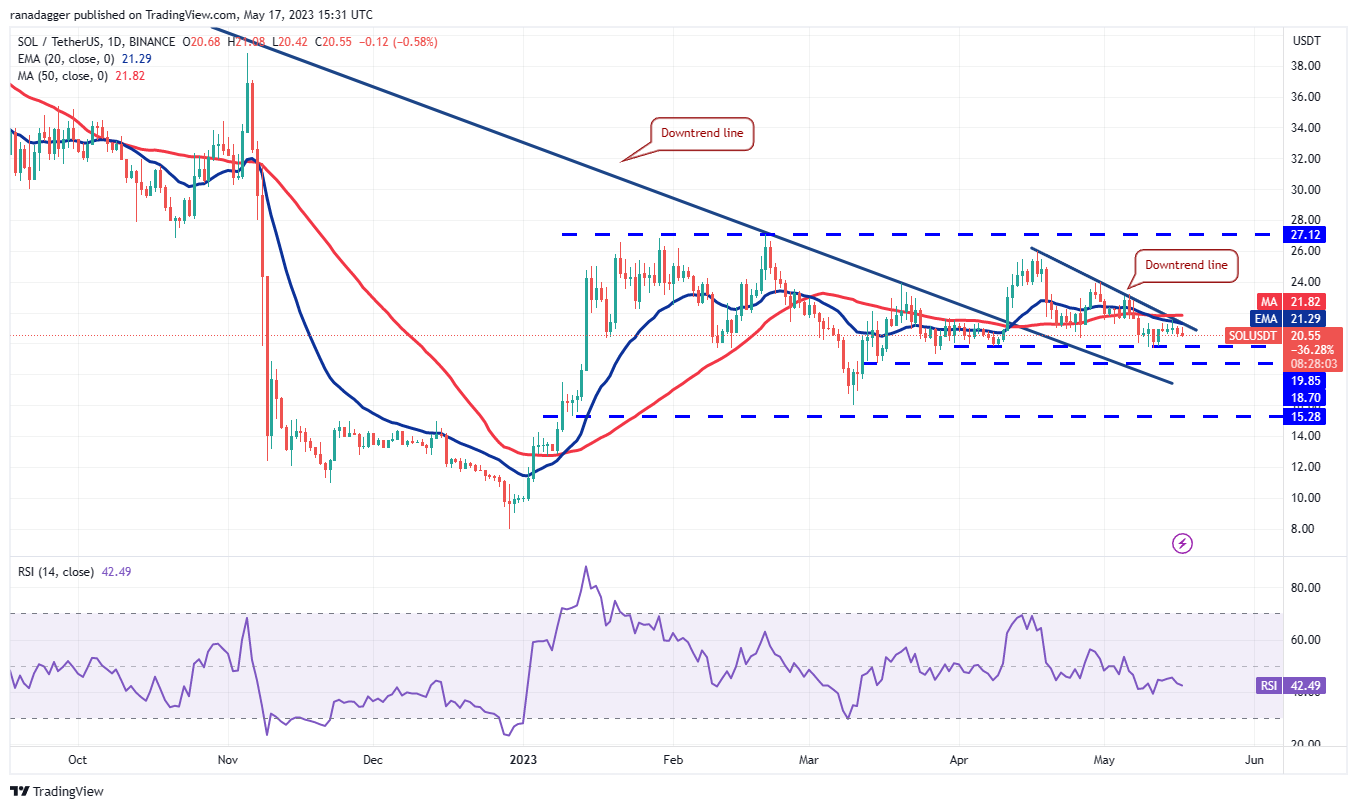
Solana price analysis
Buyers attempted to push Solana (SOL) above the downtrend line on May 15, but the long wick on the candlestick indicates that bears are defending this level.
 SOL/USDT daily chart. Source: TradingView
The price remains trapped between the downtrend line and the horizontal support at $19.85, but this tight-range trading is unlikely to persist for long. Bears will attempt to pull the price below $19.85 and challenge the support at $18.70.
Conversely, bulls will strive to push and maintain the price above the 50-day SMA ($21.83) to signal the beginning of a sustained recovery. The SOL/USDT pair could then rally to $24 and subsequently to $26.
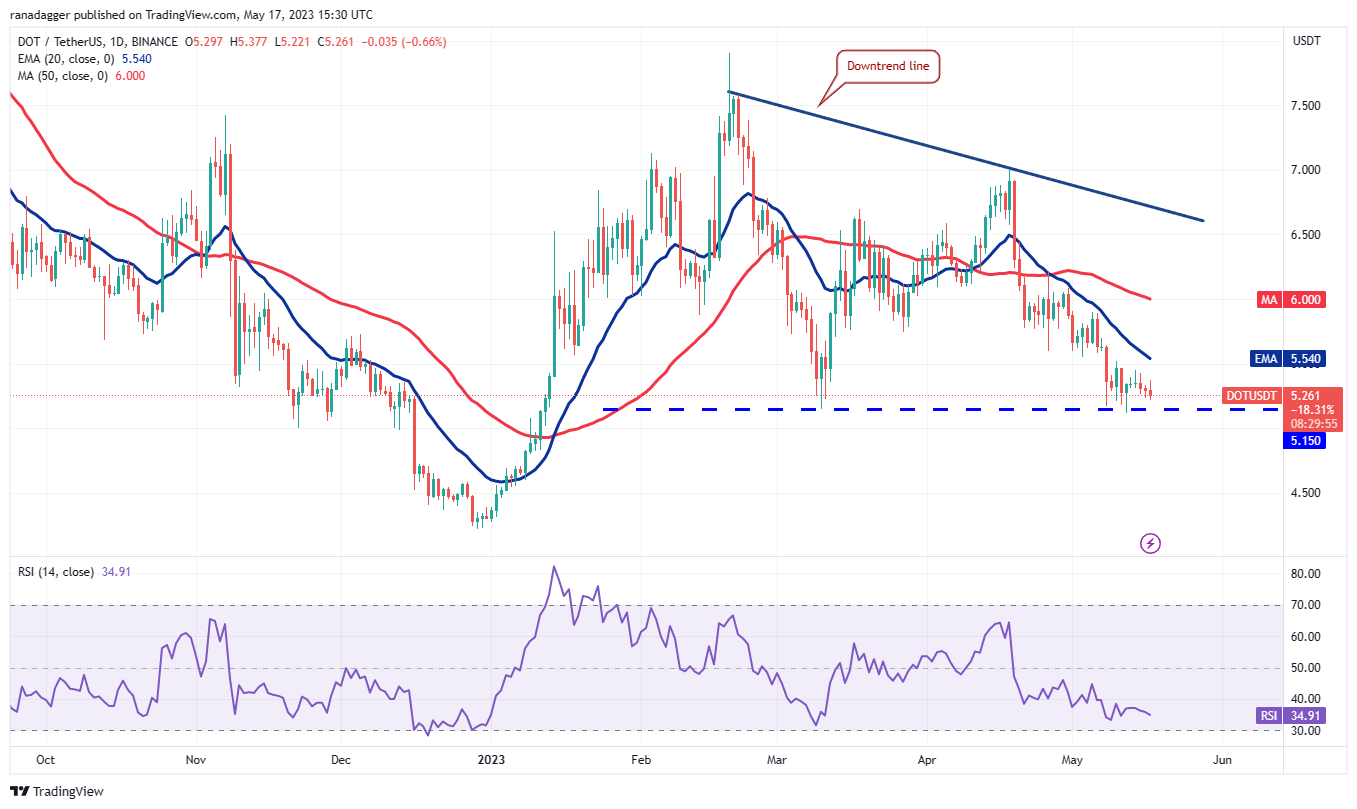
Polkadot price analysis
Polkadot (DOT) has been consolidating near the critical support level of $5.15 for several days. The lack of a strong rebound suggests insufficient aggressive buying at current levels.
 DOT/USDT daily chart. Source: TradingView
The declining 20-day EMA ($5.54) and the RSI in the negative zone indicate that bears are in control. If the $5.15 support fails, selling pressure could increase, and the DOT/USDT pair may drop to $4.50 and then to $4.22.
Buyers will need to push the price above the 20-day EMA to signal a recovery. The pair may then rise to the 50-day SMA ($6) and later attempt a rally to the downtrend line. A breakout above this resistance will indicate that the momentum has shifted in favor of the bulls.
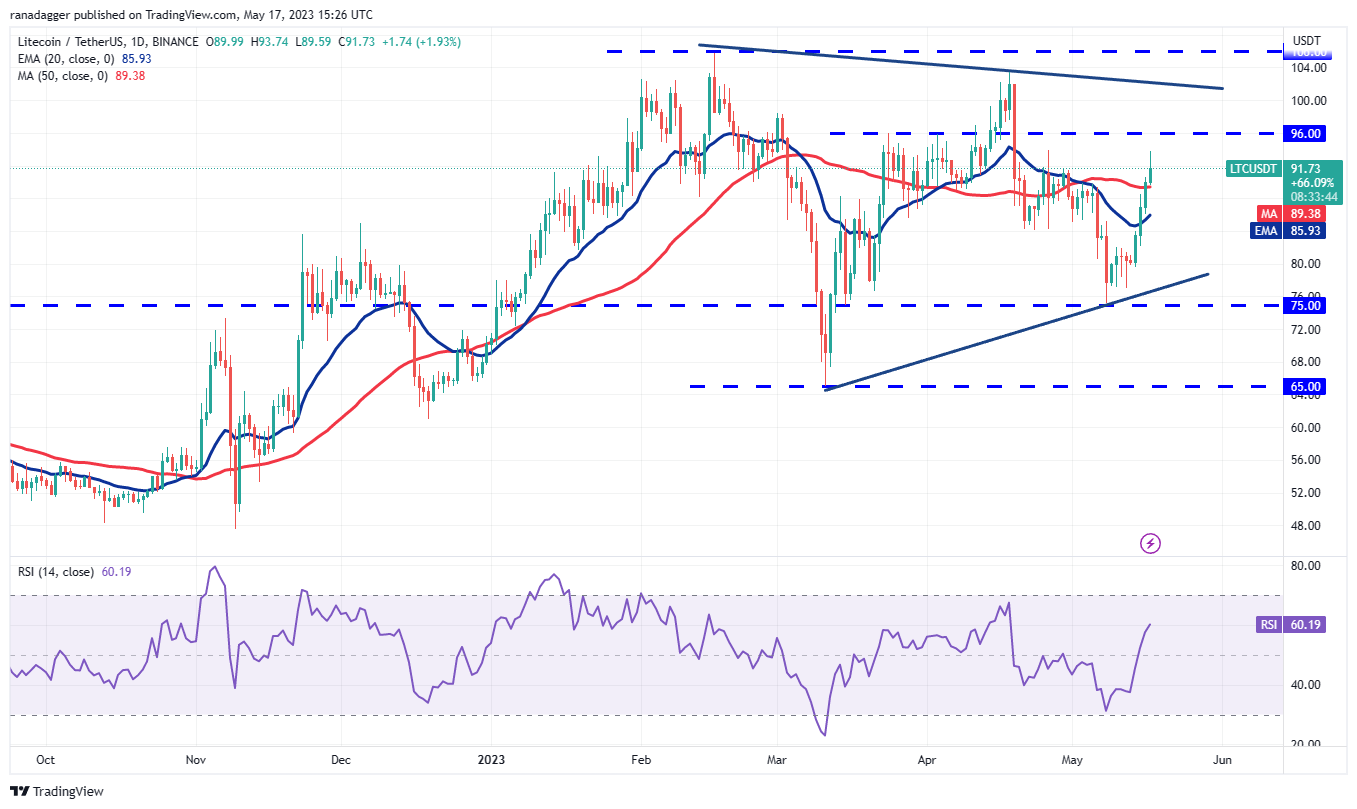
Litecoin price analysis
Litecoin (LTC) surpassed the 20-day EMA ($85) on May 15 and continued with another upward movement above the 50-day SMA ($89) on May 16.
 LTC/USDT daily chart. Source: TradingView
The LTC/USDT pair is approaching $96, where bears are expected to mount a strong defense. If bulls maintain their position at this level, the likelihood of a breakout above $96 increases. The pair could then retest the overhead level at $106.
Conversely, if the price sharply declines from $96 and breaks below the moving averages, it will indicate that bears are maintaining their position. The pair may then oscillate between $75 and $96 for several more days.
This article does not contain investment advice or recommendations. Every investment and trading move involves risk, and readers should conduct their own research when making a decision.
This article is for general information purposes and is not intended to be and should not be taken as legal or investment advice. The views, thoughts, and opinions expressed here are the author’s alone and do not necessarily reflect or represent the views and opinions of Cointelegraph.