Disclaimer: Information found on CryptoreNews is those of writers quoted. It does not represent the opinions of CryptoreNews on whether to sell, buy or hold any investments. You are advised to conduct your own research before making any investment decisions. Use provided information at your own risk.
CryptoreNews covers fintech, blockchain and Bitcoin bringing you the latest crypto news and analyses on the future of money.
Bitcoin (BTC) experienced new volatility on May 6 as low-liquidity weekend trading challenged the stability of its trading range.
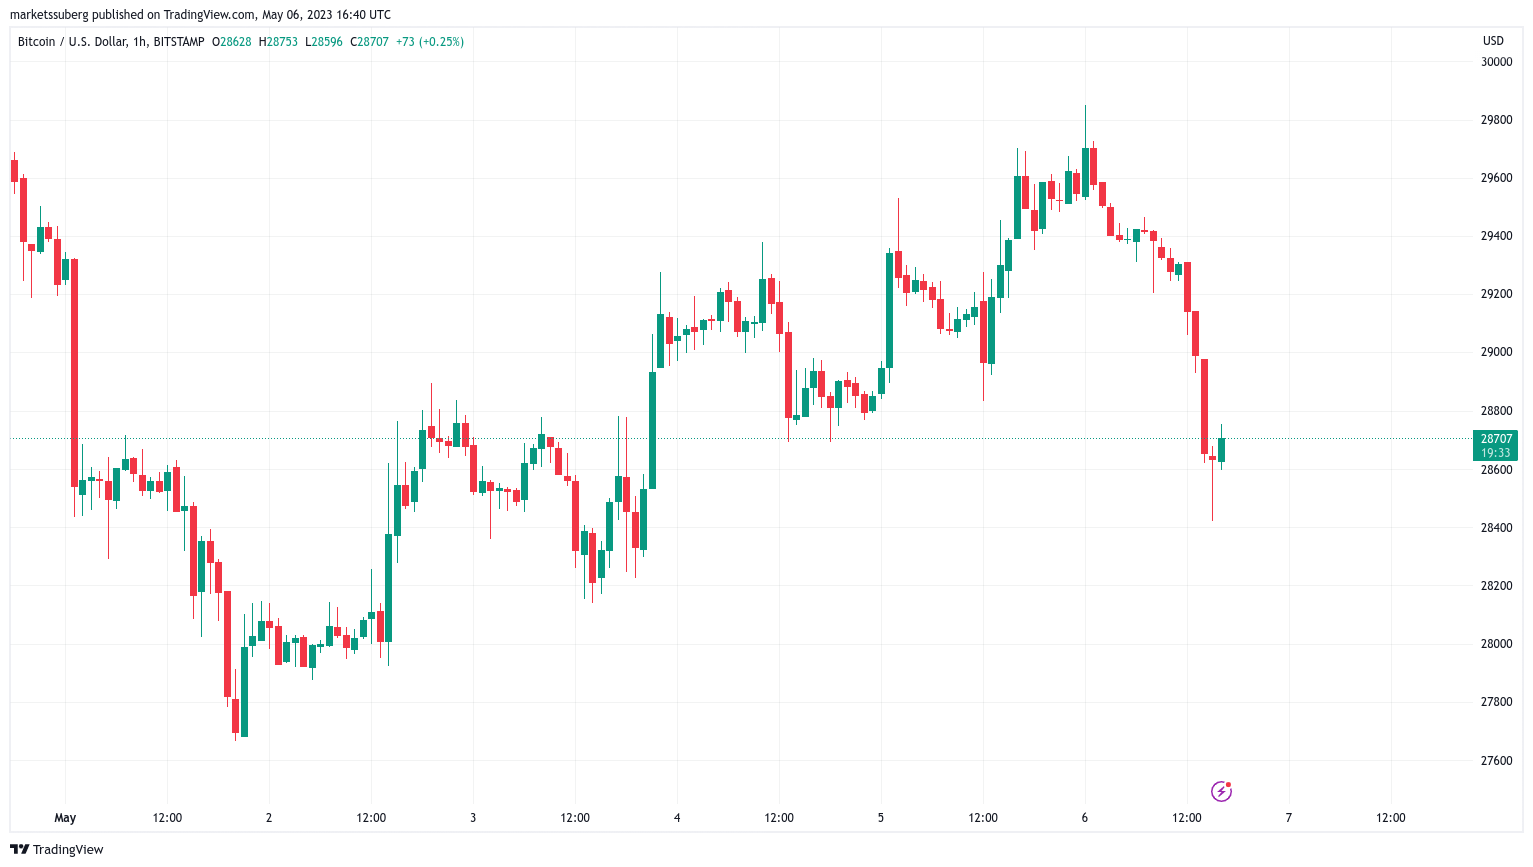 BTC/USD 1-hour candle chart (Bitstamp). Source: TradingView
Bitcoin “in limbo” despite volatility
Data from Cointelegraph Markets Pro and TradingView indicated that BTC/USD dropped more than $1,000, or 3%, within a few hours on that day.
The leading cryptocurrency encountered more active conditions typical of weekend trading while still unable to break free from a broader range that has persisted for several weeks.
With insufficient momentum to either surpass the $30,000 resistance or decline toward significant trend lines around $25,000, BTC/USD left market participants feeling frustrated.
“Bitcoin truly is in limbo at the moment and is uncertain about its next move… I have exited my position and am simply waiting for a breakout on one side of this range to re-enter,” popular trader Crypto Tony shared with his Twitter followers.
An accompanying chart illustrated potential targets in the case of a bearish breakdown.
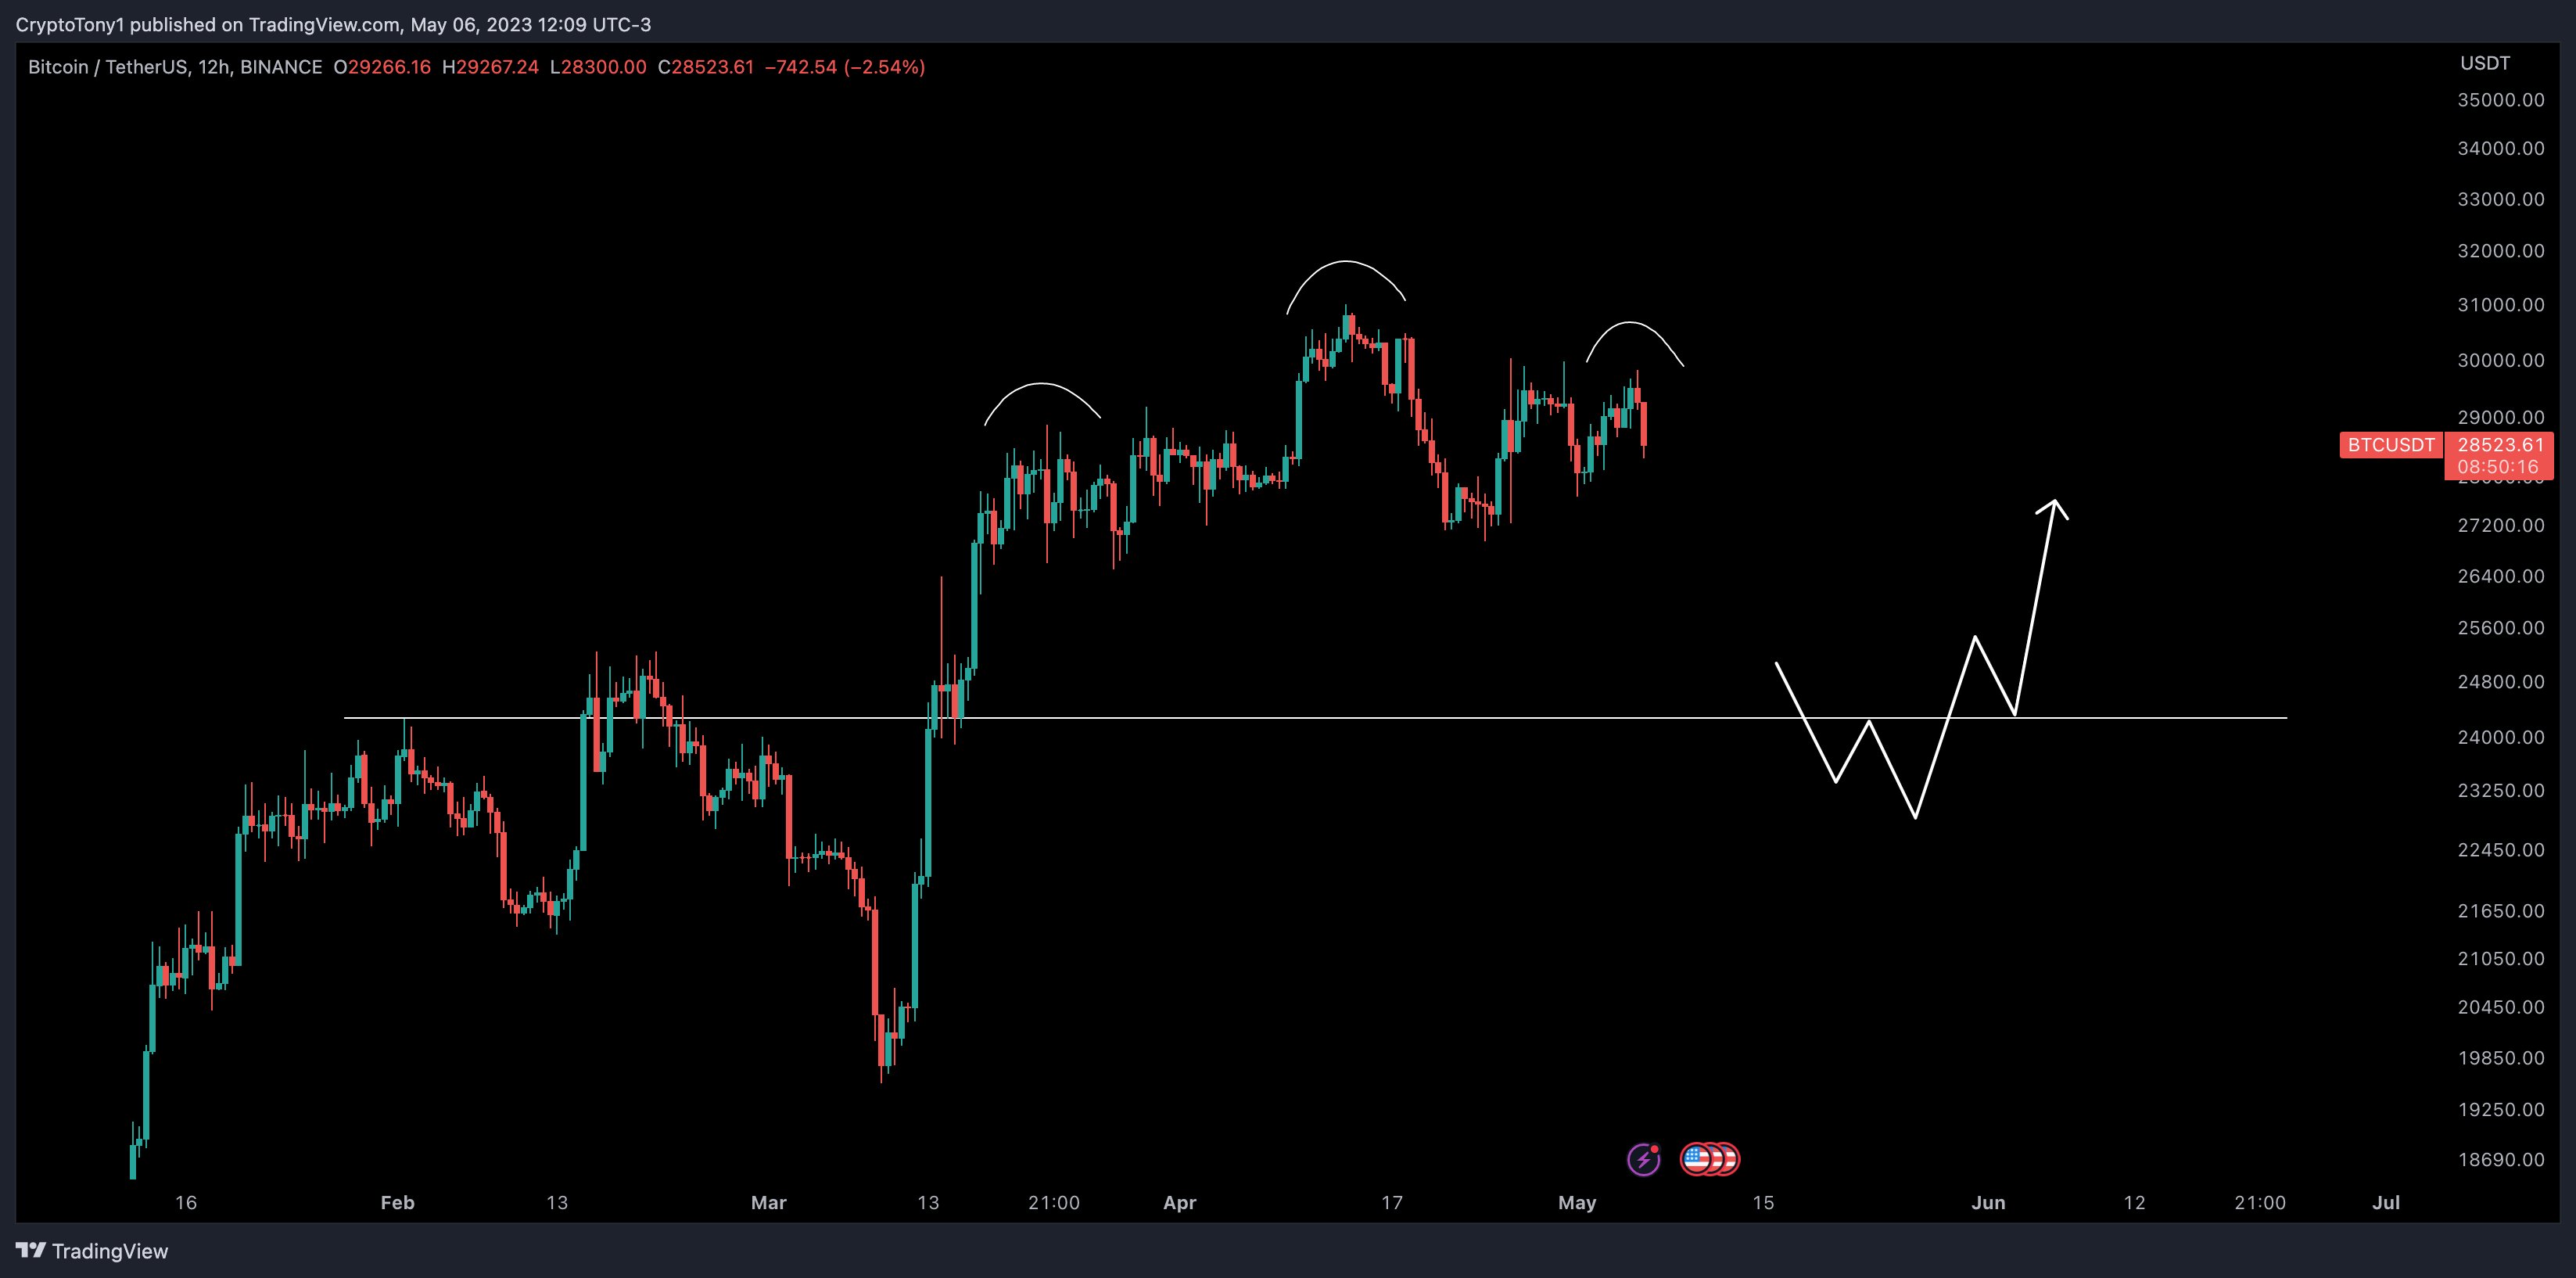 BTC/USD annotated chart. Source: Crypto Tony/Twitter
Further analysis released earlier in the day reiterated existing forecasts of $32,000 becoming relevant should bullish momentum resurface.
$BTC / $USD – Update
While the focus is primarily on #Memecoins, I am not surprised that we are witnessing a stagnant #Bitcoin
The excitement will resume sooner or later, as it always does, but for now, we are planning ahead. A move to the high $32,000 would be ideal pic.twitter.com/m9uI3RmDln— Crypto Tony (@CryptoTony__) May 6, 2023
In separate commentary, fellow trader CryptoBullet characterized the day’s losses as “nothing out of the ordinary.”
Related Posts
“Final dip before the breakout,” part of the commentary suggested, with a chart depicting BTC/USD in a narrowing wedge, indicating an impending decision on the exit trajectory.
#Bitcoin $BTC 4h update
Nothing unusual about the current drop, just (e) in the making
Final dip before the breakout https://t.co/pFw8HX8jNq pic.twitter.com/ko4Q0nlkwE— CryptoBullet (@CryptoBullet1) May 6, 2023
BTC price bulls must surpass $30,000
As always, longer timeframes contributed to more optimistic perspectives.
Related: Bitcoin trader eyes $63K BTC price for new Bollinger Bands ‘breakout’
Examining the weekly chart, analyst Gert van Lagen identified the 200-week simple moving average (SMA) as the next resistance level to overcome, with Bitcoin potentially forming a bullish inverse head and shoulders chart pattern.
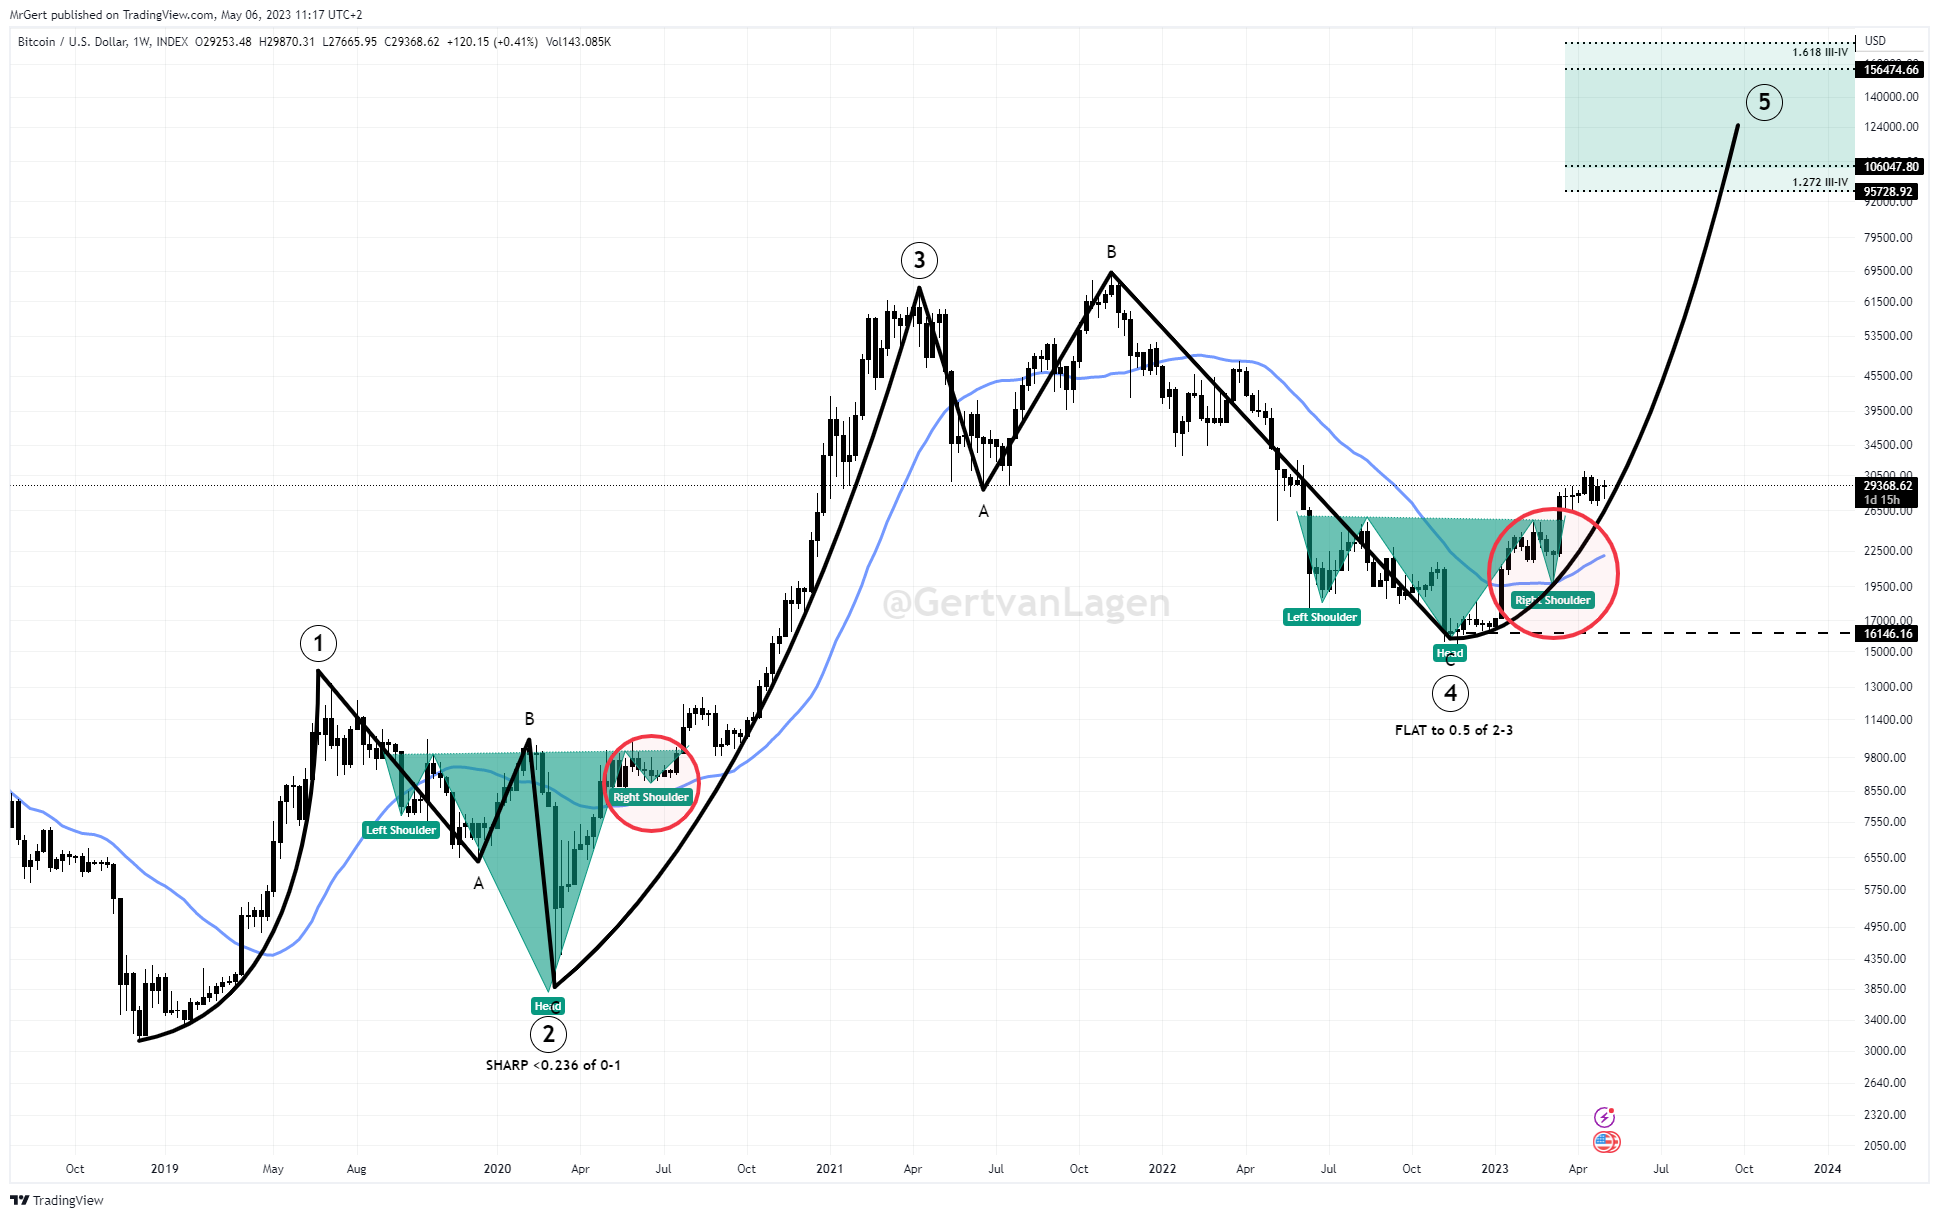 BTC/USD annotated chart. Source: Gert van Lagen/Twitter
Trader and investor CryptoAce highlighted a significant weekly resistance zone that bulls need to address.
“Remaining below this level means $24k is where the price will likely be trading in the coming weeks, in my opinion,” part of an update on trading activity stated on that day.
$BTC
Weekly resistance block $29.7k – $31.5k
Stay below and $24k is where price will be trading in some weeks imo
Last week took short from $29.7k & covered $28k
Now looking to short above $29.5k till $31.5k for $24k https://t.co/uewwZLtMzc pic.twitter.com/BVtGahtLr7— Cryptoce (@CryptoAceBTC) May 6, 2023
Magazine: Unstablecoins: Depegging, bank runs and other risks loom
This article does not provide investment advice or recommendations. Every investment and trading decision carries risk, and readers should perform their own research before making a decision.