Disclaimer: Information found on CryptoreNews is those of writers quoted. It does not represent the opinions of CryptoreNews on whether to sell, buy or hold any investments. You are advised to conduct your own research before making any investment decisions. Use provided information at your own risk.
CryptoreNews covers fintech, blockchain and Bitcoin bringing you the latest crypto news and analyses on the future of money.
Bitcoin’s (BTC) close consolidation near its recent peak indicates that traders are anticipating a trigger to initiate the next significant movement. The Consumer Price Index data set to be released on April 12 and the producer price index data on April 13 may provide clarity regarding the Federal Reserve’s forthcoming rate adjustments and potentially rouse traders from their inactivity.
The lackluster price movement in Bitcoin has not diminished interest in the asset. As per Ahrefs search volume data, Bitcoin continues to be the most searched term on Google in the United States, followed by “Donald Trump” and “breaking news.”
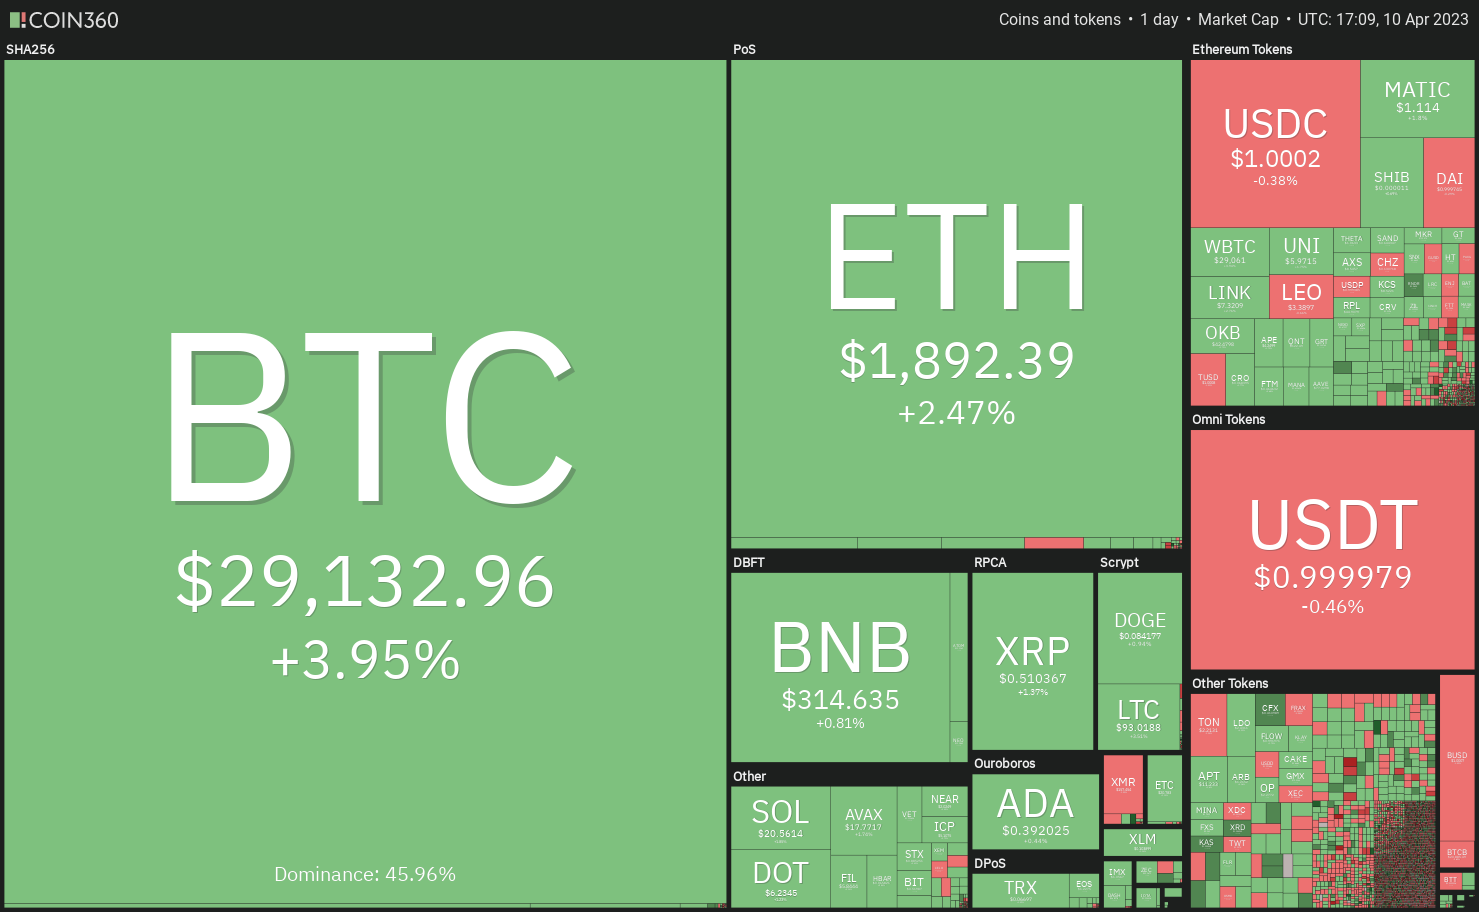 Daily cryptocurrency market performance. Source: Coin360
Another notable aspect is that Bitcoin’s circulating supply is steadily decreasing. Referencing Glassnode data, investor Anthony Pompliano highlighted that 53% of Bitcoin’s circulating supply has remained inactive over the past two years.
If demand rises, a supply shortage could occur, potentially driving prices higher. What are the key resistance levels to monitor for Bitcoin and altcoins in the short term?
Let’s analyze the charts to uncover the details.
S&P 500 index price analysis
The S&P 500 index (SPX) rebounded after a two-day decline on April 6, suggesting that sentiment remains optimistic and traders are purchasing during minor dips.
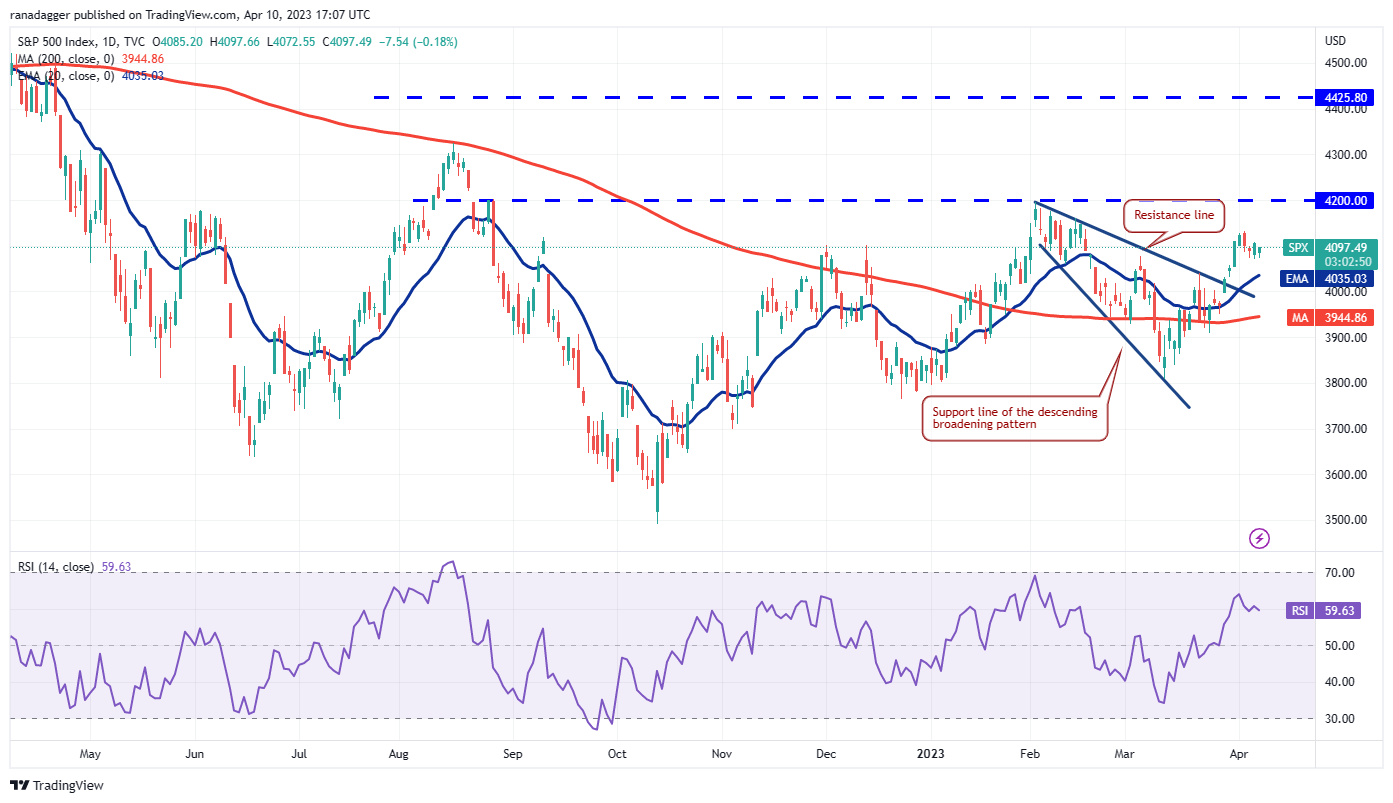 SPX daily chart. Source: TradingView
The rising 20-day exponential moving average (EMA) (4,035) and the relative strength index (RSI) positioned in the positive zone enhance the probability of a rally towards 4,200. Although this level has previously acted as a significant resistance, it is likely to be surpassed on the third attempt. If achieved, the index may confront the 4,300 resistance, which could see aggressive selling from bears.
The primary support to observe on the downside is the 20-day EMA. If this support fails, the index might retest the crucial support at the 200-day simple moving average (SMA) ($3,944).
U.S. Dollar Index price analysis
The U.S. Dollar Index continues to trade beneath the 20-day EMA (102.73), indicating that the short-term trend remains bearish. Sellers are expected to defend the 20-day EMA during the ongoing relief rally.
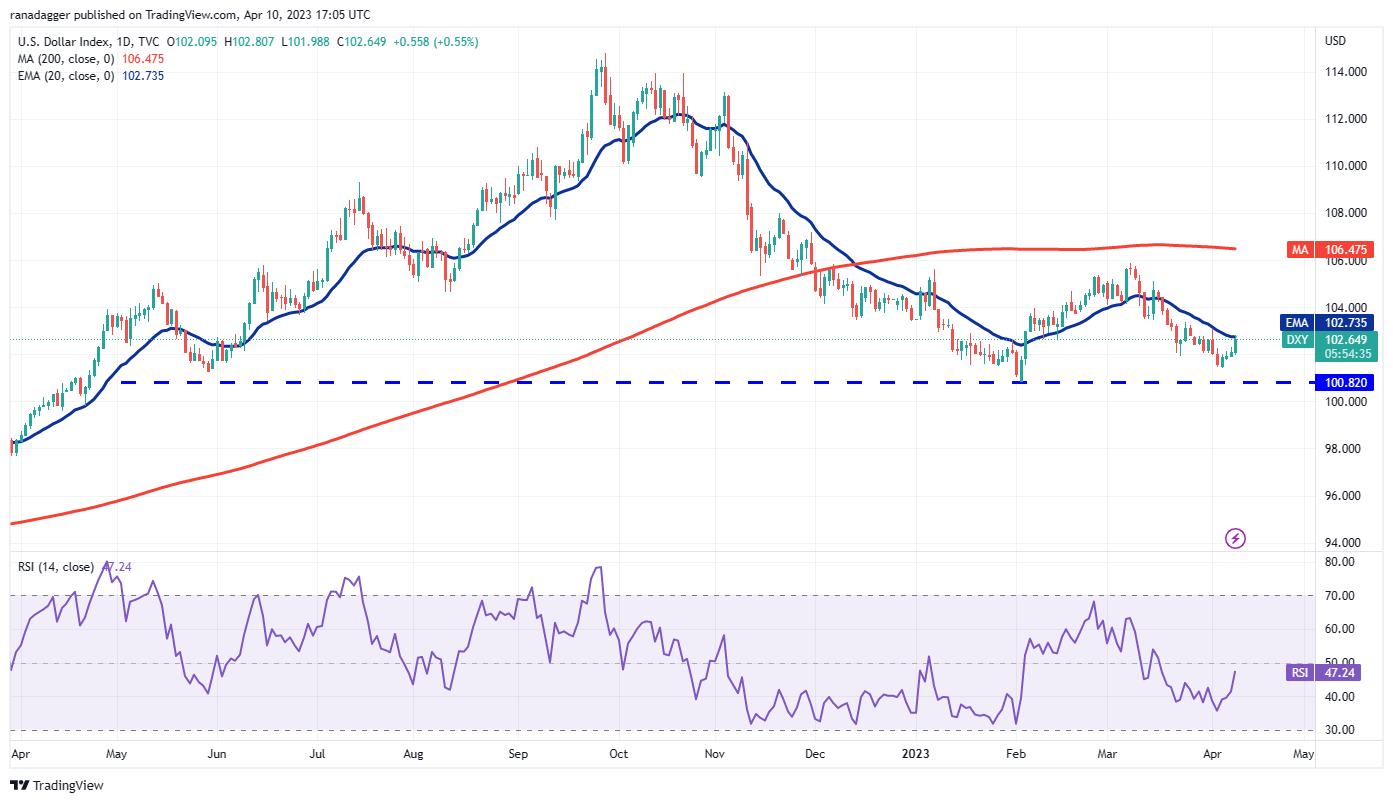 DXY daily chart. Source: TradingView
If the price declines from the 20-day EMA, the index may fall to the critical support of 100.82. Bulls are anticipated to protect this level vigorously, as a breach below it would complete a head-and-shoulders (H&S) pattern, potentially initiating the next phase of the downtrend.
Alternatively, if the price rebounds from the 100.82 support and rises above the 20-day EMA, it would indicate that the index may fluctuate between 100.82 and the 200-day SMA (106.47) for a while longer.
Bitcoin price analysis
Bitcoin rebounded from the 20-day EMA ($27,692) on April 9, indicating buying interest at lower levels. The gradually rising 20-day EMA and the RSI in the positive zone suggest a favorable position for buyers.
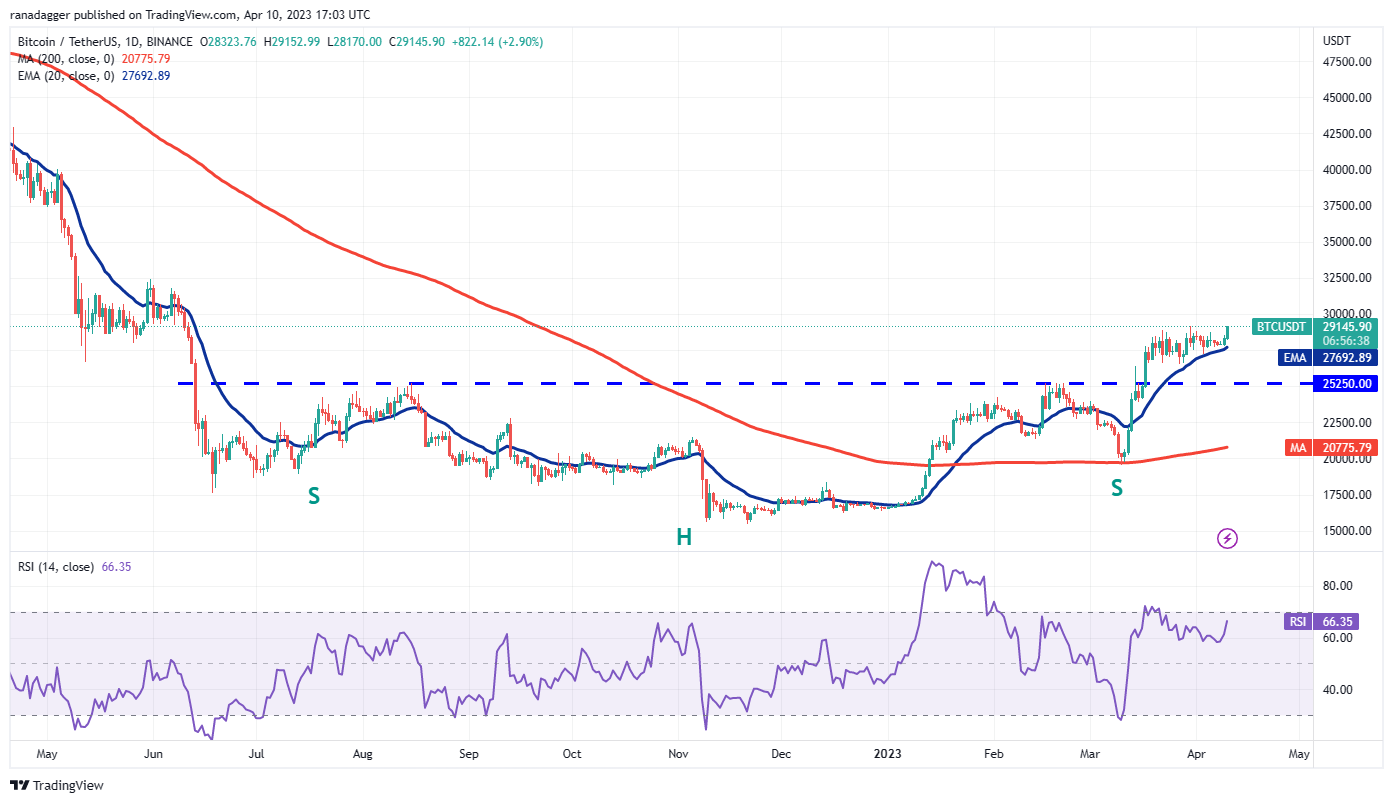 BTC/USDT daily chart. Source: TradingView
The $29,200 level is crucial to monitor on the upside. If bulls break through this resistance, the BTC/USDT pair may advance to $30,000. Bears will attempt to halt the rally at this point, but the likelihood of a breakout above it is considerable. The pair may then surge to $32,200.
<pConversely, if the price declines again from $29,200, it would indicate that bears are active at elevated levels. Sellers would then make another attempt to push the price below the 20-day EMA. If successful, the pair may drop to $25,250.
Ether price analysis
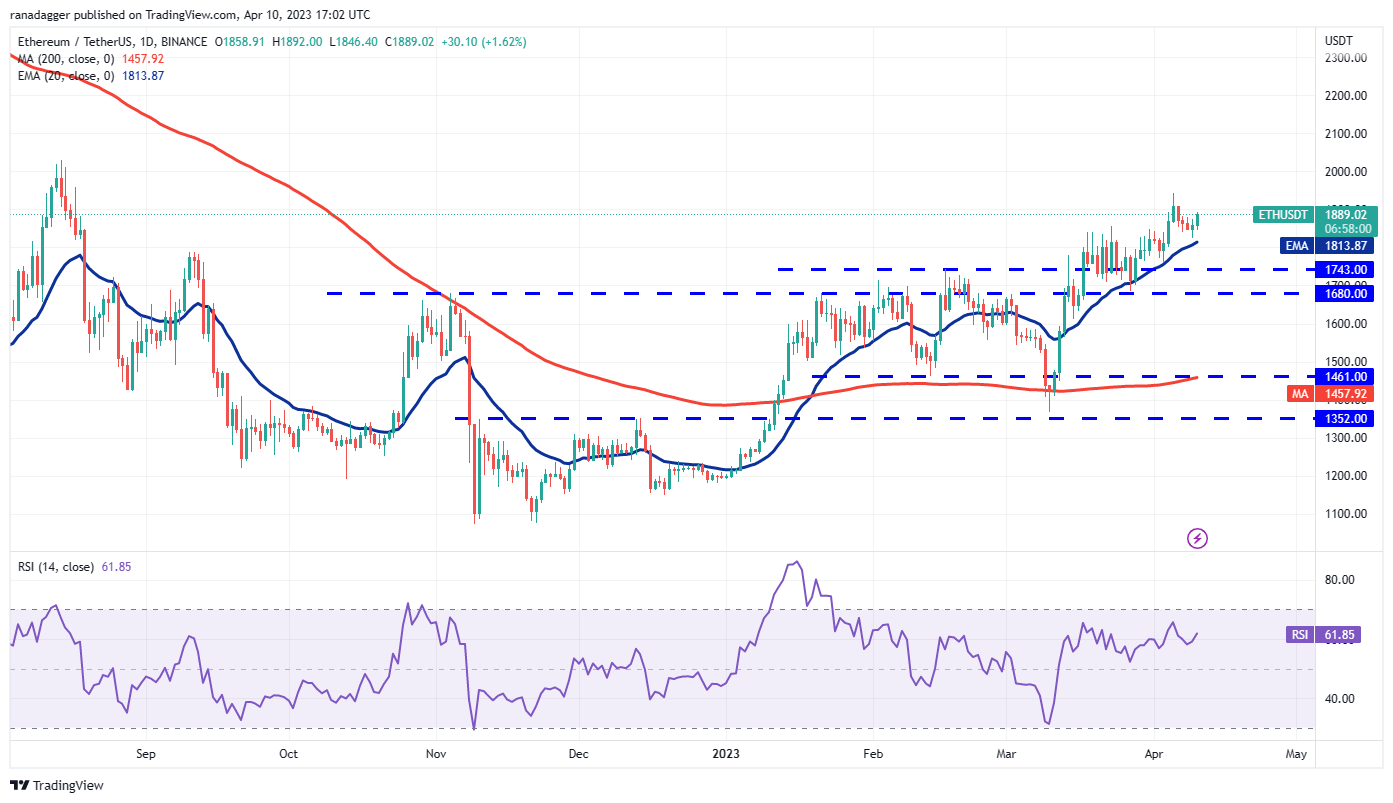
Buyers successfully defended the 20-day EMA ($1,813) on April 9, indicating that the trend remains positive for Ether (ETH).
 ETH/USDT daily chart. Source: TradingView
The bulls will aim to surpass the resistance at $1,943 and propel the price to $2,200. Sellers are likely to vigorously defend the range between $2,000 and $2,200. If the price declines from this range but does not fall below the 20-day EMA, it will indicate that the rally may continue.
This optimistic outlook will be invalidated in the near term if the price drops and falls below the 20-day EMA. The ETH/USDT pair could then descend to the robust support zone of $1,743 to $1,680.
BNB price analysis
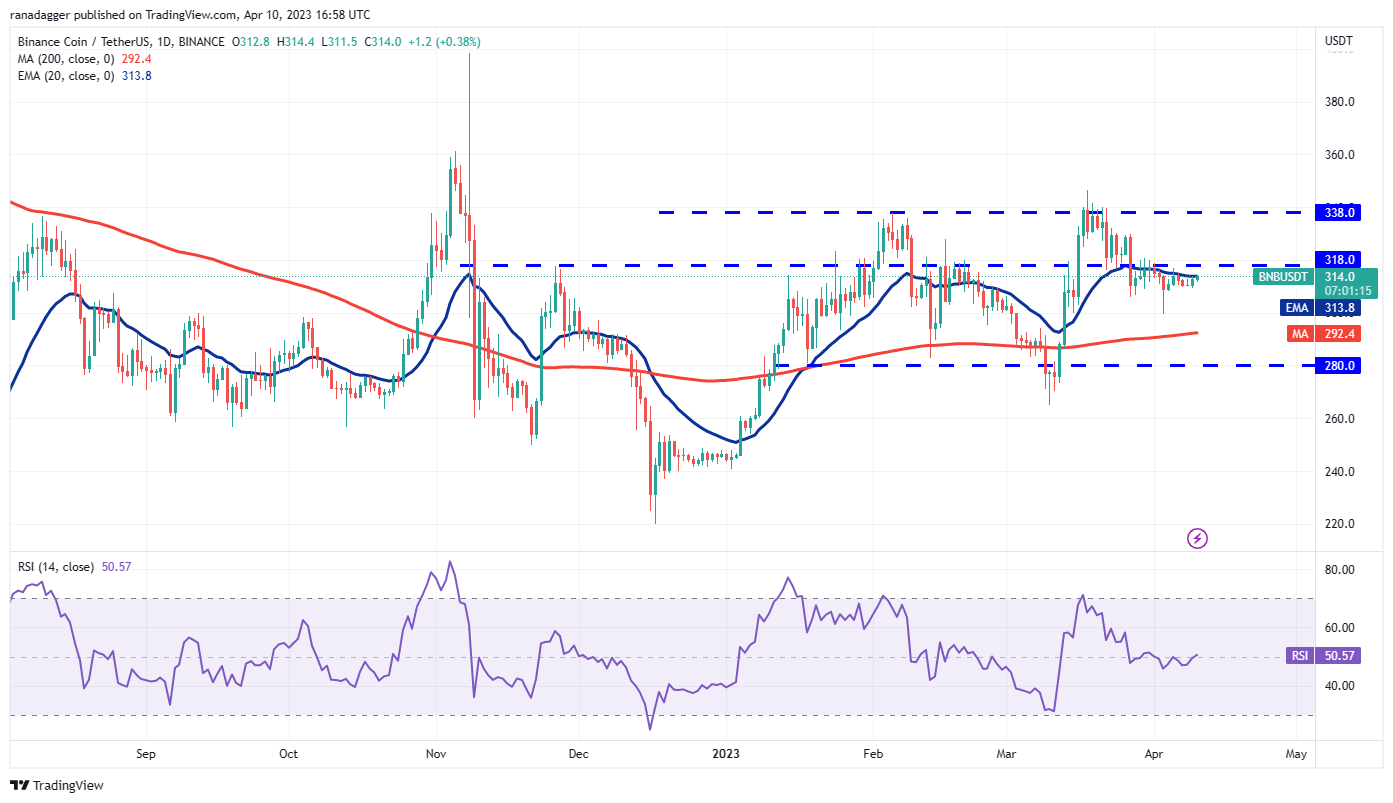
BNB (BNB) has been trading below the 20-day EMA ($313) for several days, yet the bulls have managed to prevent the price from dropping below the immediate support at $306. This indicates that selling pressure is diminishing at lower levels.
 BNB/USDT daily chart. Source: TradingView
Related Posts
The bulls will capitalize on this situation and attempt to push the price above the overhead resistance of $318. If successful, the BNB/USDT pair could gain momentum and rise to $338 and subsequently to $346.
On the other hand, if the price declines from the current level, it would suggest that bears are selling during every minor relief rally. If the $306 level fails, the pair may slide to the 200-day SMA ($292).
XRP price analysis
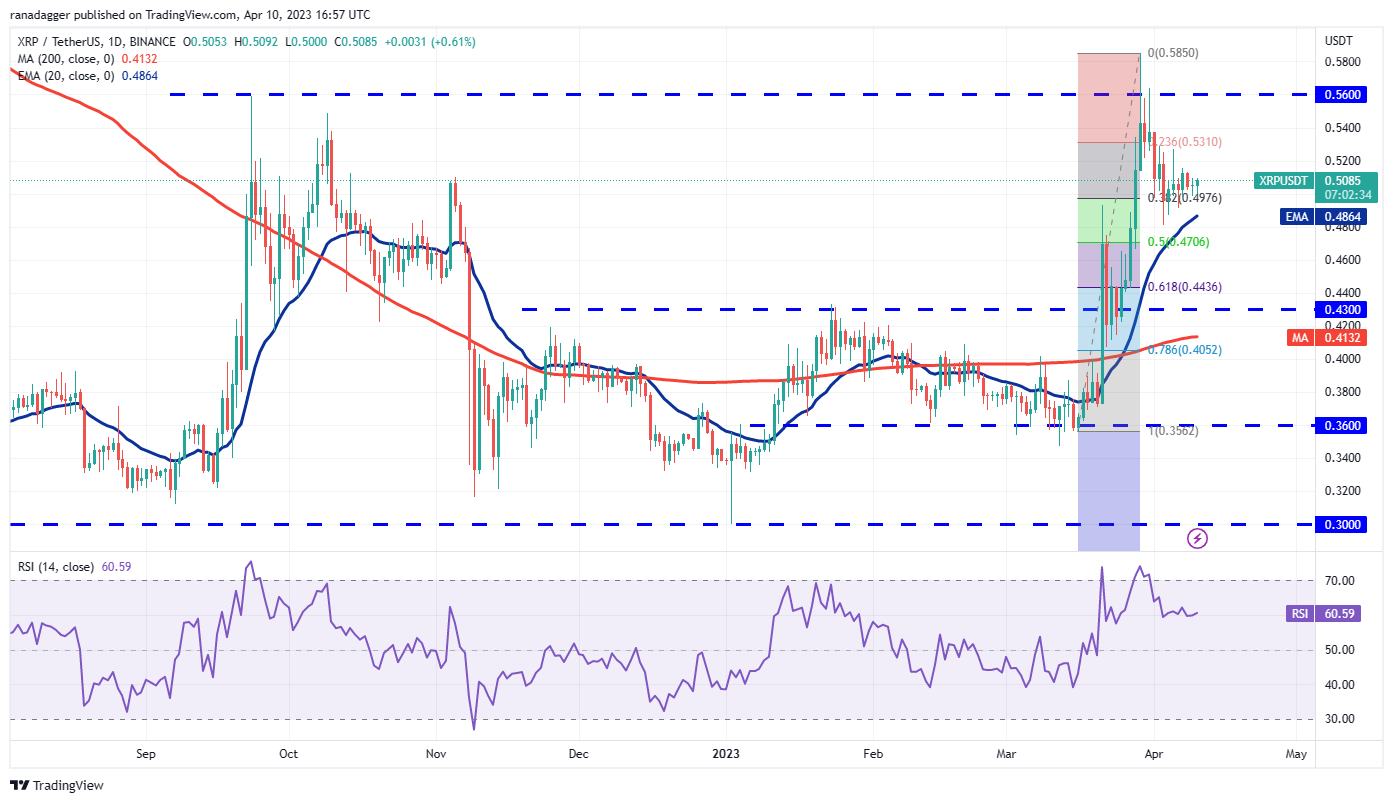
XRP (XRP) has been trading above the 38.2% Fibonacci retracement level of $0.49 for several days, indicating that buyers are not waiting for a deeper correction to make purchases.
 XRP/USDT daily chart. Source: TradingView
The bulls will aim to strengthen their position by pushing the price to the overhead zone between $0.56 and $0.58. This remains a critical zone to monitor, as a breakout above it could pave the way for a potential rally to $0.65 and subsequently to $0.80.
Conversely, if the price declines and breaks below the 20-day EMA ($0.48), it would suggest that short-term traders may be taking profits. This could pull the XRP/USDT pair down to the significant support at $0.43.
Cardano price analysis
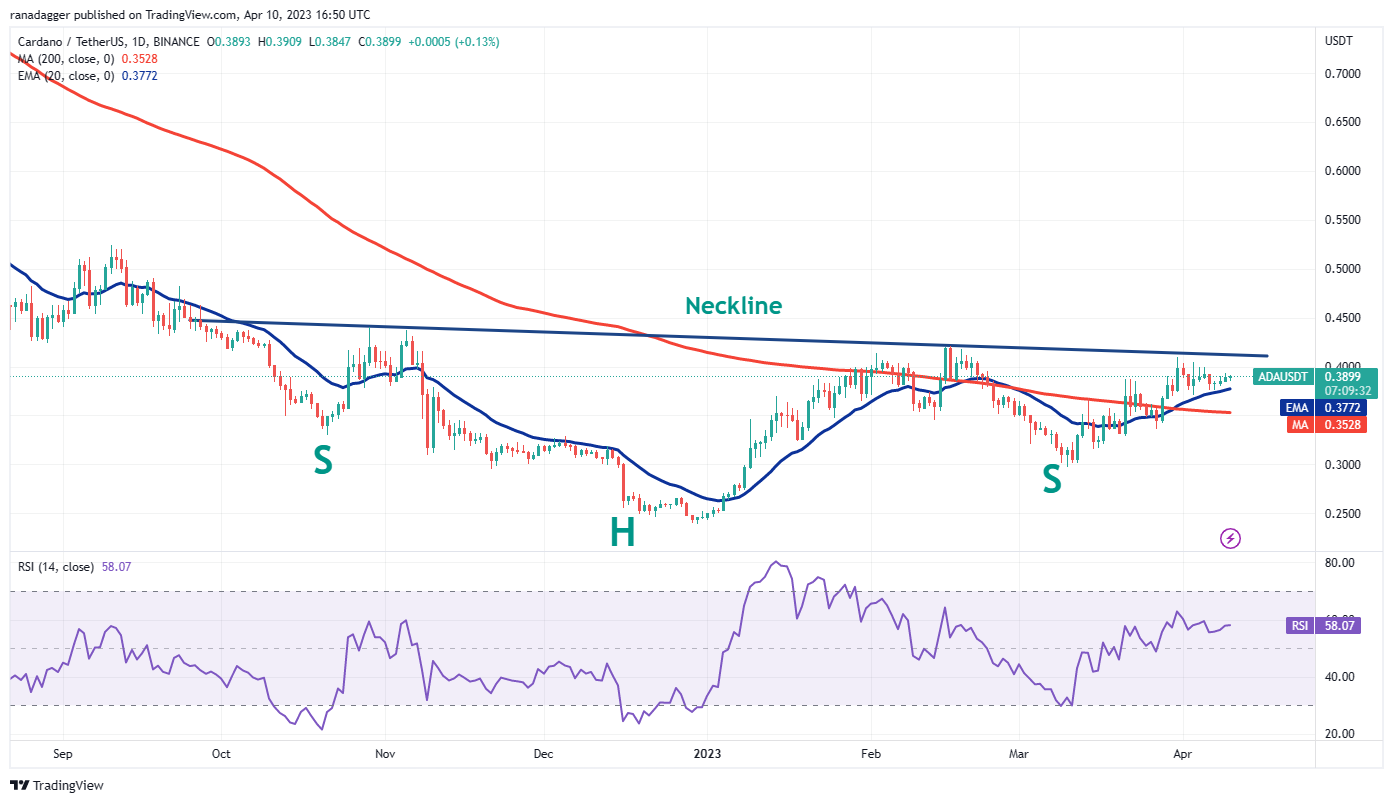
Cardano’s ADA (ADA) has been trading above the 20-day EMA ($0.37) for the past few days, but the bulls are facing challenges in clearing the neckline of the inverse H&S pattern. This indicates that bears are defending the level vigorously.
 ADA/USDT daily chart. Source: TradingView
Typically, a tight consolidation precedes a sharp breakout. The rising 20-day EMA and the RSI in the positive territory suggest that an upside breakout may occur. A close above the neckline will complete the reversal setup and signal the beginning of a new uptrend toward the target objective of $0.60.
This bullish perspective will be negated if the price declines and breaks below the 20-day EMA. The ADA/USDT pair may then fall to the 200-day SMA ($0.35). This level is likely to attract significant buying from bulls.
Related: ‘Pop or drop?’ Bitcoin analysts decide if BTC price will beat $30K
Polygon price analysis
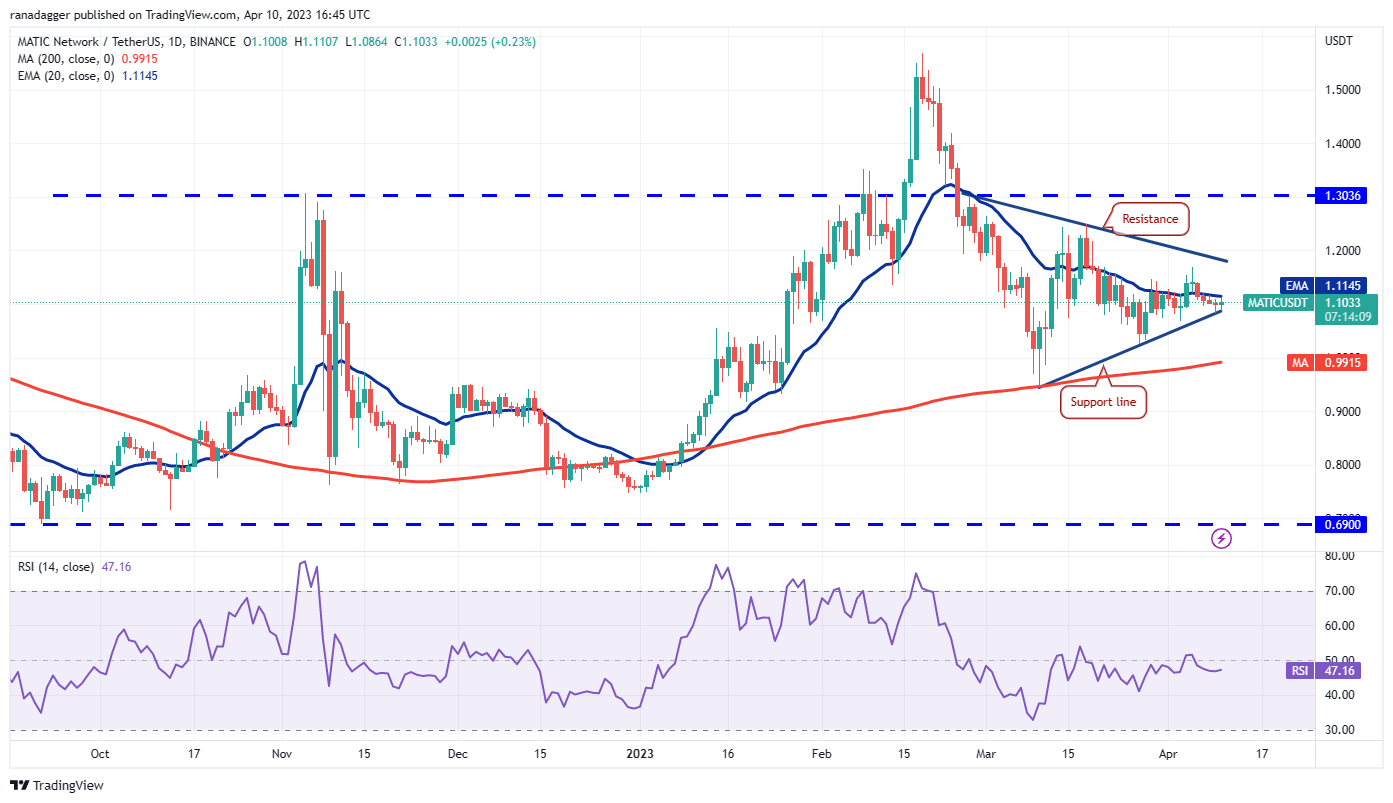
Sellers attempted to push Polygon’s MATIC (MATIC) below the support line on April 9 and 10, but the bulls maintained their position. This indicates buying interest at lower levels.
 MATIC/USDT daily chart. Source: TradingView
The bulls will strive to push the price above the 20-day EMA ($1.11). If they succeed, the MATIC/USDT pair could surge to the resistance line of the symmetrical triangle. A breakout and close above the triangle will indicate that the bulls have gained the upper hand over the bears, potentially leading to a rally to $1.30.
Conversely, if the price declines from the 20-day EMA and falls below the support line, it will suggest that bears are in control. The pair may then retest the crucial support at the 200-day SMA ($0.99).
Dogecoin price analysis
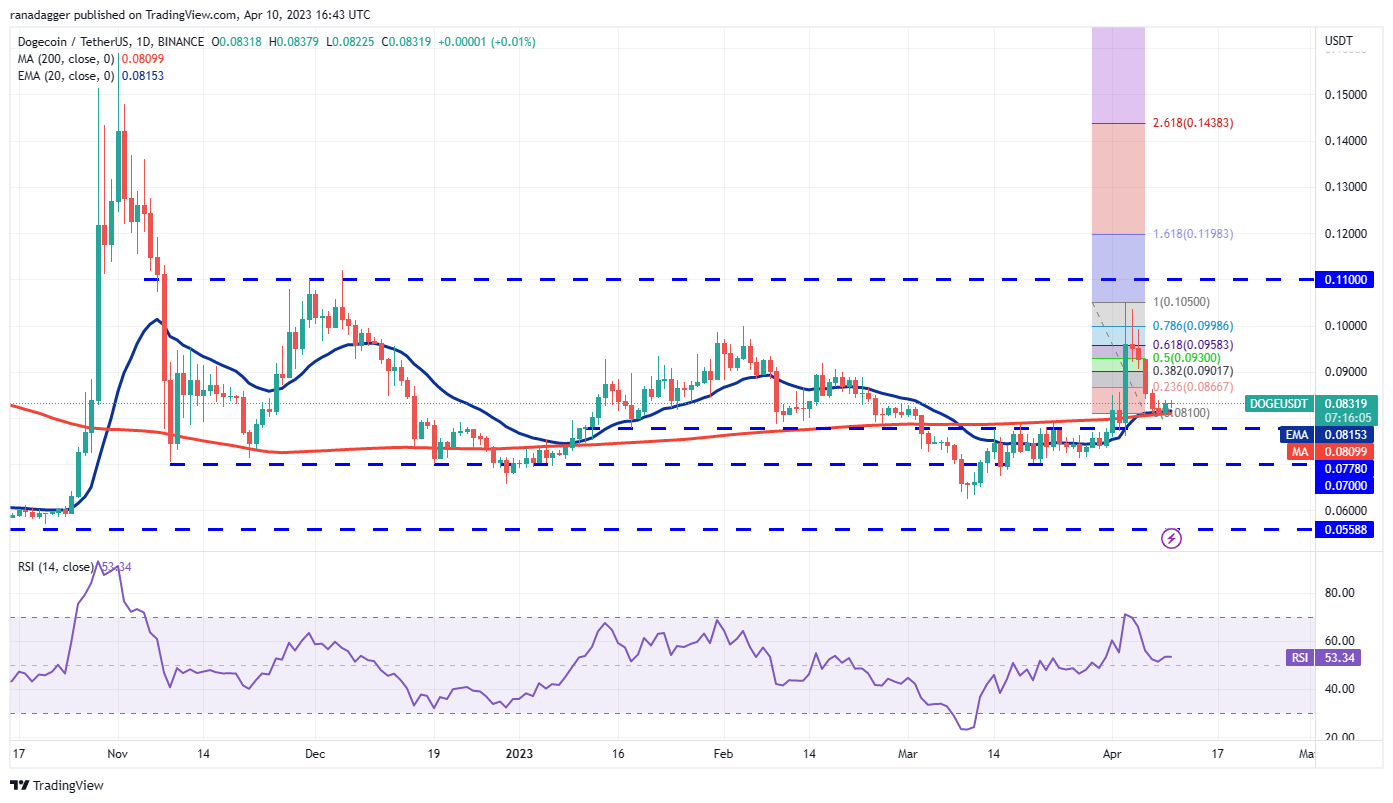
Dogecoin (DOGE) successfully maintained the moving averages on April 8, but the weak bounce on April 9 indicates that demand is waning at higher levels.
 DOGE/USDT daily chart. Source: TradingView
Both moving averages have flattened, and the RSI is just above the midpoint, suggesting a balance between supply and demand. A bounce from the current level could encounter selling pressure at the 38.2% Fibonacci retracement level of $0.09. If the price declines from this level, the DOGE/USDT pair may fluctuate between $0.09 and the moving averages for a period.
A drop below the moving averages could plunge the pair to the strong support of $0.07, while a rise above $0.09 would increase the chances of a rally to $0.11.
Solana price analysis
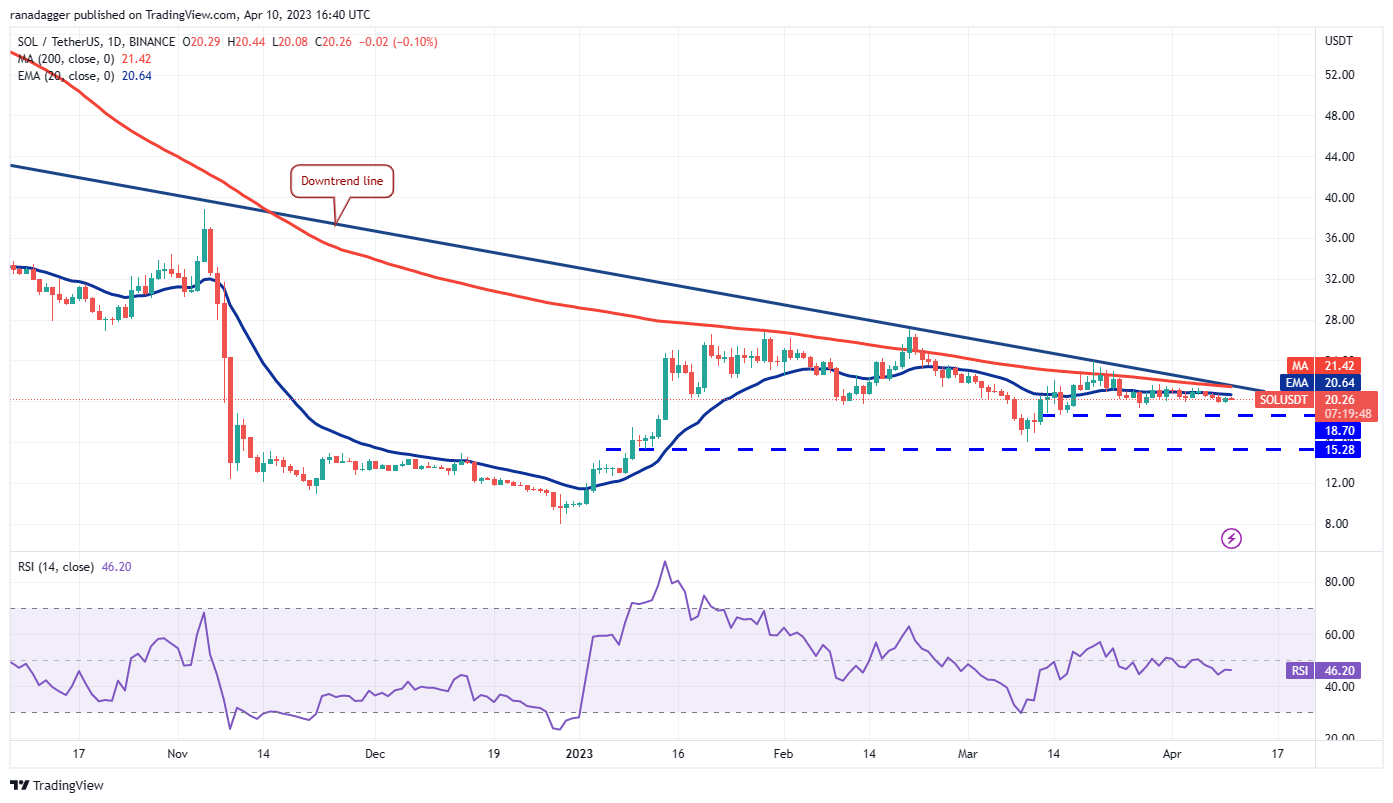
The trading range for Solana’s SOL (SOL) has further narrowed, indicating uncertainty among both bulls and bears.
 SOL/USDT daily chart. Source: TradingView
The flat 20-day EMA ($20.64) and the RSI just below the midpoint do not provide a clear advantage to either bulls or bears. Therefore, it is advisable to wait for a breakout before making significant investments.
If the price rises and breaks through the downtrend line, it may attract strong buying from bulls. The SOL/USDT pair could then initiate a rally to $27 and subsequently to $39. Conversely, selling pressure could intensify if the price falls below $18.70, potentially leading to a drop to $15.28.
The views, thoughts, and opinions expressed here are solely those of the authors and do not necessarily reflect or represent the views and opinions of Cointelegraph.
This article does not provide investment advice or recommendations. Every investment and trading decision carries risk, and readers should perform their own research before making any decisions.