Disclaimer: Information found on CryptoreNews is those of writers quoted. It does not represent the opinions of CryptoreNews on whether to sell, buy or hold any investments. You are advised to conduct your own research before making any investment decisions. Use provided information at your own risk.
CryptoreNews covers fintech, blockchain and Bitcoin bringing you the latest crypto news and analyses on the future of money.
Bitcoin (BTC) surpassed $30,000 on Oct. 20, suggesting that the most favorable direction is upward. Grayscale Investments submitting a new application to the United States Securities and Exchange Commission for a spot Bitcoin ETF may have served as a bullish catalyst.
In another encouraging development for the cryptocurrency sector, the SEC moved to dismiss all allegations against Ripple CEO Brad Garlinghouse and executive chair Chris Larsen. This may heighten expectations that the regulator could ease its scrutiny of cryptocurrency entities following a series of recent challenges.
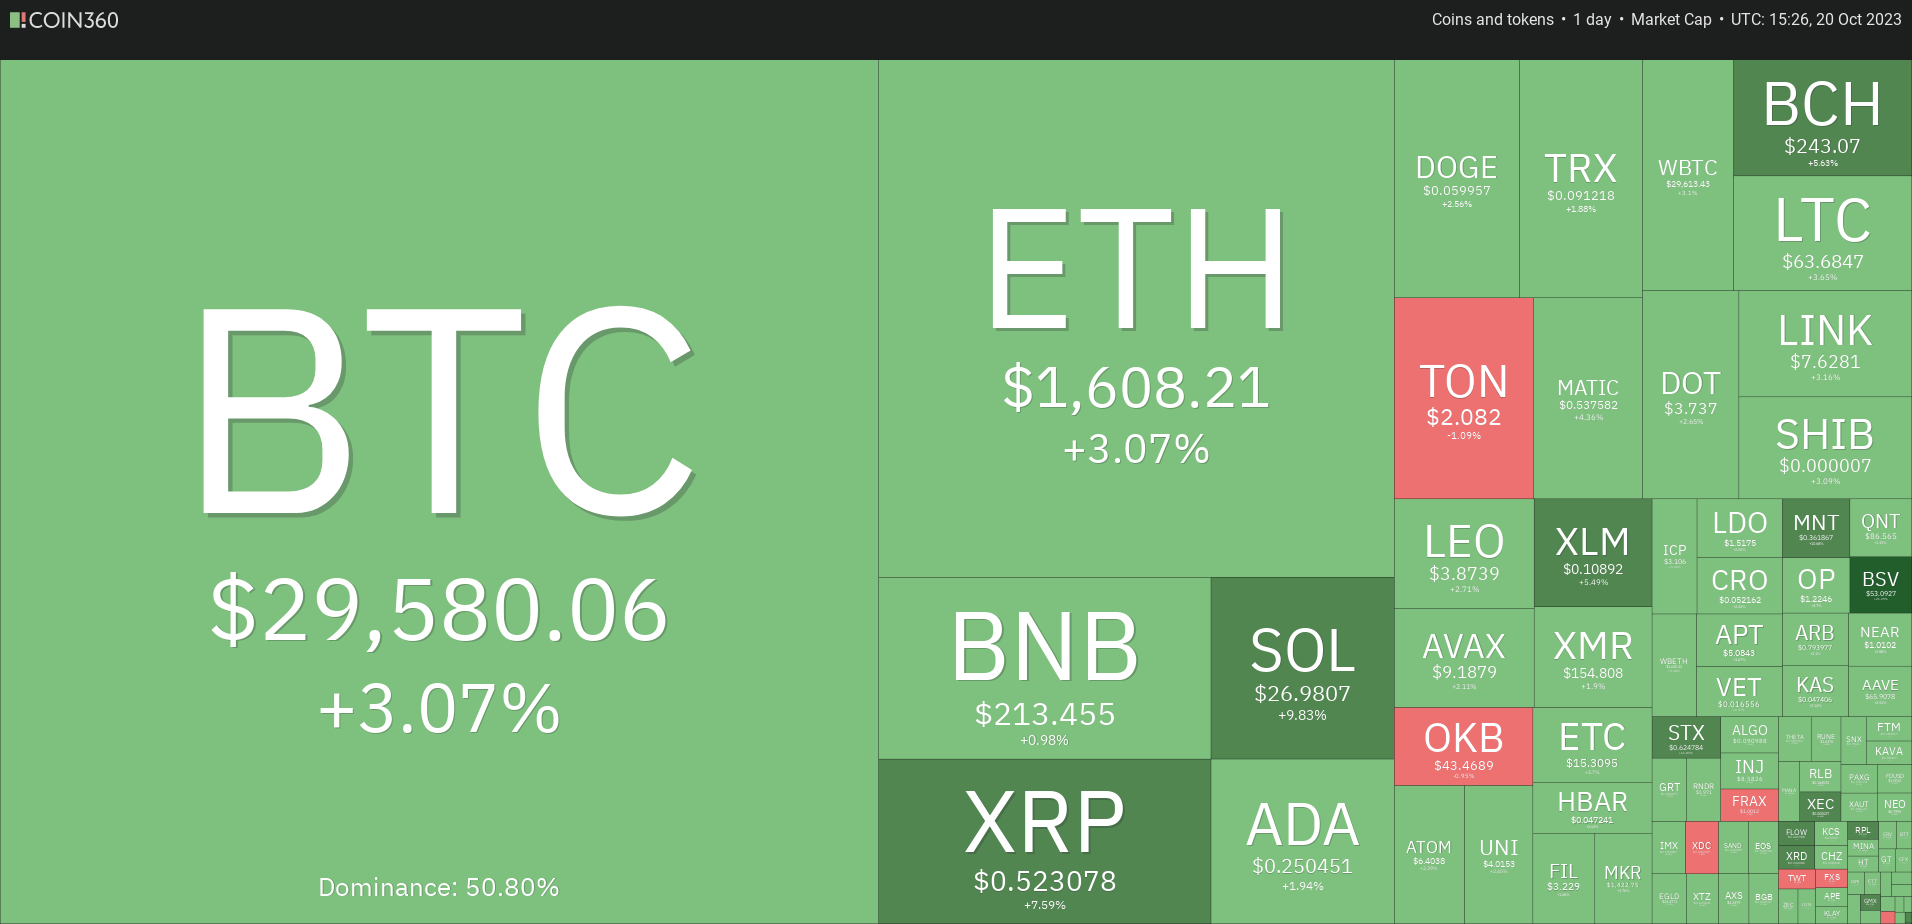 Daily cryptocurrency market performance. Source: Coin360
As market sentiment improves, Bitcoin’s long-term holders (LTHs) have been increasing their Bitcoin reserves. Data from Glassnode indicates that 76.2% of the circulating Bitcoin is stored in long-term holdings. This trend is likely to lead to a supply shortage in the market, which is favorable for Bitcoin’s price.
Can Bitcoin sustain its upward momentum and continue to rise? Will altcoins follow suit? Let’s examine the charts of the top 10 cryptocurrencies to find out.
Bitcoin price analysis
Bitcoin broke through and closed above the $28,143 resistance on Oct. 16, and the bulls successfully maintained this level during the retest on Oct. 17 and 18. This suggests that buyers have converted this level into support.
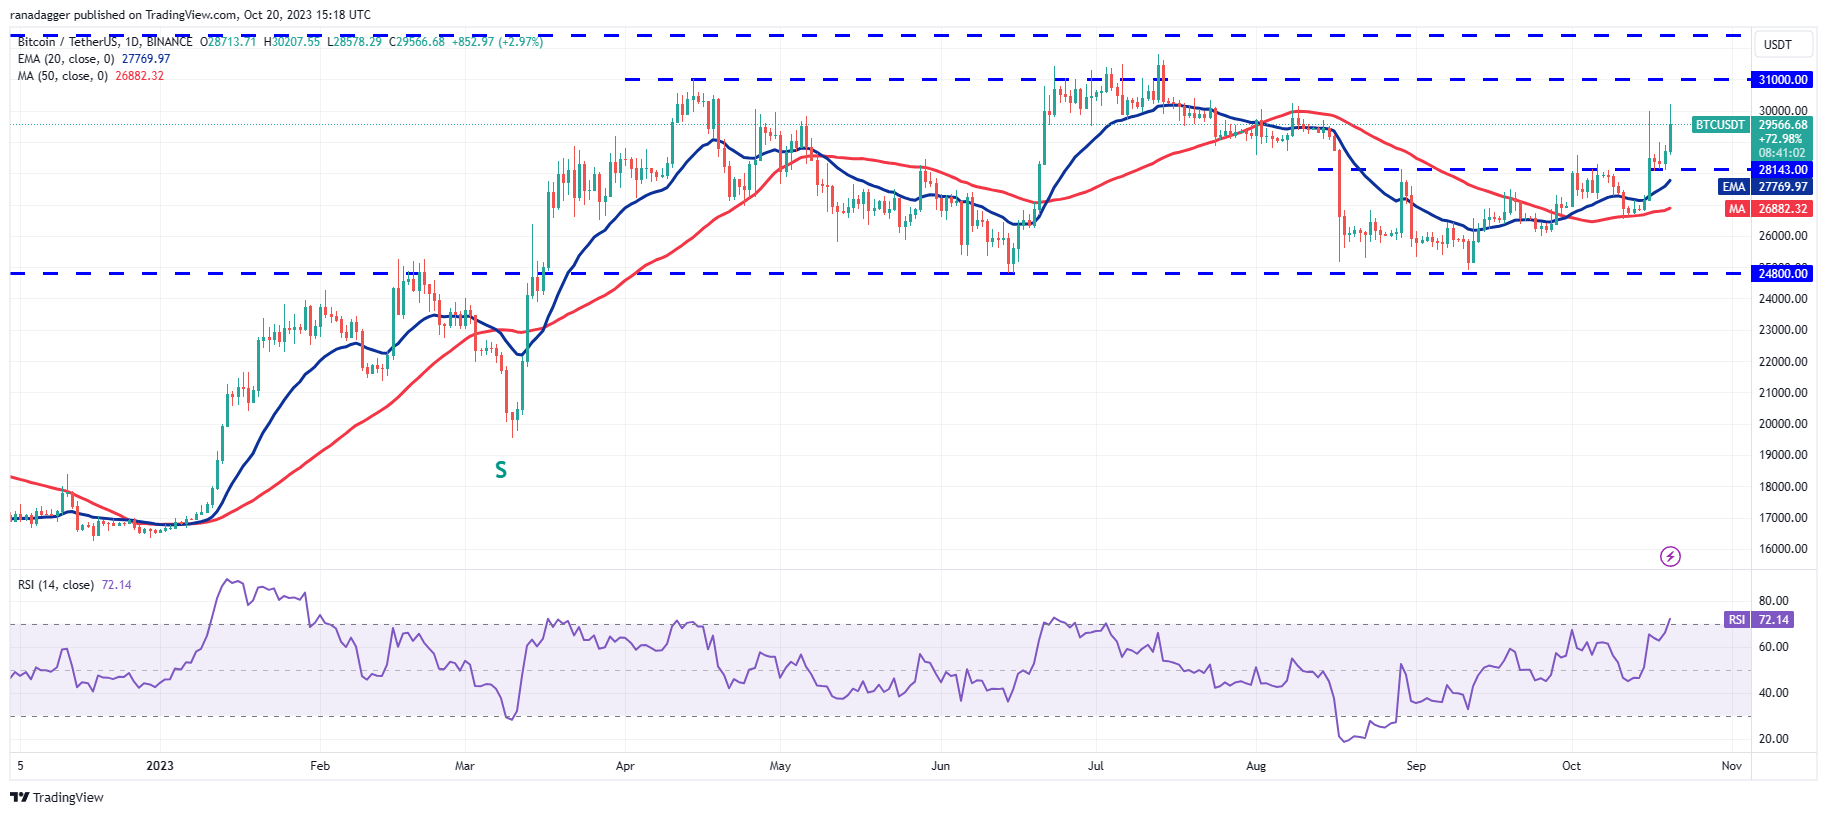 BTC/USDT daily chart. Source: TradingView
The 20-day exponential moving average ($27,769) has begun to rise, and the relative strength index (RSI) is in the overbought territory, indicating that bulls are in control. Buyers will aim to keep the price above $30,000 and confront the strong resistance zone between $31,000 and $31,805. Sellers are anticipated to defend this area vigorously.
The bears are running out of time. To avert further gains, they must quickly pull the price back below $28,143. If they succeed, the BTC/USDT pair could drop to the 50-day simple moving average ($26,882).
Ether price analysis
Ether (ETH) once again rebounded from the robust support near $1,531, as evidenced by the long tail on the Oct. 19 candlestick. This indicates that bulls are strongly defending the $1,531 support level.
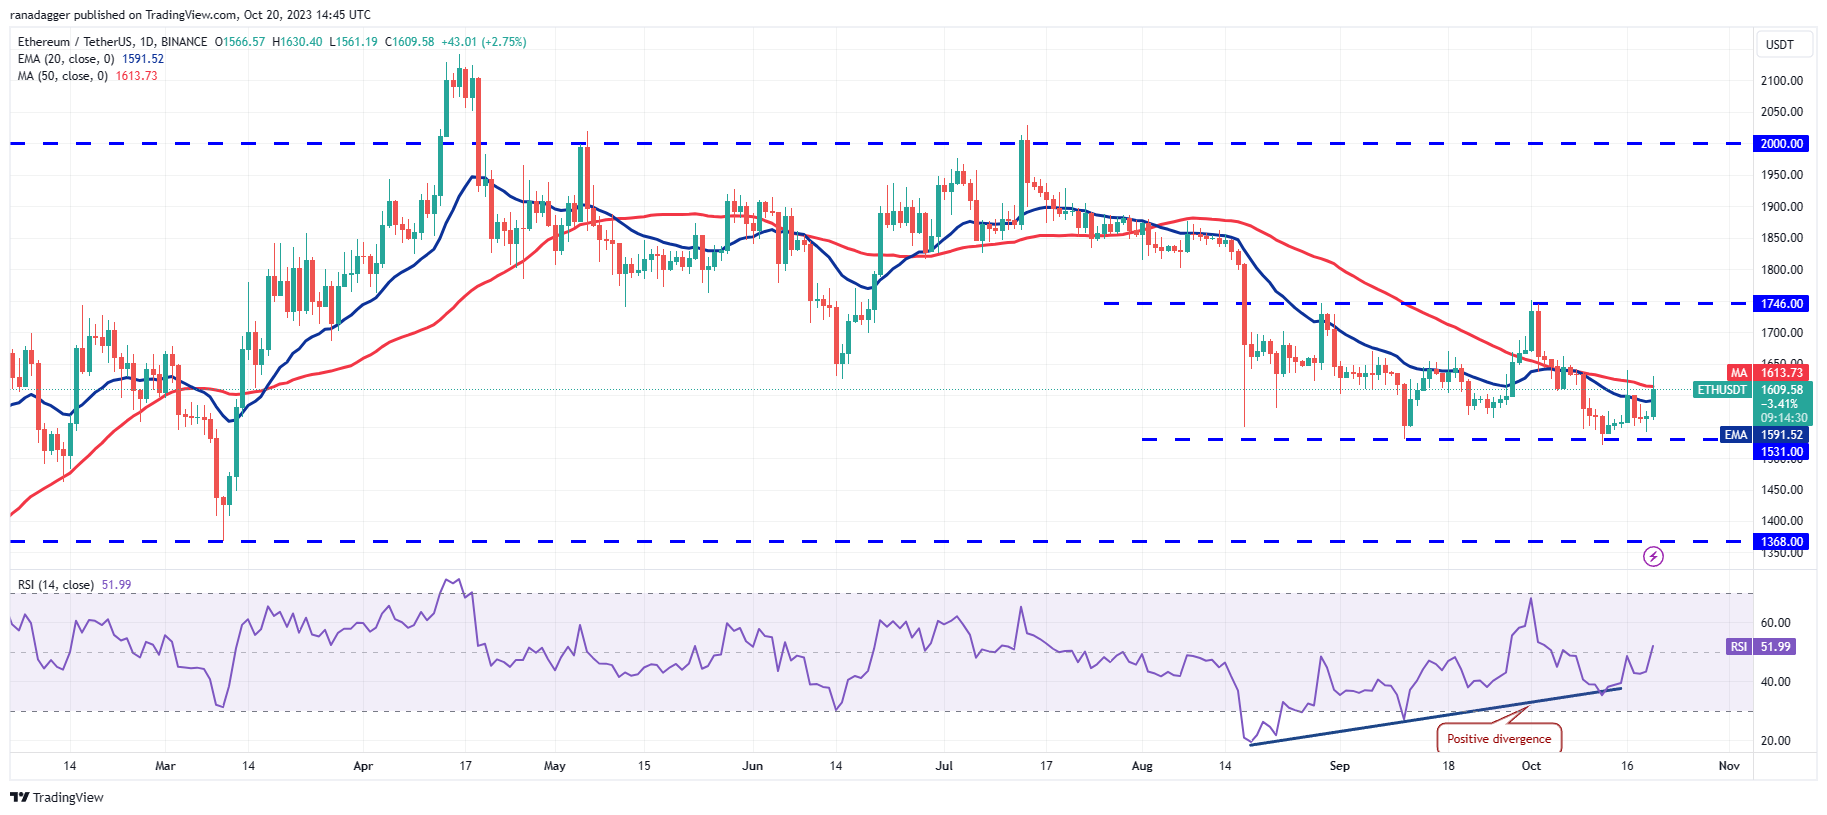 ETH/USDT daily chart. Source: TradingView
The repeated inability of the bears to breach the $1,531 level is likely to draw in buyers. The 50-day SMA ($1,613) may present a challenge, but if surpassed, the ETH/USDT pair could gain momentum and attempt a rally to $1,746.
While the declining moving averages suggest a bearish advantage, the positive divergence on the RSI indicates that negative momentum is waning. The bears will regain control if they manage to push the price below $1,531.
BNB price analysis
BNB (BNB) declined from the downtrend line on Oct. 16, but a positive sign is that bulls prevented the price from falling below the 20-day EMA ($210). This indicates a shift in sentiment from selling on rallies to buying on dips.
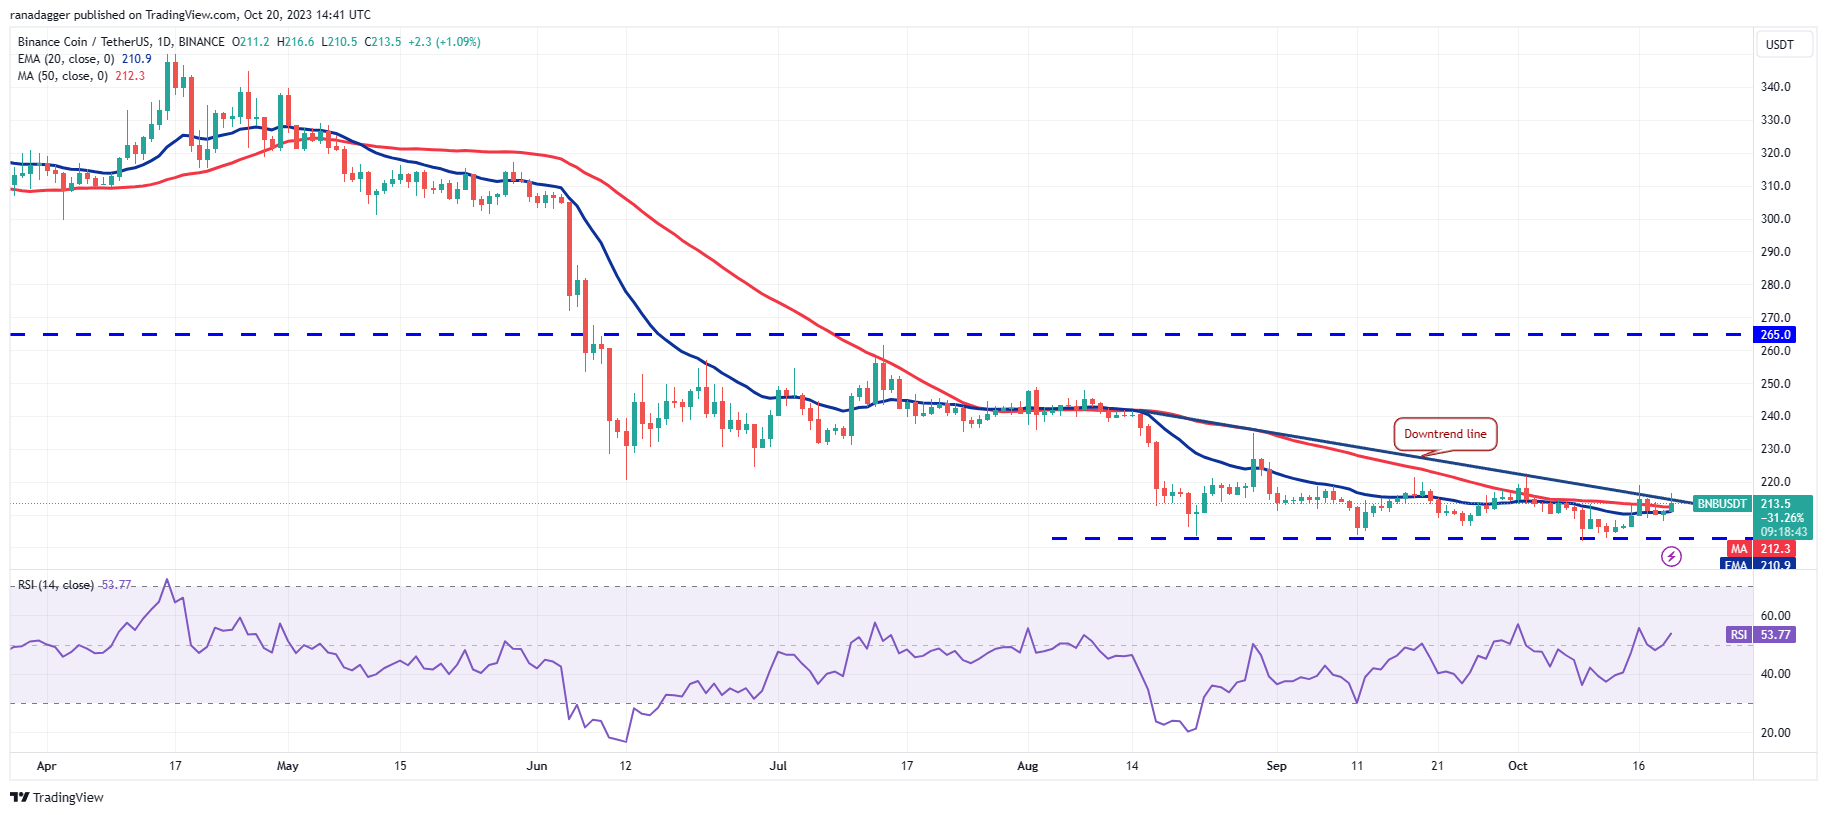 BNB/USDT daily chart. Source: TradingView
Buyers will once again attempt to push and maintain the price above the downtrend line. If successful, the BNB/USDT pair could accelerate to $235 and subsequently extend the rally to $250. The bears are likely to mount a strong defense at this level.
Key support to monitor on the downside is the 20-day EMA, followed by $203. A break and close below this level will open the possibility for a decline to the next significant support at $183.
XRP price analysis
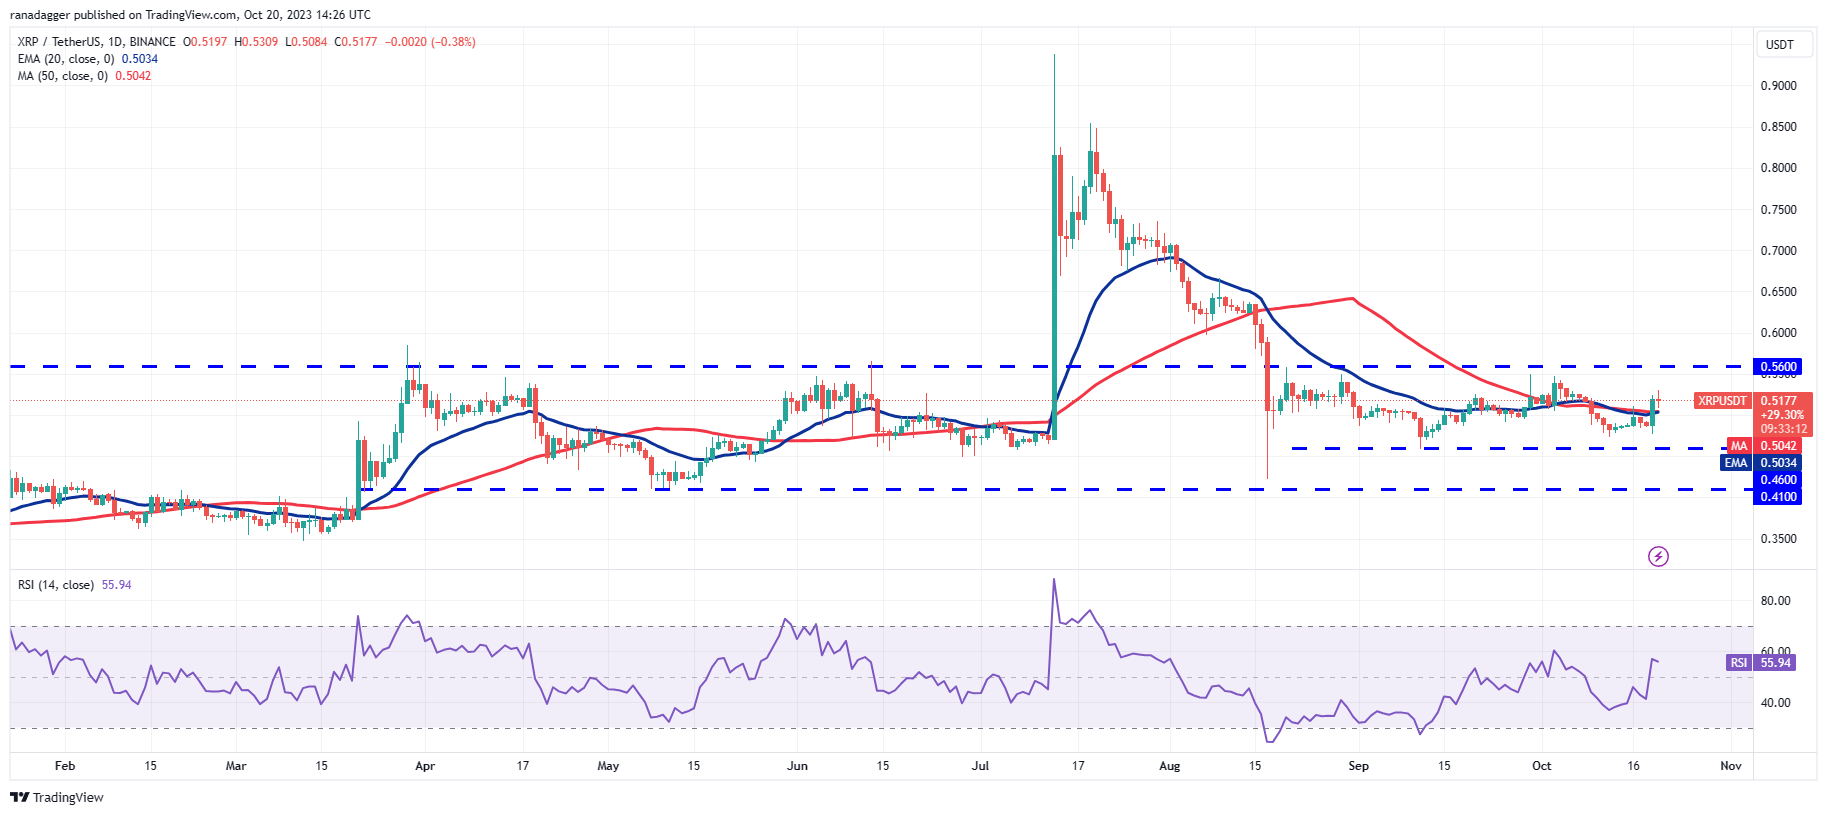
XRP (XRP) declined from the moving averages on Oct. 16, but the bears were unable to push the price below the immediate support at $0.46. This indicates a lack of selling pressure at lower levels.
 XRP/USDT daily chart. Source: TradingView
The moving averages have leveled off, and the RSI is just above the midpoint. This suggests that the XRP/USDT pair may fluctuate between $0.46 and $0.56 for a period. If the price remains above the moving averages, the pair may rally to the overhead resistance at $0.56.
Conversely, if the price drops below the moving averages, it will increase the likelihood of a decline to $0.46. The next significant move is likely to commence above $0.56 or below $0.41.
Solana price analysis
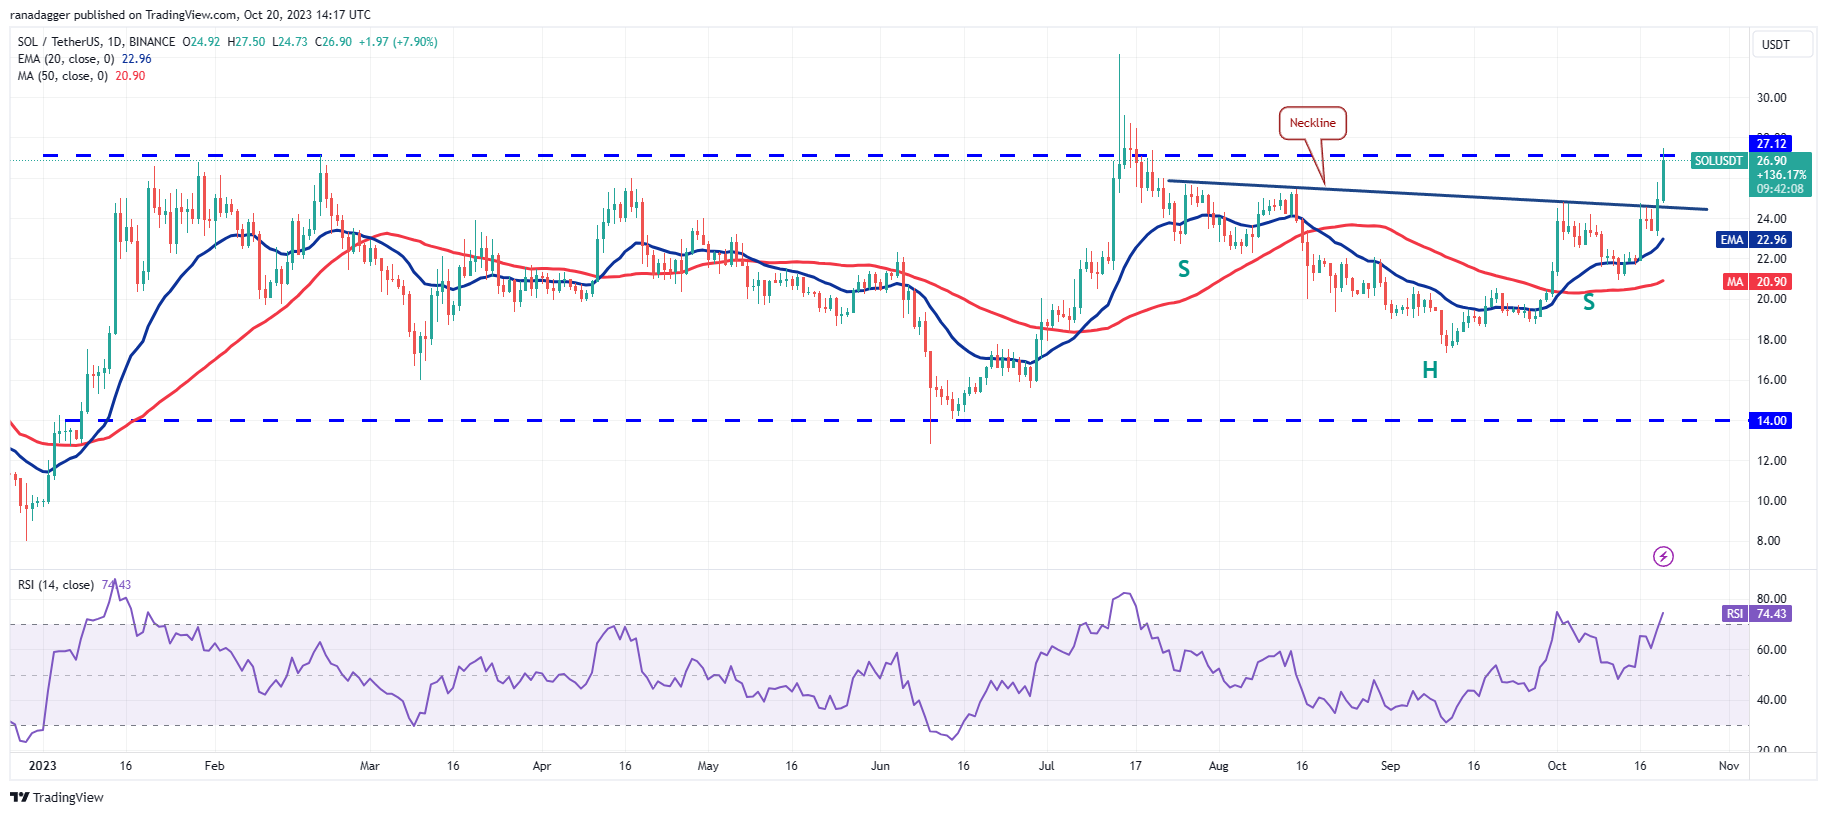
Solana (SOL) surged and closed above the neckline of the inverse head and shoulders pattern on Oct. 19, completing the bullish formation.
 SOL/USDT daily chart. Source: TradingView
Related Posts
The buying continued on Oct. 20, and the bulls are attempting to push the price above the immediate resistance at $27.12. If they succeed, the SOL/USDT pair could rise toward the pattern target of $32.81.
Typically, after breaking through a major resistance, the price may retrace to test the breakout level. In this instance, the price may return to test the neckline. If the price rebounds from this level, the pair may initiate a new upward movement. A break and close below $23 could shift the advantage back to the bears.
Cardano price analysis
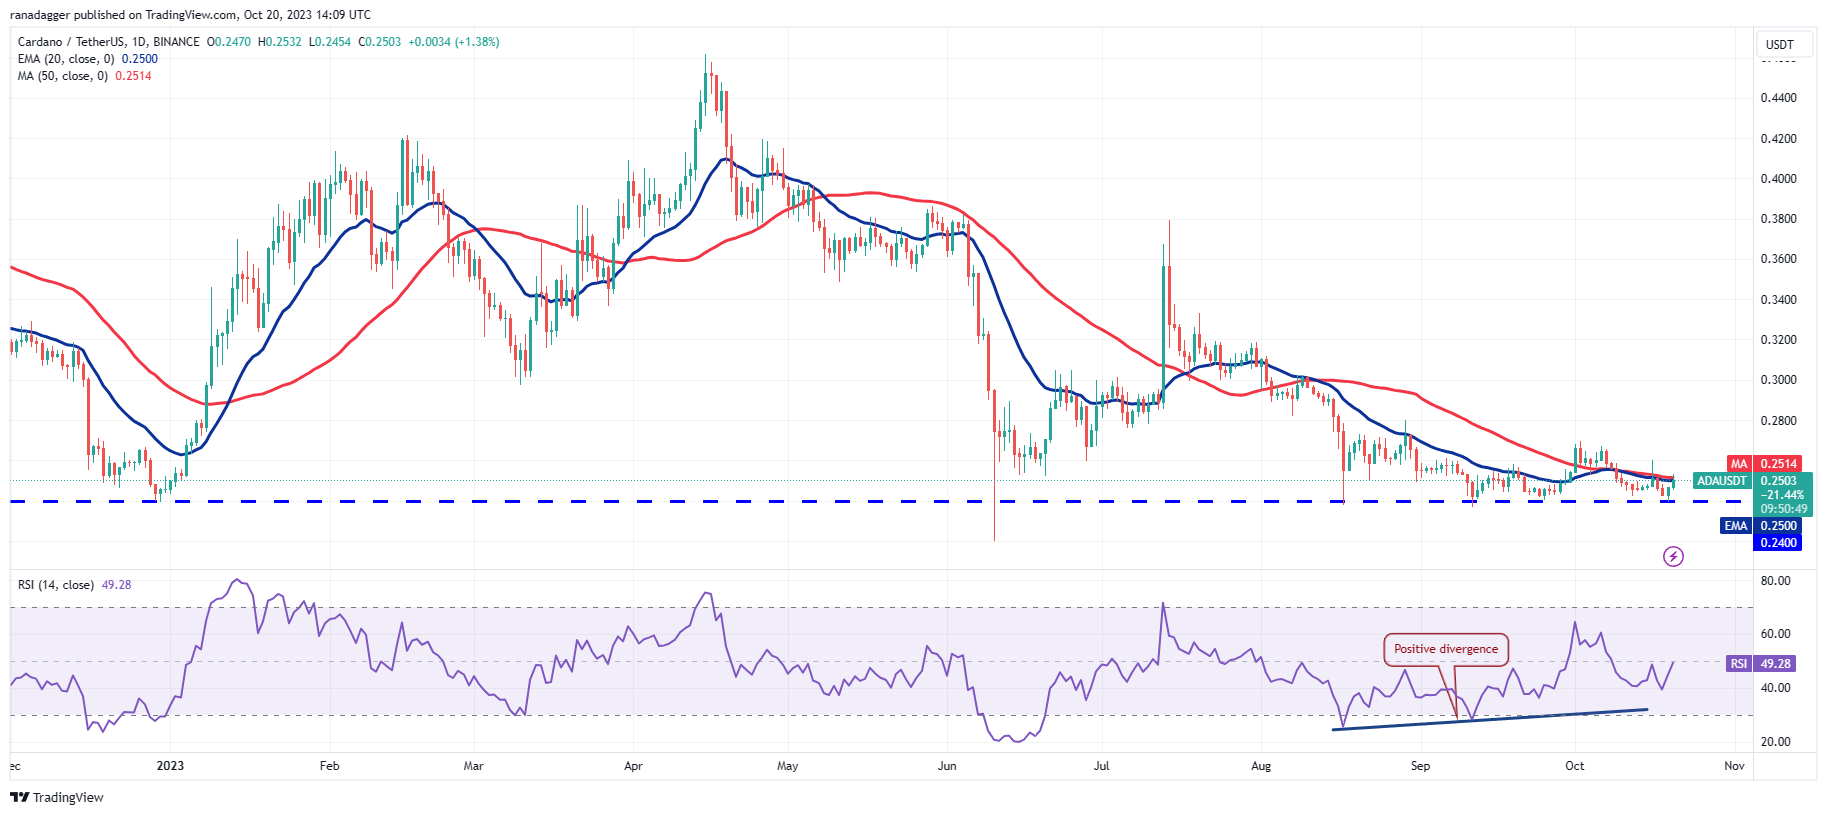
Cardano (ADA) once again fell to the strong support at $0.24 on Oct. 19, but the bulls successfully defended this level. The positive divergence on the RSI indicates that bearish momentum is diminishing.
 ADA/USDT daily chart. Source: TradingView
The price has reached the moving averages, which are likely to serve as a significant barrier. If bulls overcome this resistance, the ADA/USDT pair could first rise to $0.27 and then to $0.28. The bears are expected to defend this area vigorously.
If the price declines from $0.28, it will indicate that the pair may establish a range for several days. On the downside, the bears will need to pull the price below $0.24 to signal the resumption of the downtrend. The next support levels are at $0.22 and $0.20.
Dogecoin price analysis
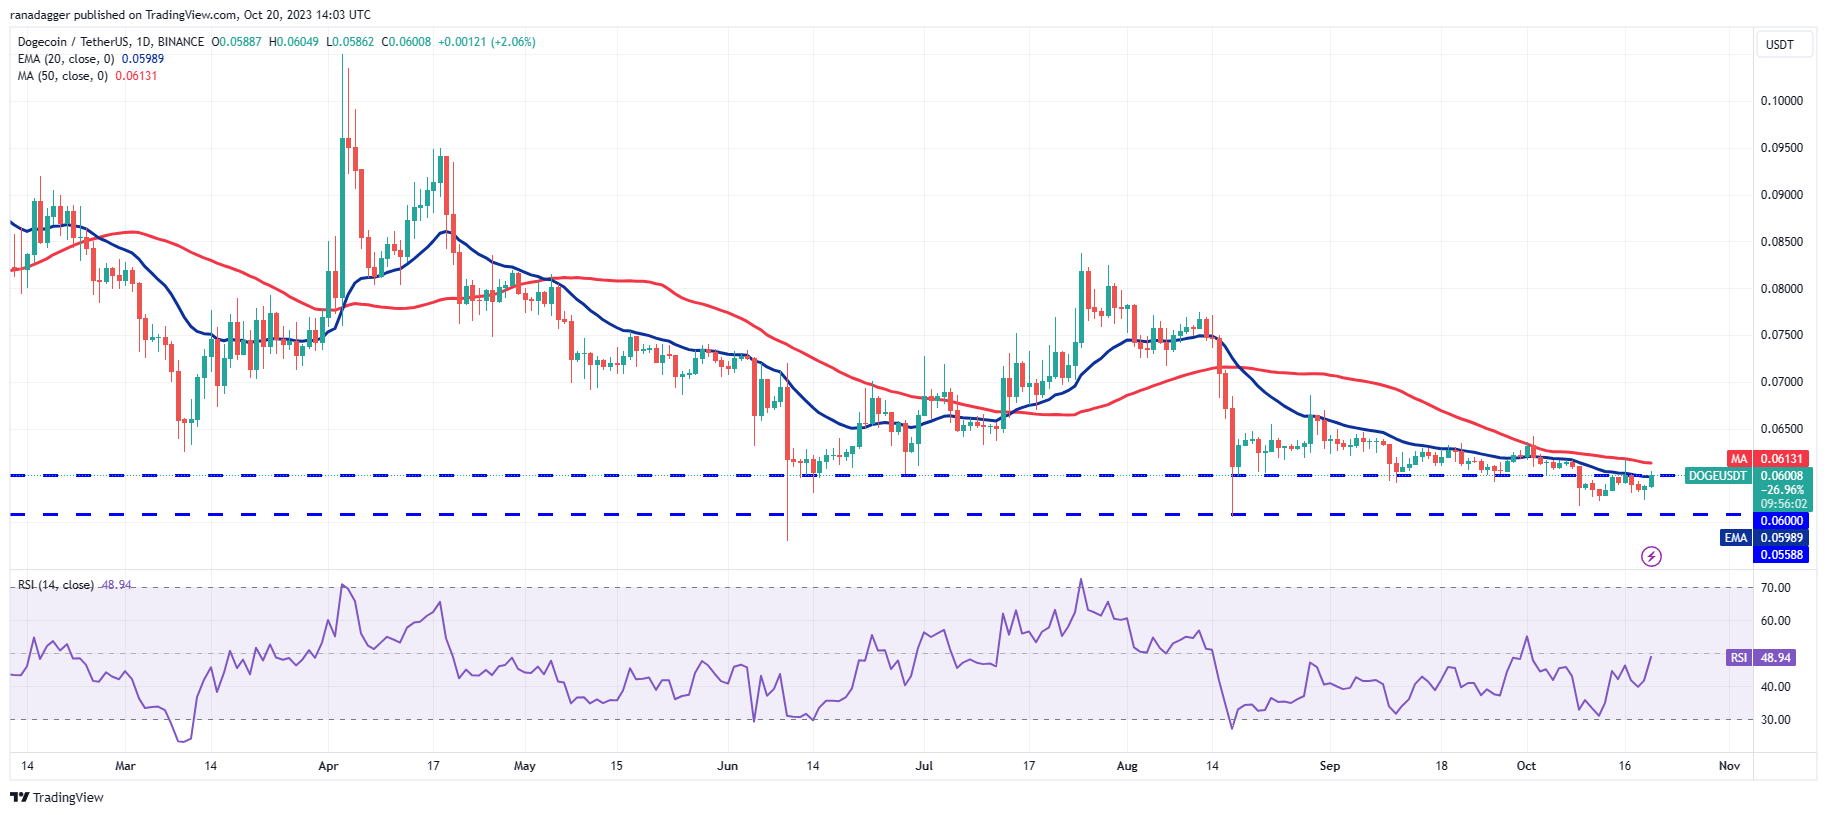
The long tail on Dogecoin’s (DOGE) Oct. 19 candlestick indicates that bulls are actively buying in the range between $0.055 and $0.06.
 DOGE/USDT daily chart. Source: TradingView
The bulls must push the price above the 50-day SMA ($0.06) to signal a recovery. This could pave the way for a potential rise to the overhead resistance at $0.07. This level may see a fierce contest between the bulls and bears, but if buyers prevail, the DOGE/USDT pair could surge to $0.08.
If the price declines from the moving averages, it will indicate that bears remain active at higher levels. A drop below $0.055 will signal the beginning of the next phase of the downtrend.
Related: Why is XRP price up today?
Toncoin price analysis
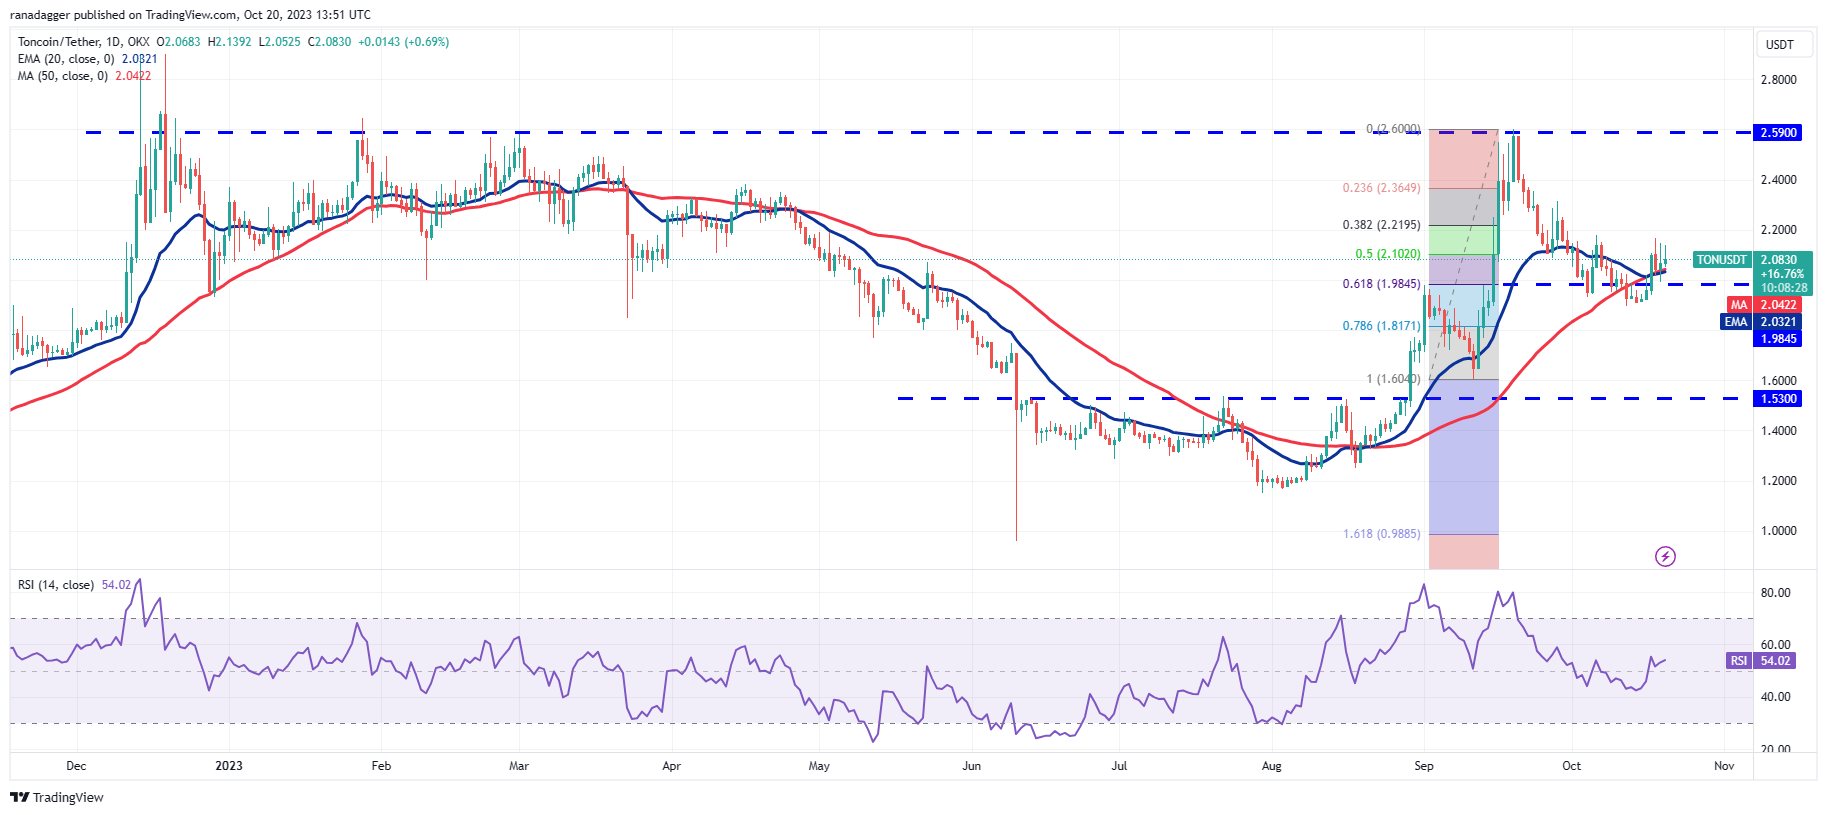
Toncoin (TON) fell below the 61.8% Fibonacci retracement level of $1.98 on Oct. 12, but the bears could not take advantage of this weakness. The bulls bought the dip and pushed the price back above $1.98 on Oct. 17.
 TON/USDT daily chart. Source: TradingView
The bears are attempting to halt the recovery at $2.20, but a positive sign is that the bulls have not allowed the price to drop back below the moving averages. This indicates that sentiment has shifted positively, with traders buying the dips.
If buyers push the price above $2.20, the TON/USDT pair will complete a small inverted H&S pattern. The target for this setup is $2.47. This optimistic outlook will be invalidated if the price declines and falls below $1.89.
Polkadot price analysis
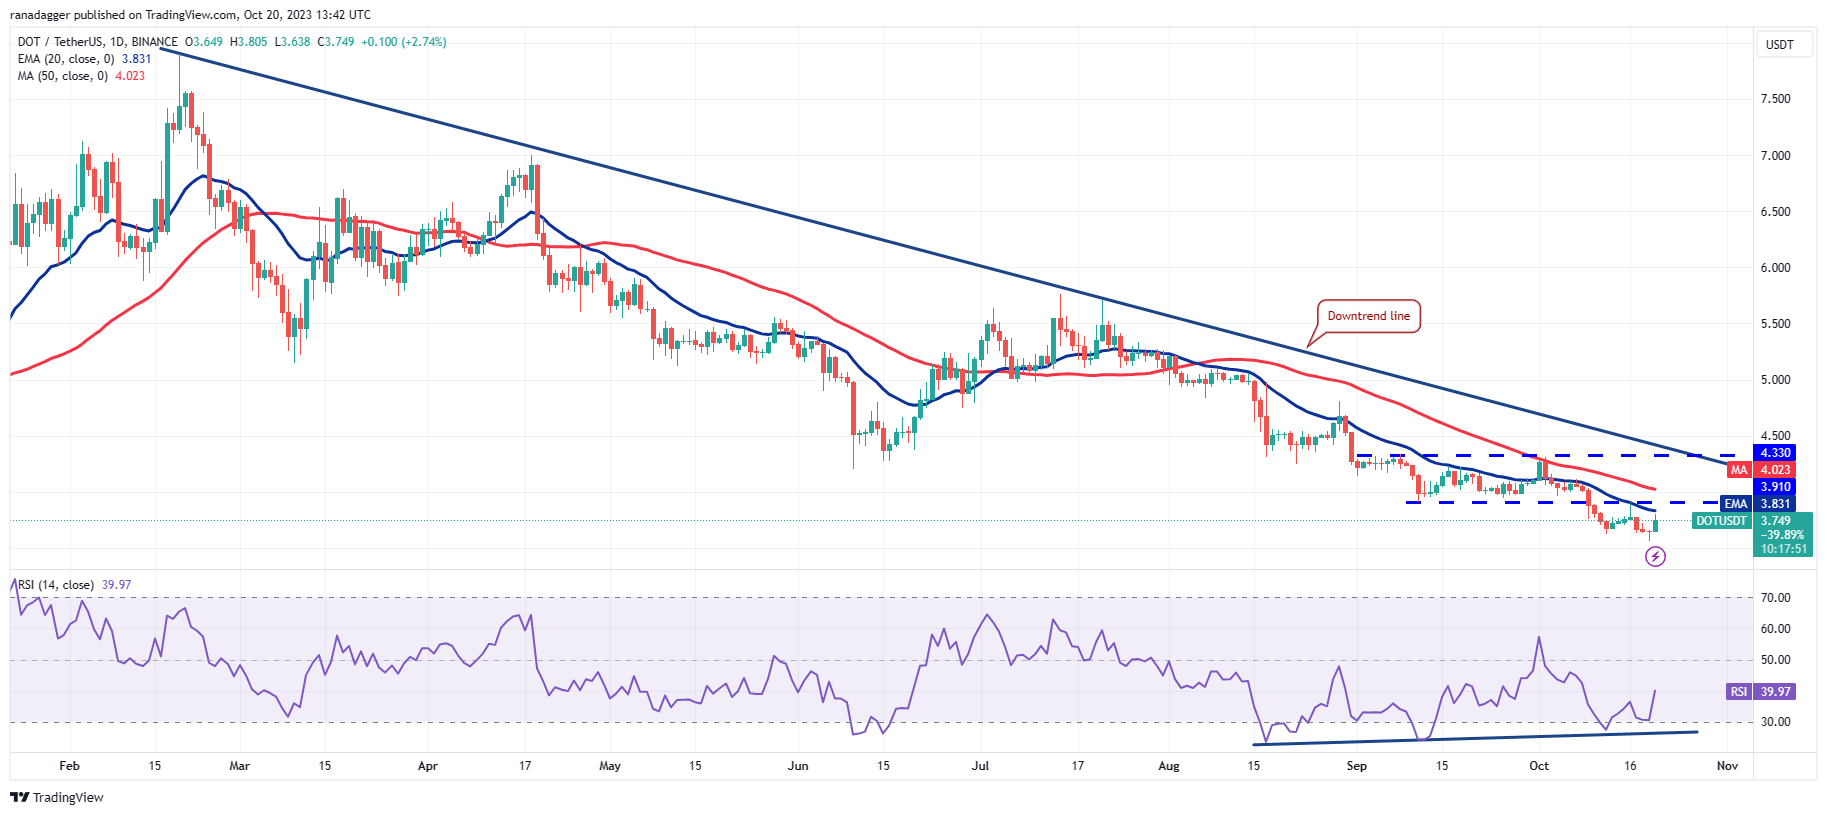
Polkadot (DOT) has been experiencing a strong downtrend. The bears attempted to extend the decline on Oct. 19, but the long tail on the candlestick indicates robust buying at lower levels.
 DOT/USDT daily chart. Source: TradingView
The relief rally is likely to reach the breakdown level of $3.91, where bears are expected to mount a strong defense. If the price declines from this level, it will suggest that sentiment remains negative and traders are selling on rallies. The bears will again attempt to pull the price below $3.56 and initiate the next phase of the downtrend.
Conversely, if the price breaks above $3.91, it will indicate the beginning of a stronger recovery. The DOT/USDT pair could then rise to the downtrend line. A break above $4.33 will signal a potential trend reversal.
Polygon price analysis
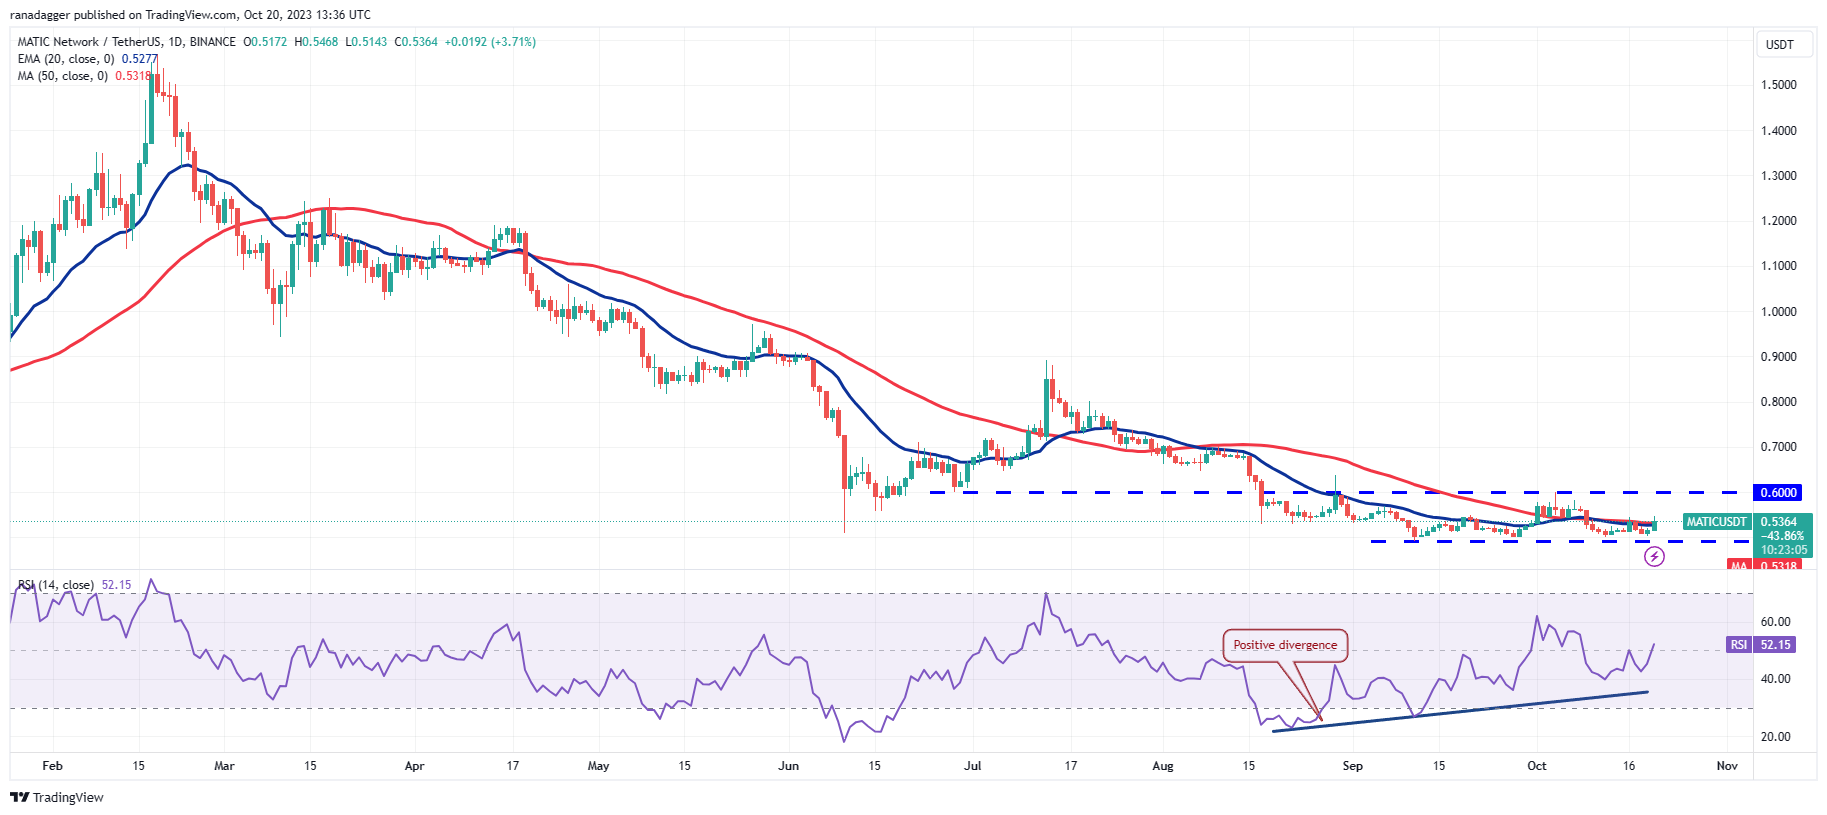
Polygon (MATIC) has been trading below the moving averages for several days, but the bears have failed to breach the support at $0.49. This suggests that selling pressure is diminishing at lower levels.
 MATIC/USDT daily chart. Source: TradingView
The positive divergence on the RSI also indicates that selling pressure may be easing. If buyers propel and maintain the price above the moving averages, the MATIC/USDT pair could surge to the overhead resistance at $0.60. This level may again attract selling from the bears. The pair is likely to oscillate between $0.49 and $0.60 for a while longer.
On the downside, $0.49 remains a crucial level to monitor. If this level is breached, the pair may plummet to $0.45.
This article does not contain investment advice or recommendations. Every investment and trading move involves risk, and readers should conduct their own research when making a decision.