Disclaimer: Information found on CryptoreNews is those of writers quoted. It does not represent the opinions of CryptoreNews on whether to sell, buy or hold any investments. You are advised to conduct your own research before making any investment decisions. Use provided information at your own risk.
CryptoreNews covers fintech, blockchain and Bitcoin bringing you the latest crypto news and analyses on the future of money.

A significant technical indicator indicates that the price of the leading cryptocurrency Bitcoin may soon surpass the $100,000 threshold, even though it is currently experiencing a bearish trend that has seen its value decline from a peak of $72,000 to approximately $63,500.
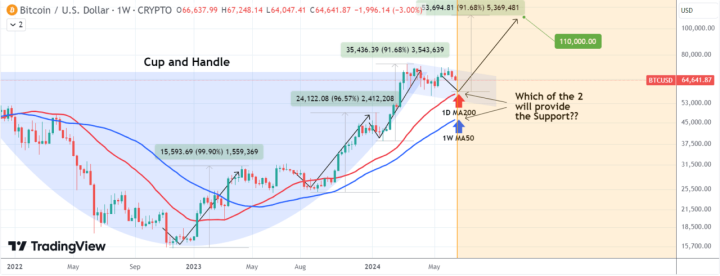
As per technical analysis shared on TradingView by cryptocurrency trader TradingShot, Bitcoin’s price chart on the weekly timeframe has developed a substantial cup and handle pattern.
A cup and handle pattern emerges when the price of an asset declines and then recovers to create a “u” shape, followed by a slight downward movement that forms the handle. This pattern is generally regarded as a bullish indicator.
 Bitcoin’s Price Chart Analysis
According to TradingShot, while the technical pattern remains valid, it may have been overlooked by some traders who often concentrate on either short-term price movements or cyclical patterns that frequently repeat from cycle to cycle.
The chart, he noted, is currently in the process of forming its handle as the price trends downward – with BTC recently falling from around $65,000 to $63,500 – and the duration required for the pattern to complete “largely depends on which of the following MA [moving average] periods will hold.”
Related Posts
The 200-day moving average (1D MA200) has previously provided support for a notable rebound, while the 50-week moving average (1W MA50) has served as a dependable support level since March 2023.
The cup section of the pattern was established between early 2022 and mid-2023, while the handle has been developing through a downward channel into 2024. Looking forward, the analysis explores the potential upside following the completion of the handle.
Since the low of the bear cycle in November 2022, Bitcoin has recorded three upward price movements ranging from 91% to 99%.
The analyst posits that the next expansion phase could drive Bitcoin to a target range of $100,000 – $110,000, provided the 1D MA200 remains as support.
Importantly, data indicates that the recent decline in BTC prices has led investors to become “mainly fearful or disinterested” in the cryptocurrency.
This observation comes from on-chain analytics firm Santiment, which mentioned in a post on the microblogging platform X (formerly known as Twitter) that “this prolonged level of FUD [Fear Uncertainty and Doubt] is rare, as traders continue to capitulate.”
According to the firm, bitcoin trader “fatigue” coupled with ongoing whale accumulation “generally leads to bounces that reward the patient.”