Disclaimer: Information found on CryptoreNews is those of writers quoted. It does not represent the opinions of CryptoreNews on whether to sell, buy or hold any investments. You are advised to conduct your own research before making any investment decisions. Use provided information at your own risk.
CryptoreNews covers fintech, blockchain and Bitcoin bringing you the latest crypto news and analyses on the future of money.
Bitcoin (BTC) continues to exhibit a bullish reversal when examining the price chart for this year. The BTC price has surged by 70% after reaching a low of approximately $16,800 in November 2022, overcoming concerns regarding interest rate increases while benefiting from heightened optimism surrounding exchange-traded fund approvals.
Nonetheless, in recent months, Bitcoin bulls have struggled to maintain the BTC price above the $30,000 mark. Consequently, with the “bullish” halving still more than 200 days away, many traders are questioning whether the Bitcoin price might experience another decline in the upcoming months.
Cointelegraph explores potential scenarios as Q3 comes to a close.
Fibonacci fractal suggests a Bitcoin drop to $21,500
From a technical perspective, the Bitcoin price has stabilized around the 0.236 Fib line of its Fibonacci retracement chart, which is drawn from the $69,000 swing high (the market peak) to the $15,900 swing low (the local market bottom).
This stagnant BTC price movement closely resembles the pattern observed during the 2018 BTC price correction.
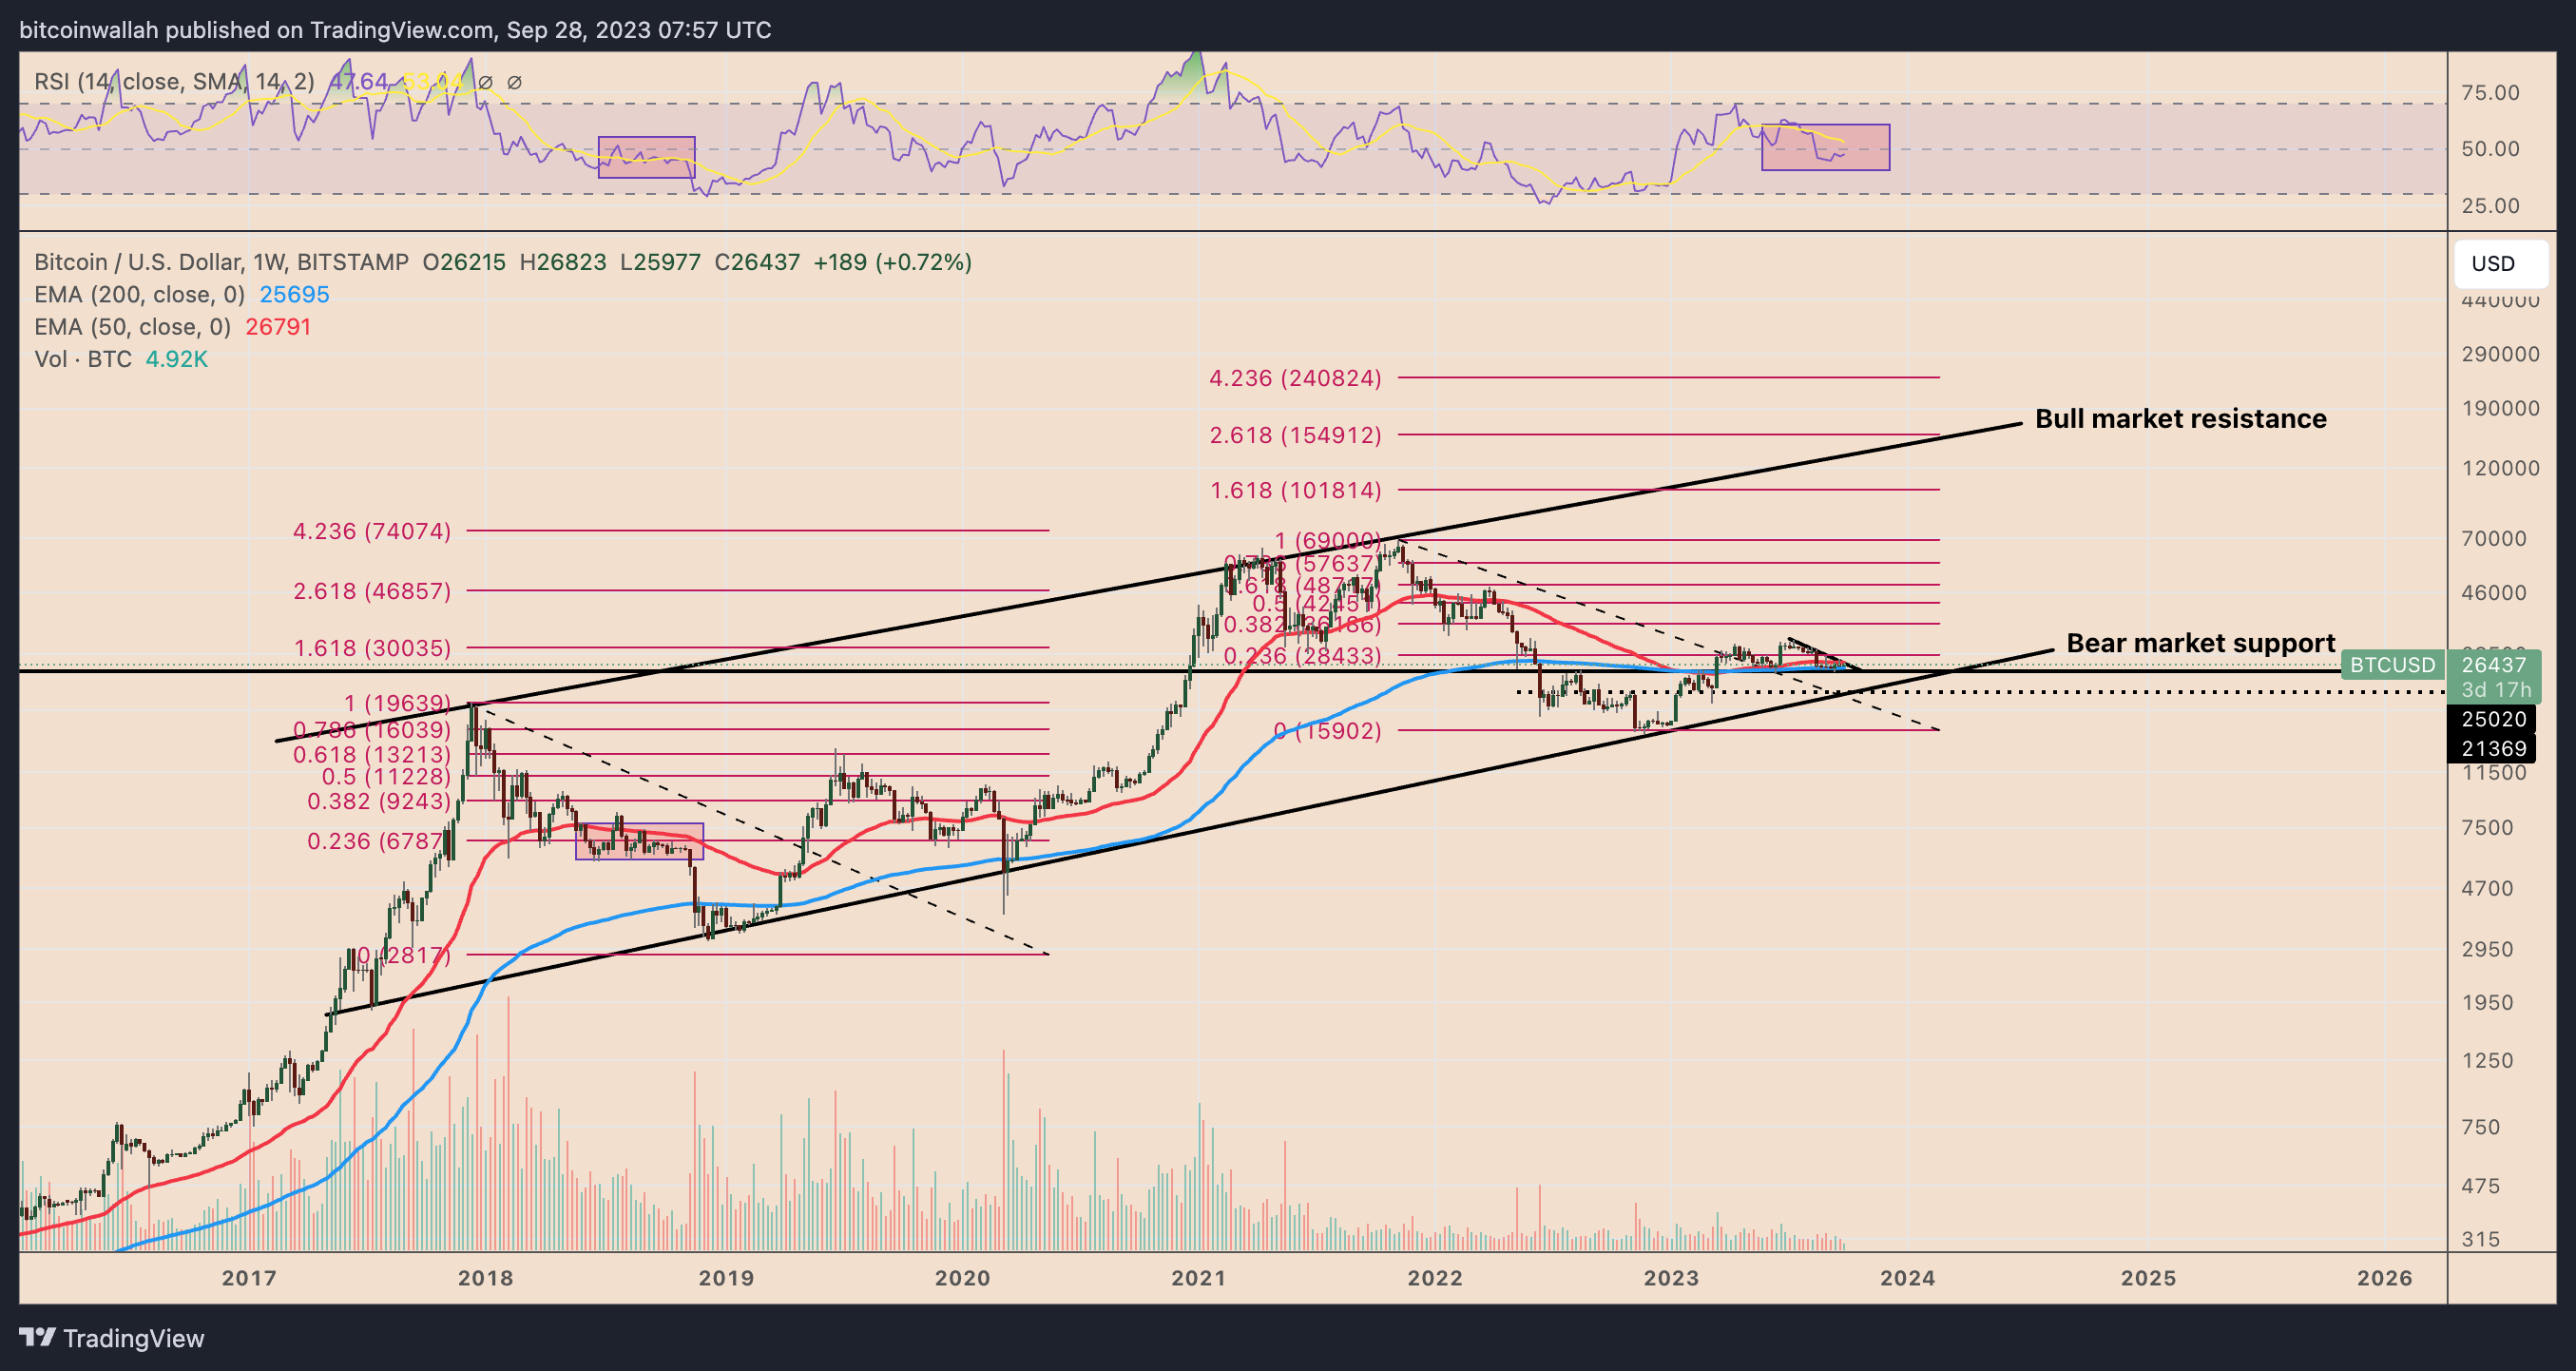 BTC/USD weekly price chart. Source: TradingView
In 2018, the BTC/USD pair remained around its 0.236 Fib line at approximately $6,790 for several months before plummeting to around $3,000 in December. The $3,000 level aligned with what is now a multi-year ascending trendline support (indicated as bear market support in the chart above).
Bitcoin is currently halfway through a repeat of the 2018 scenario, with the price stabilizing at the 0.236 Fib line. A breakdown from this level would indicate that the BTC price could target $21,500 as the next significant support level, representing a decline of 17.75% from current values.
Strong dollar increases Bitcoin’s downside risks
Meanwhile, the U.S. Dollar Index (DXY), which gauges the strength of the dollar against a basket of leading foreign currencies, has reached its highest point since November 2022.
The index has shown a negative correlation with Bitcoin throughout 2023, as illustrated below.
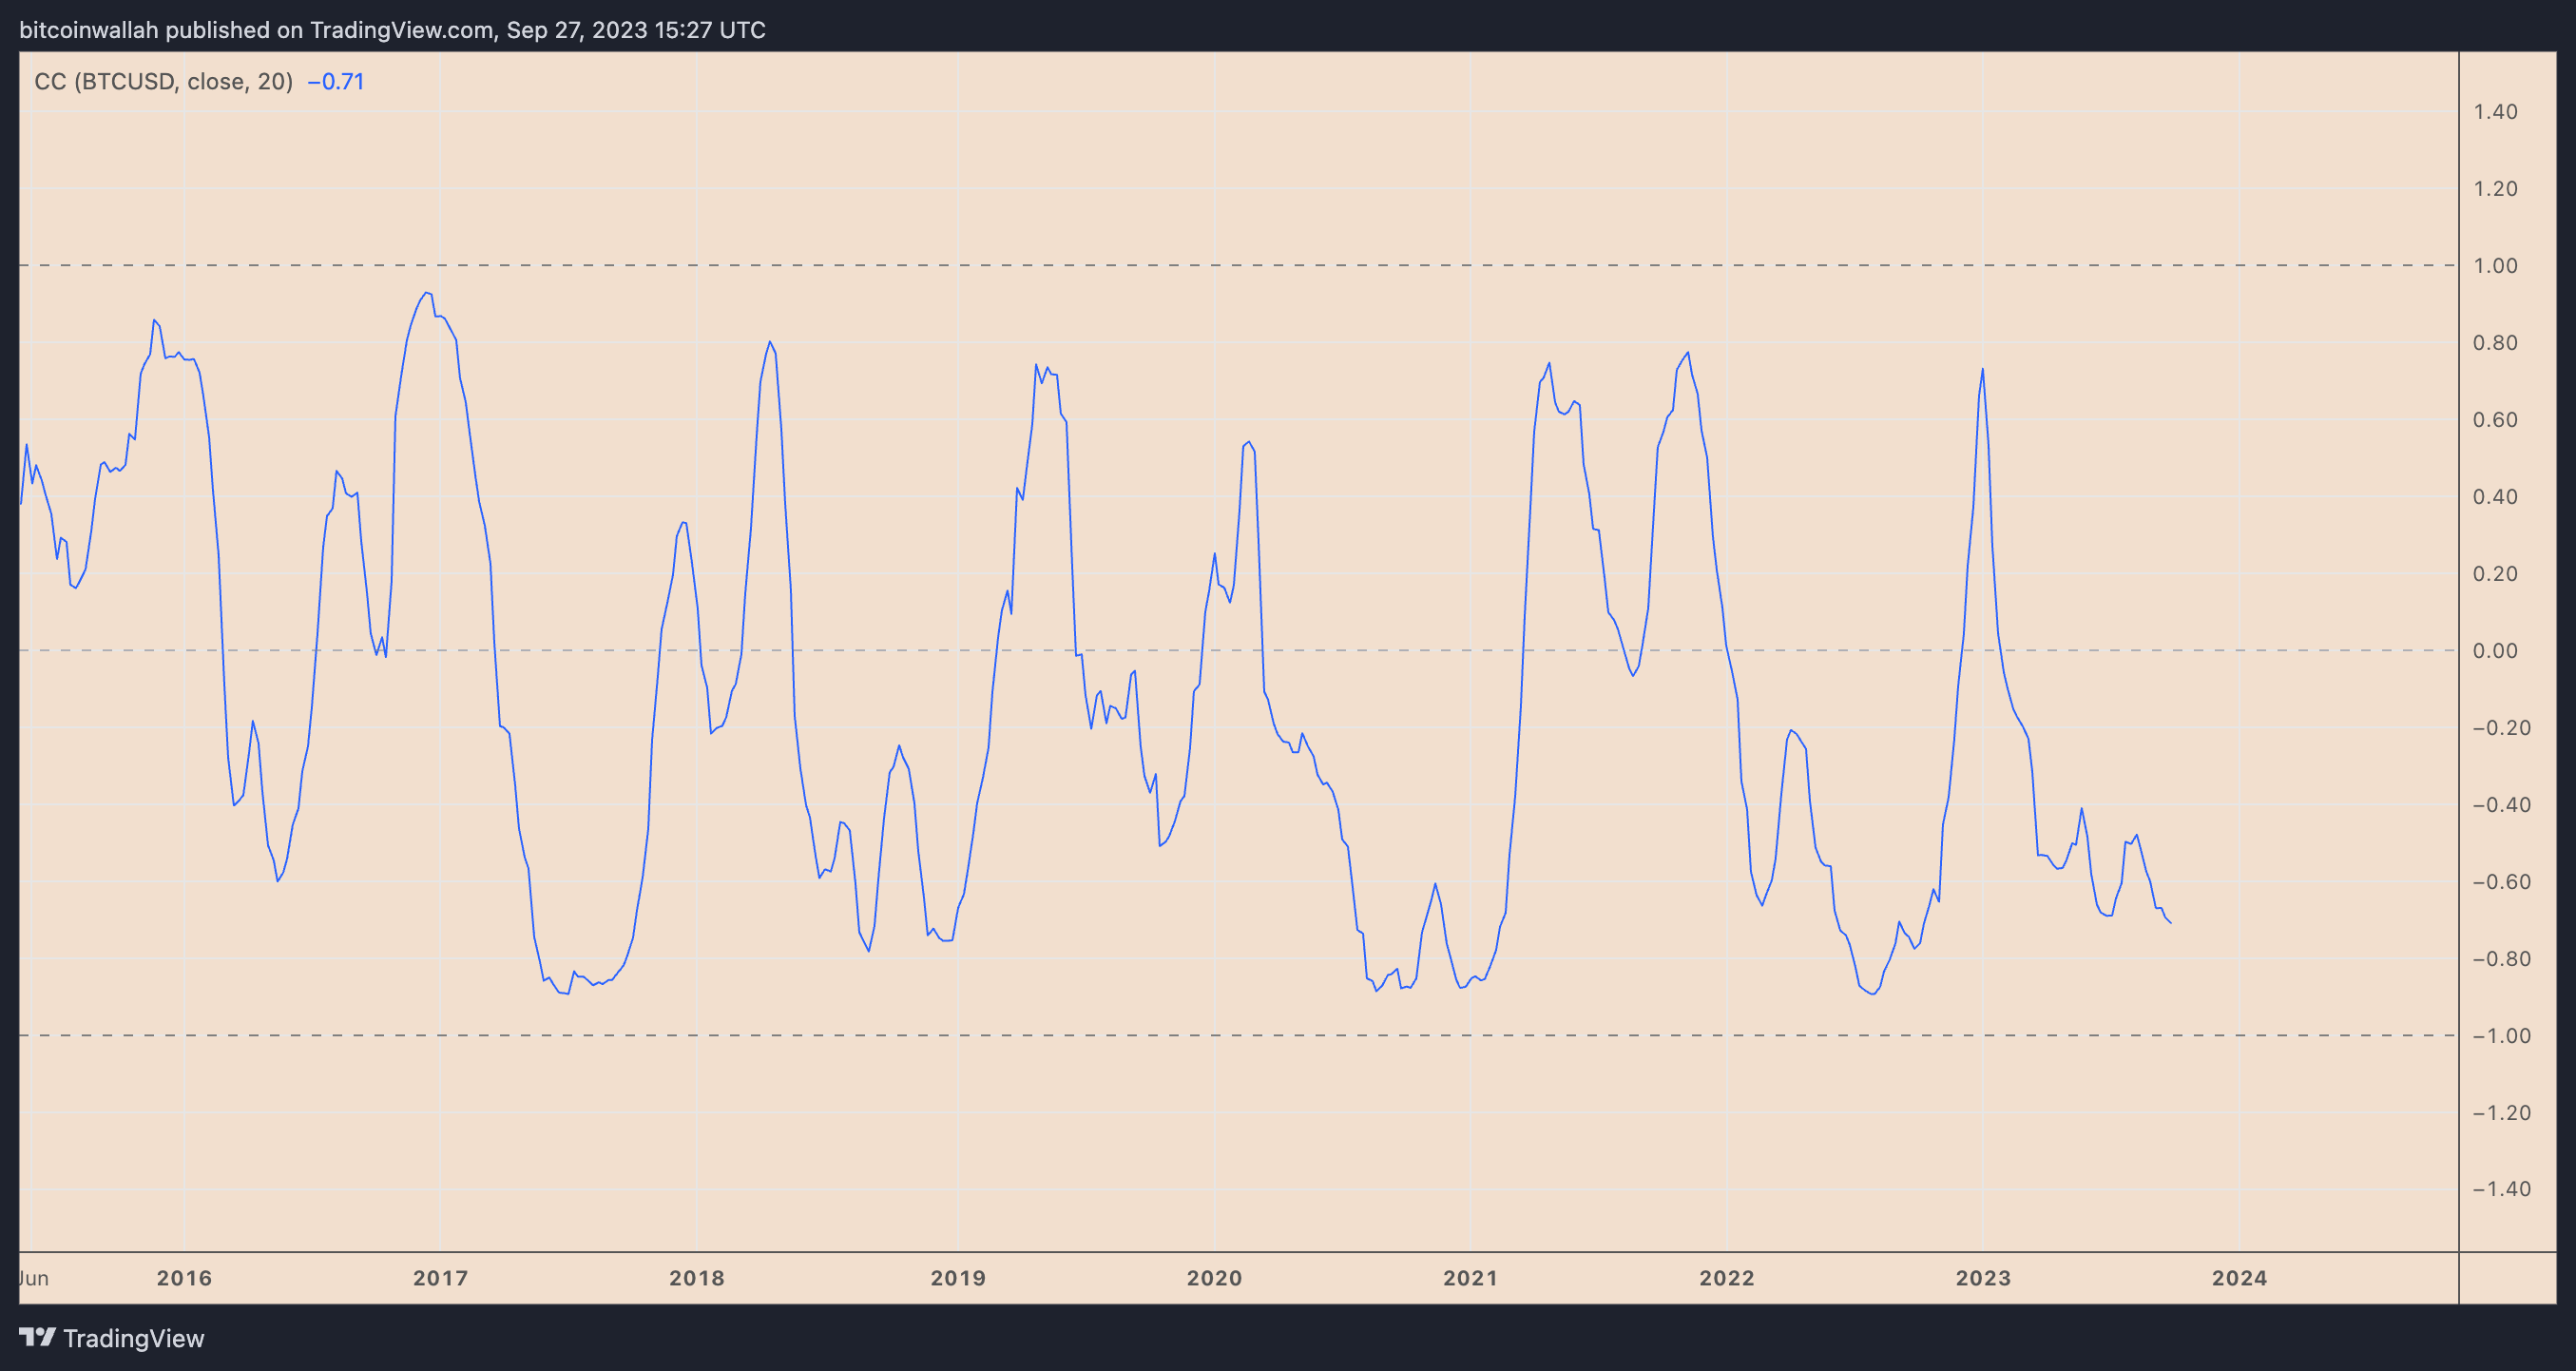 BTC/USD vs. DXY weekly price chart. Source: TradingView
The dollar’s rise has intensified following the U.S. Federal Reserve’s rate decision on September 20, and the DXY is currently on its 11th consecutive weekly gain.
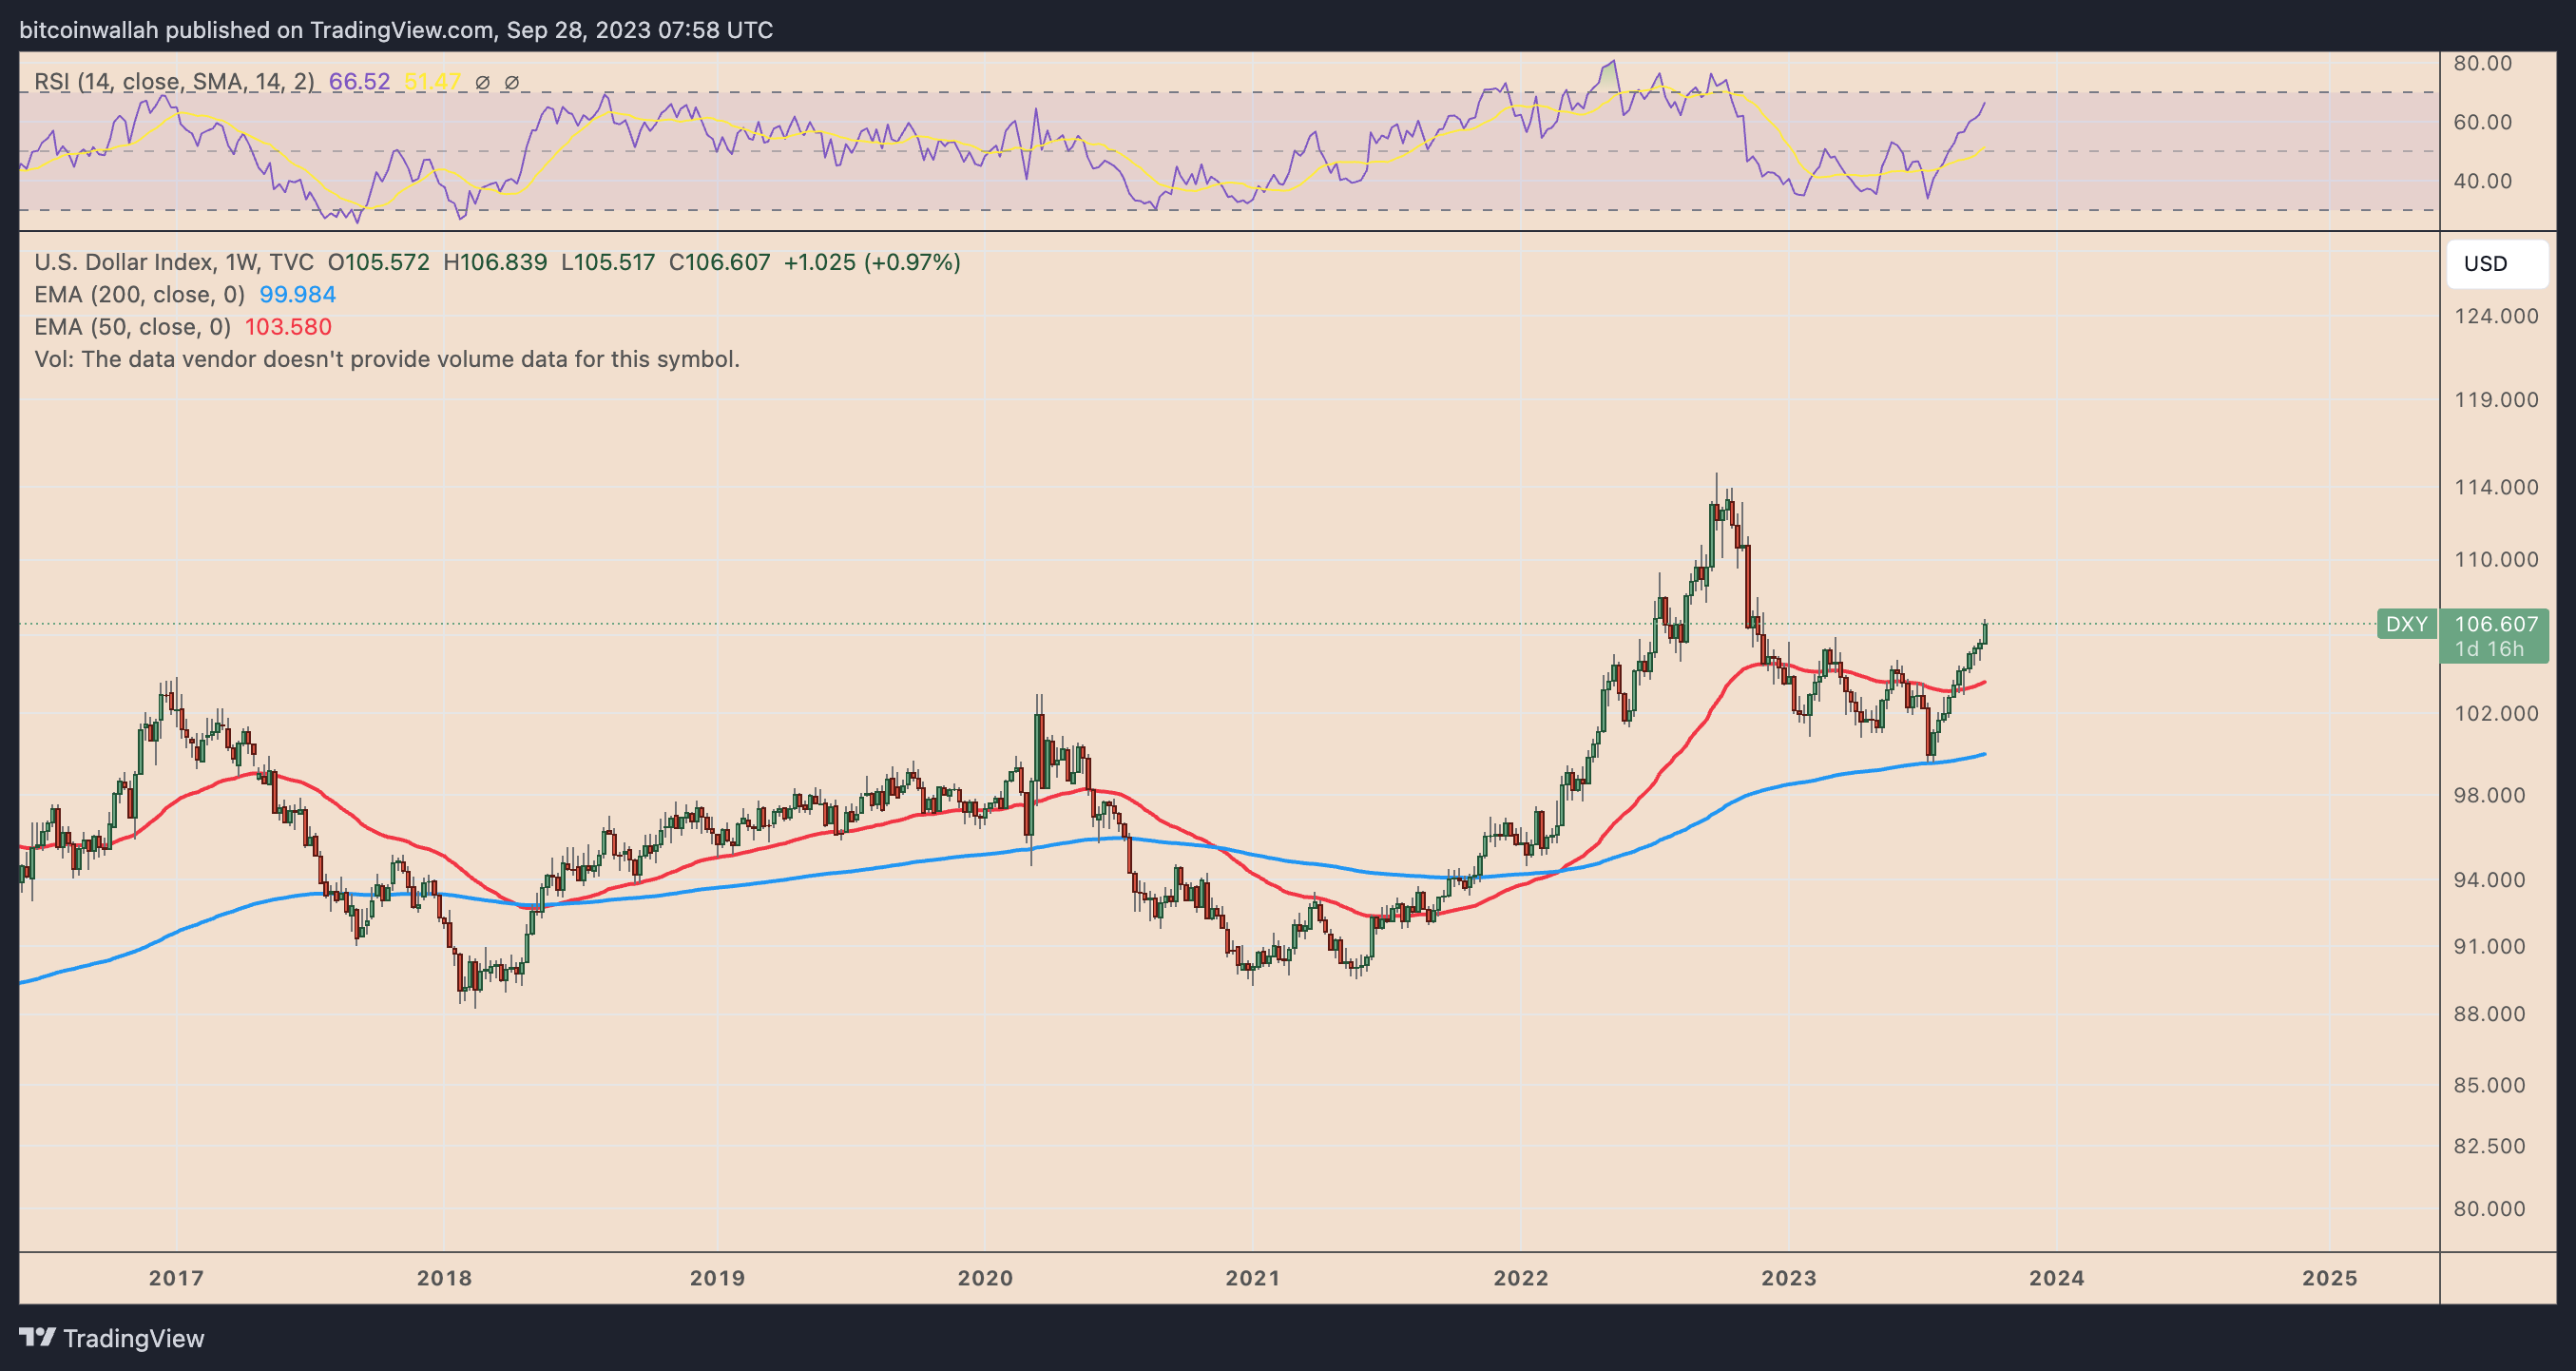 DXY weekly performance chart. Source: TradingView
In essence, Bitcoin’s potential for upward movement may be constrained if the dollar continues to strengthen following the DXY golden cross.
Related Posts
Are “old” Bitcoins being sold?
Bitcoin’s on-chain metrics present a mixed perspective.
The Bitcoin coin days destroyed (CDD) metric, which tracks the actions of long-term investors, surged on September 19, indicating that some long-term BTC holders have moved their coins, suggesting possible profit-taking or repositioning.
Traders should exercise caution here, as most CDD spikes have historically preceded price declines.
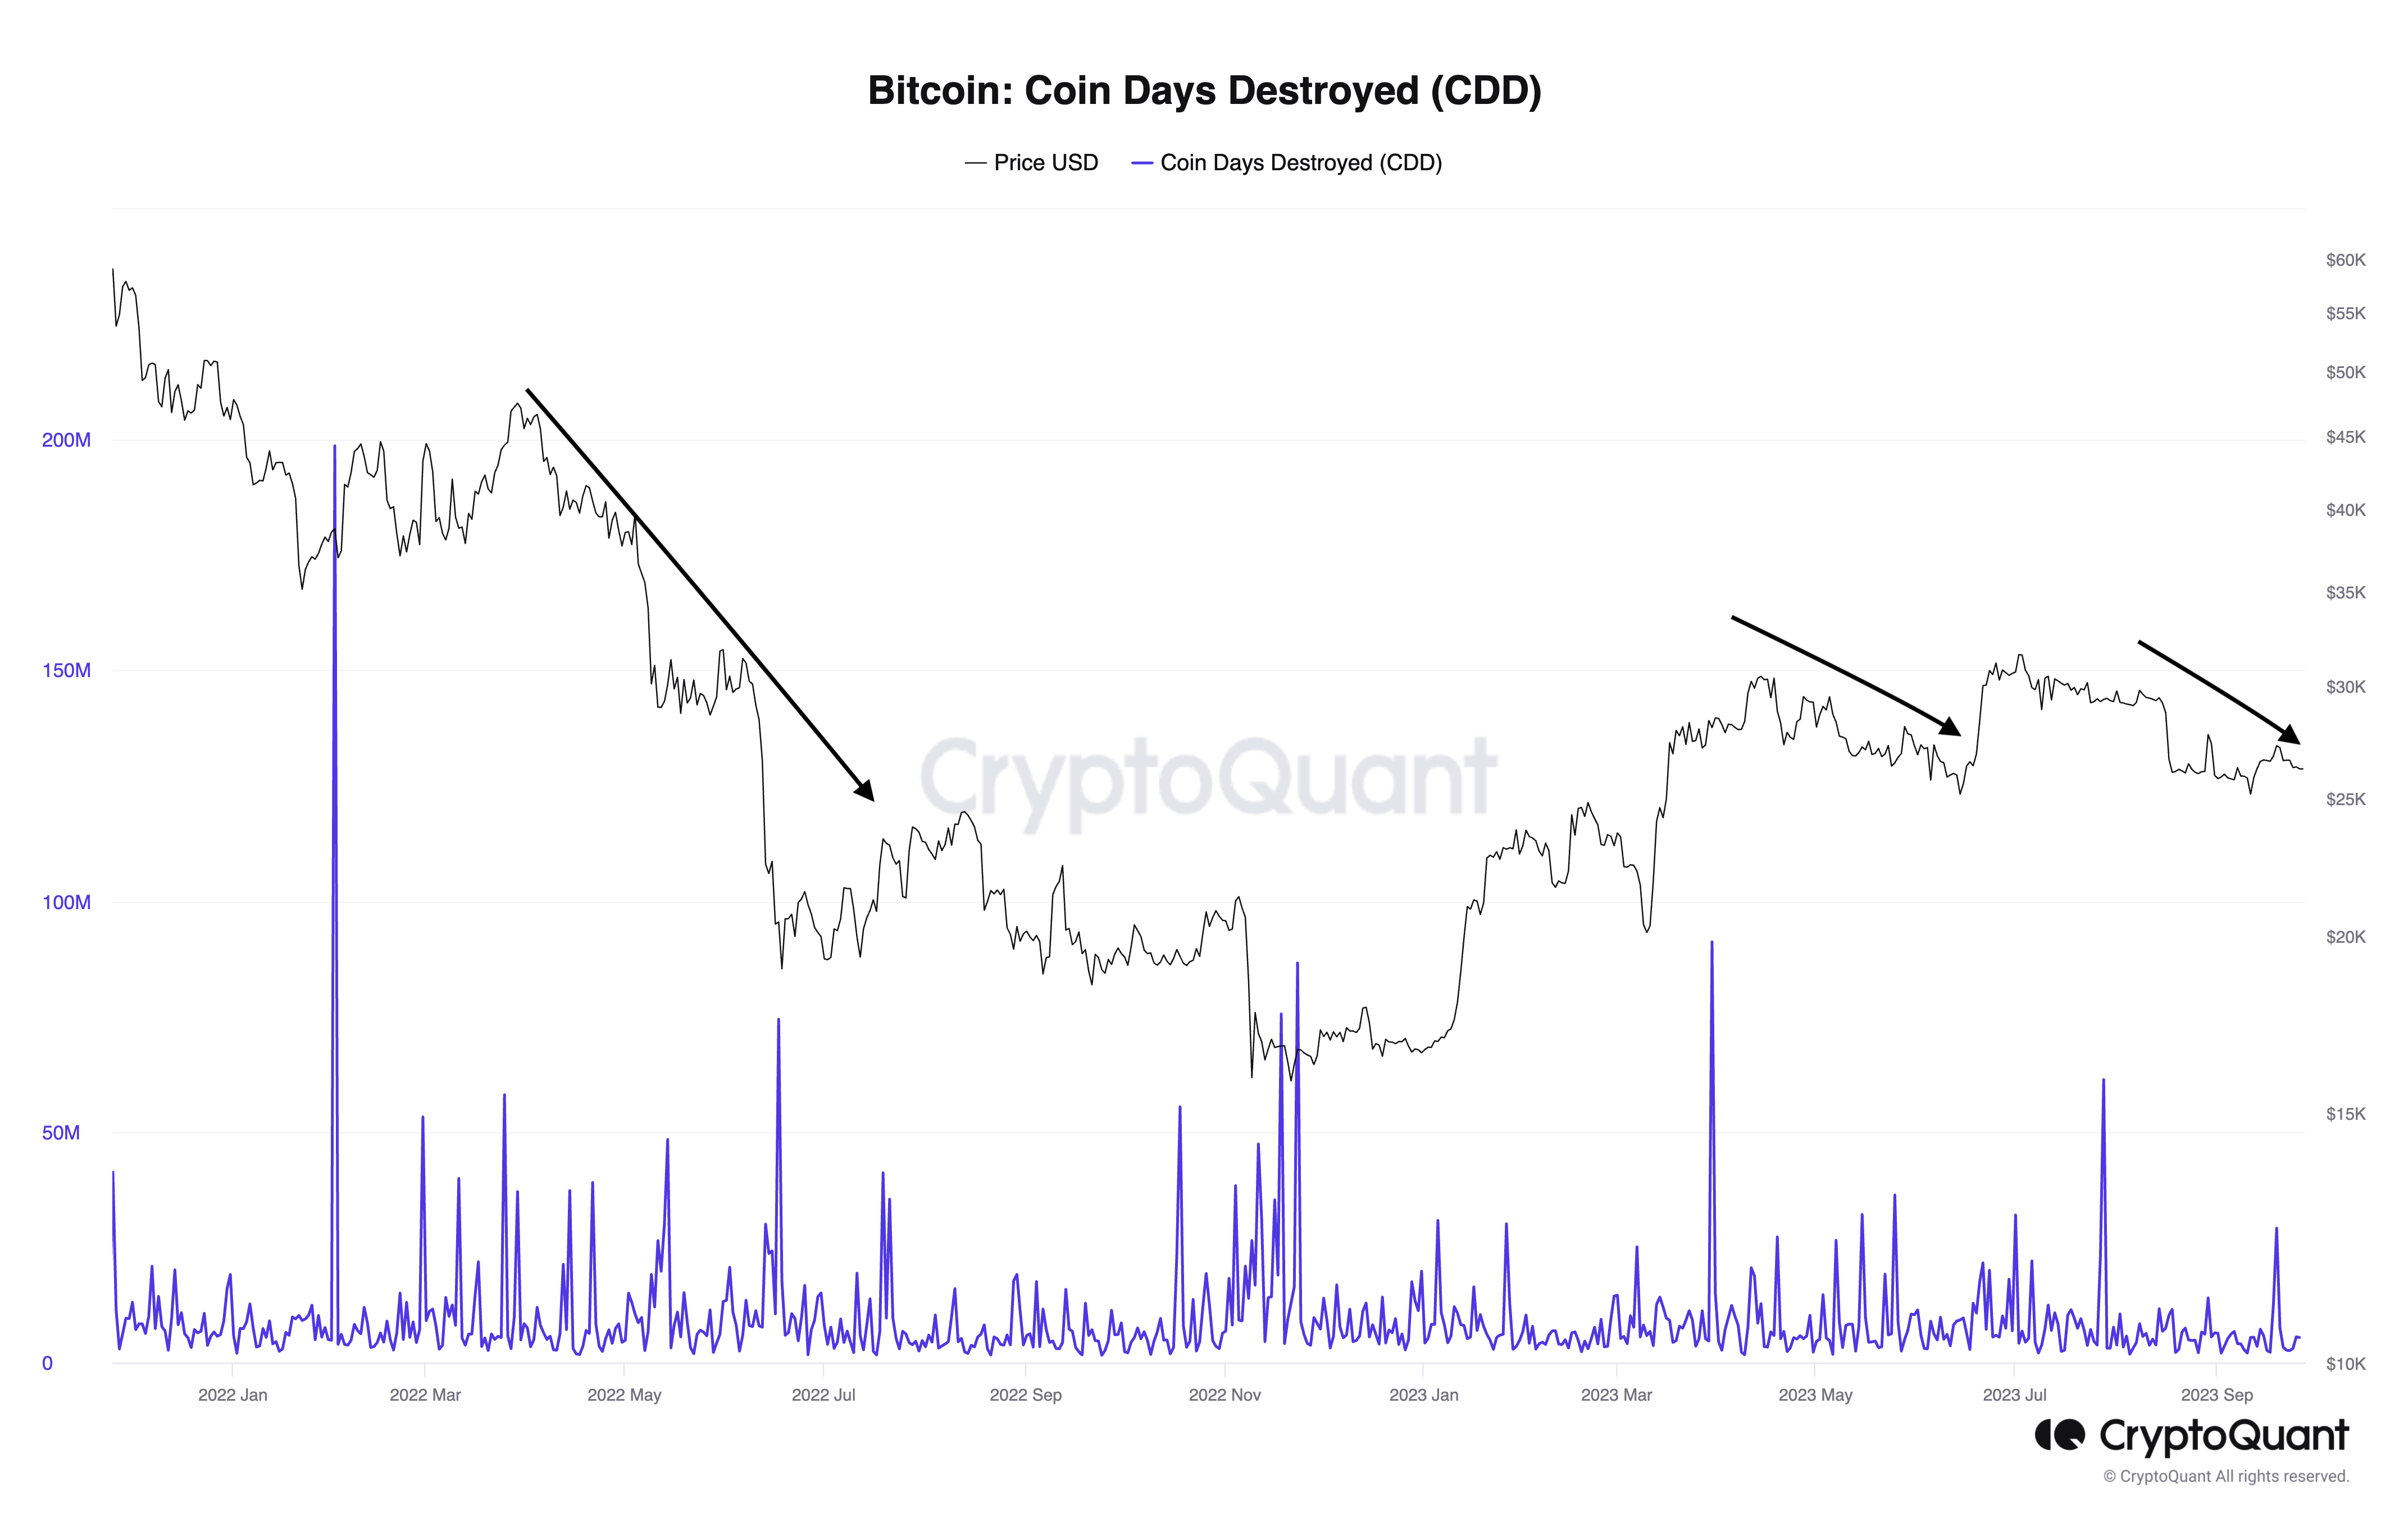 Bitcoin coin days destroyed. Source: CryptoQuant
Conversely, Bitcoin reserves across all cryptocurrency exchanges continue to decrease, indicating a growing tendency for investors to hold their assets.
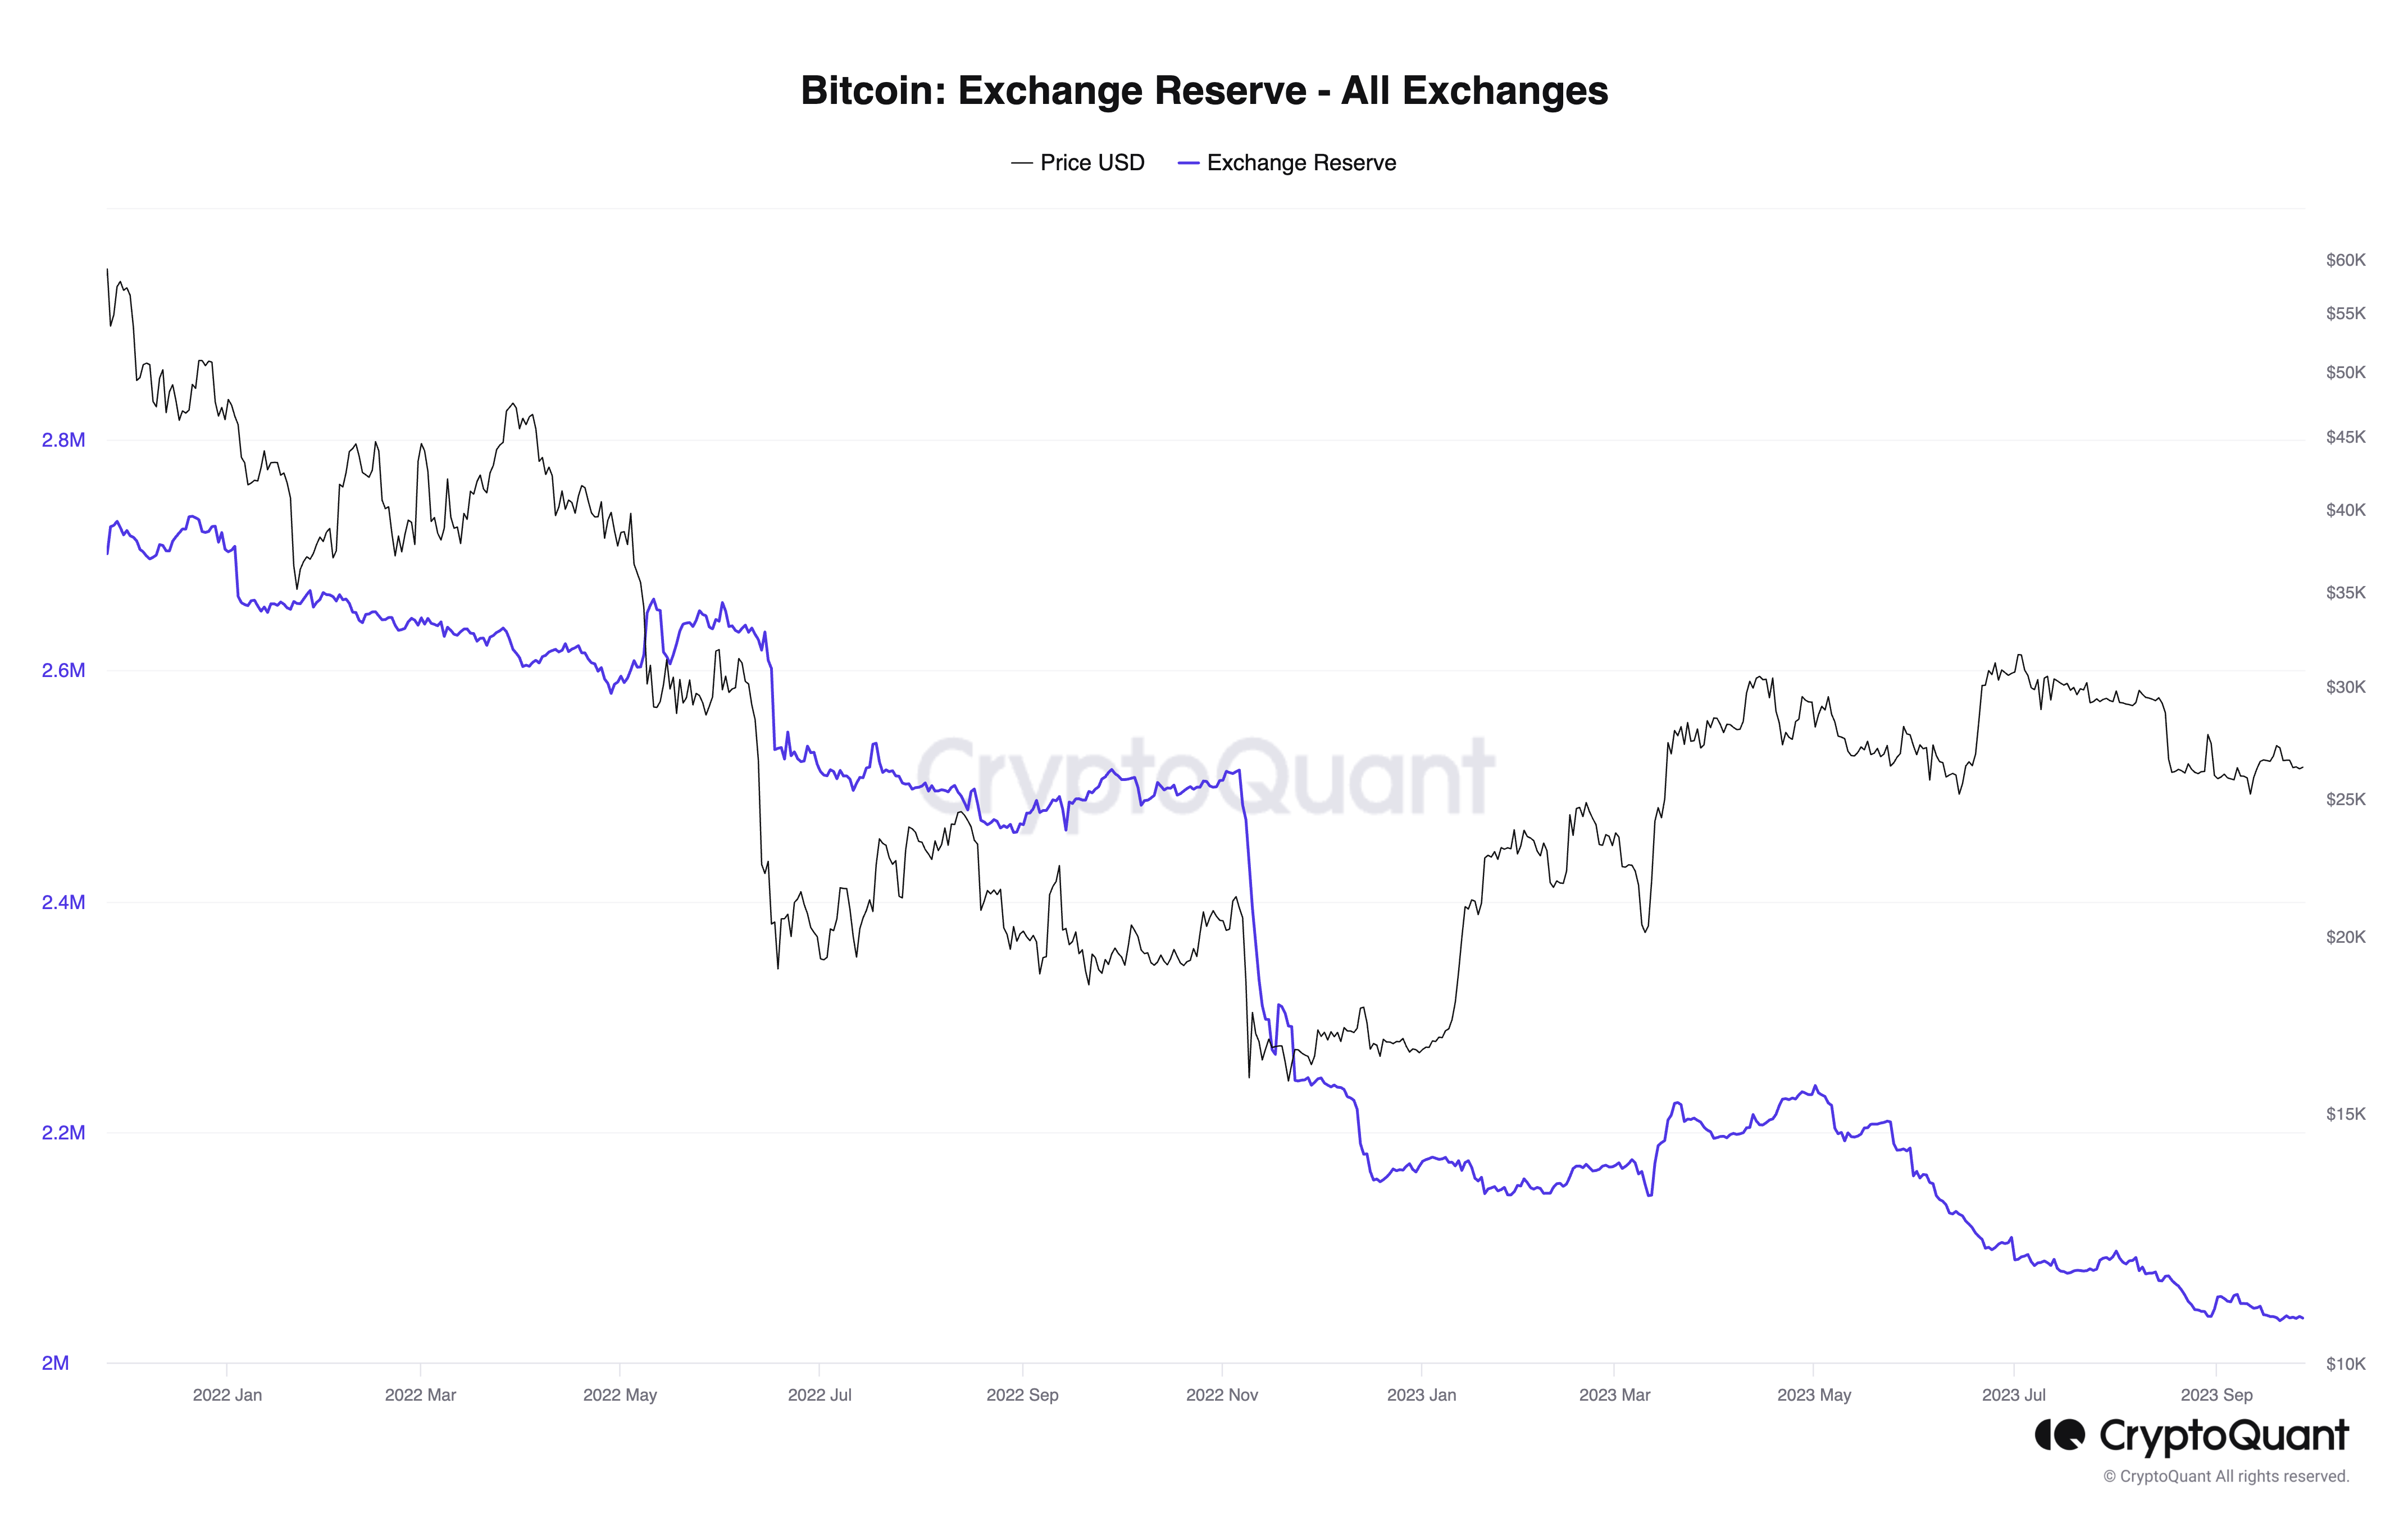 Bitcoin exchanges’ BTC reserves. Source: CryptoQuant
Insights from Bitcoin trading analysts
Bitcoin analysts are also split regarding the potential direction of the BTC price in the coming months.
Notable trader Skew suggests that the BTC price could reach $30,000 by October, pointing to thin ask liquidity near $27,000, which may lead to a breakout.
Related: Bitcoin fails to recoup post-Fed losses as $20K BTC price returns to radar
Conversely, fellow analyst Rekt Capital does not dismiss the possibility of a price correction toward $18,000 based on a pre-halving fractal illustrated below.
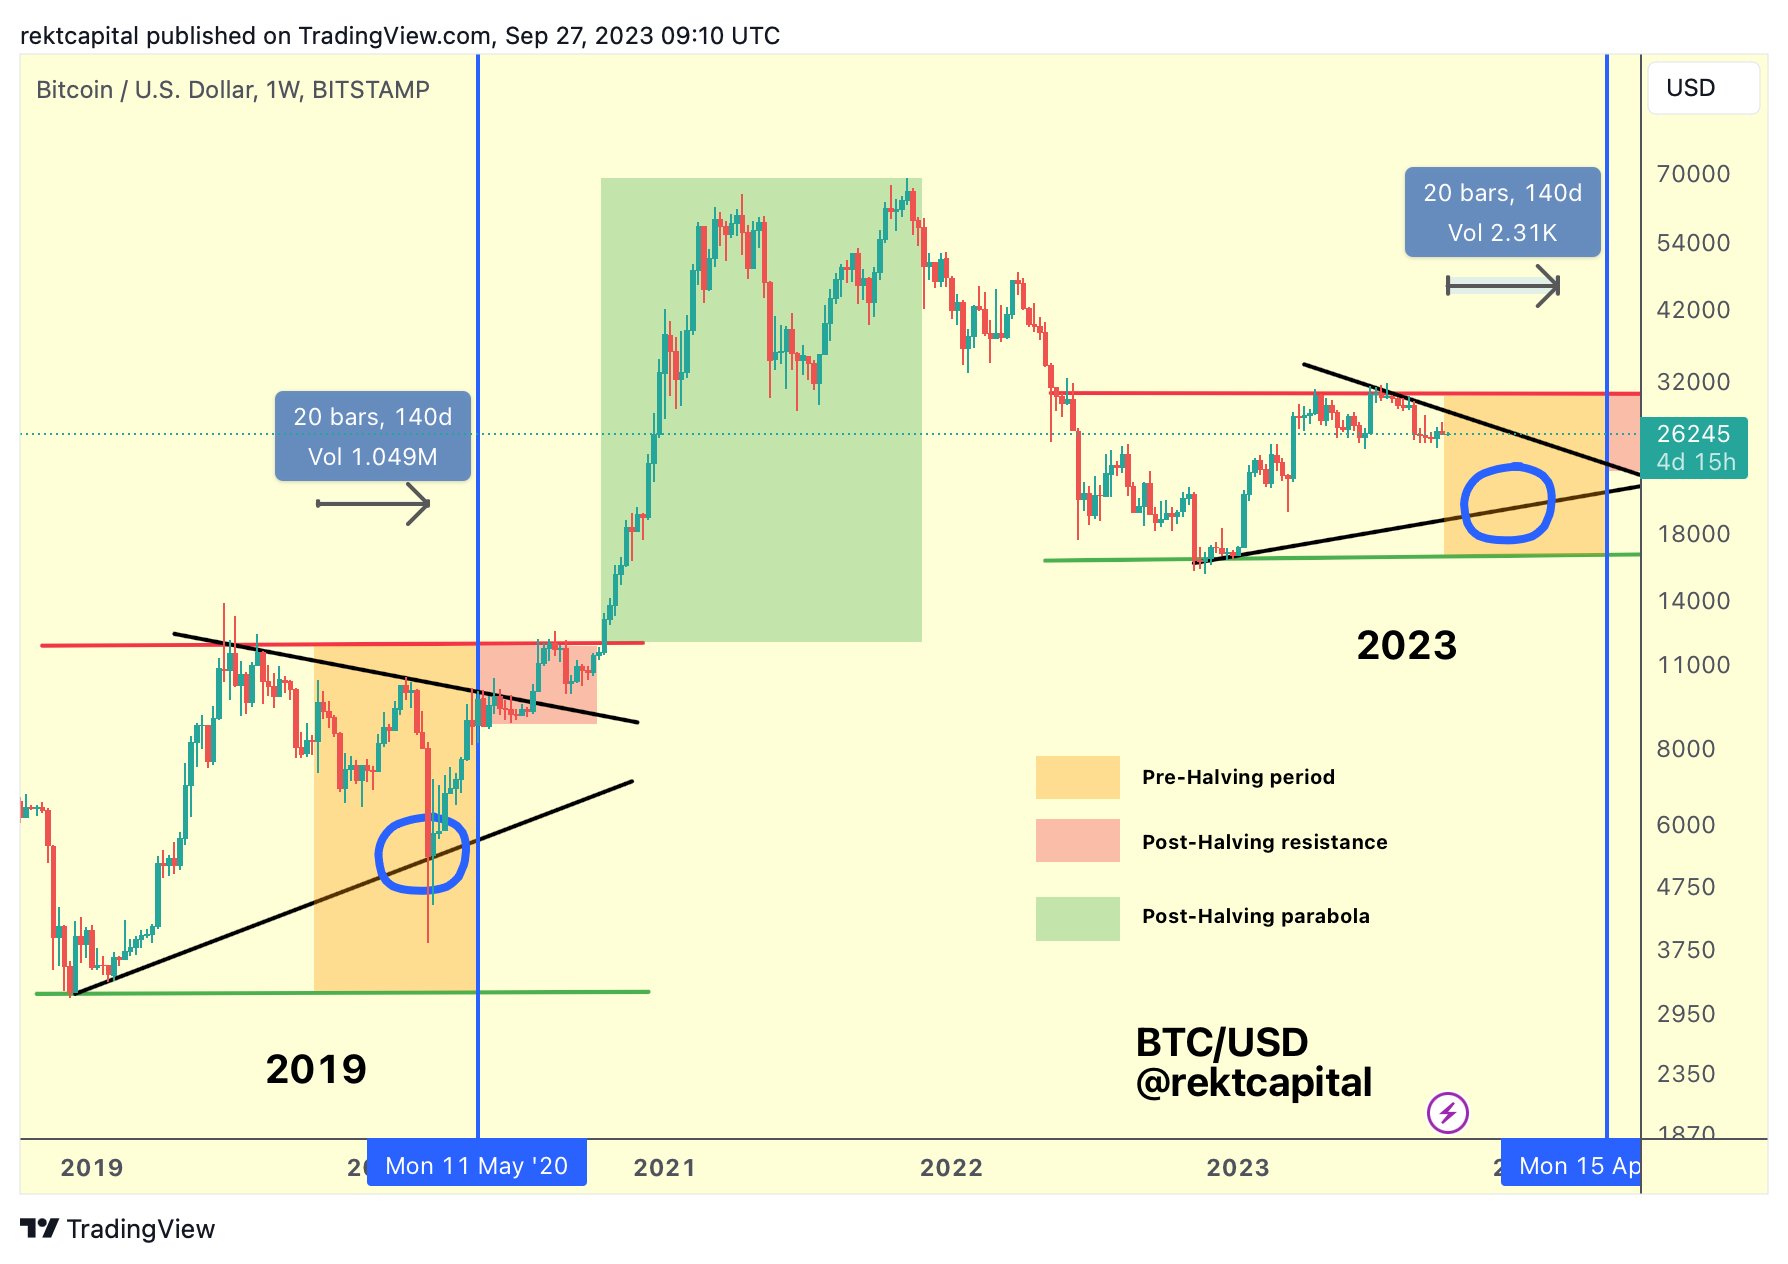 BTC/USD weekly price chart. Source: TradingView/Rekt Capital
“History indicates that the next 140 days will be critical for dollar-cost-averaging in preparation for the Post-Halving parabolic rally,” stated Rekt Capital, adding:
“If Bitcoin is going to retrace from [the current price levels], it will most likely occur during this current 140-day period.”
This article does not provide investment advice or recommendations. Every investment and trading decision carries risk, and readers should perform their own research before making a choice.