Disclaimer: Information found on CryptoreNews is those of writers quoted. It does not represent the opinions of CryptoreNews on whether to sell, buy or hold any investments. You are advised to conduct your own research before making any investment decisions. Use provided information at your own risk.
CryptoreNews covers fintech, blockchain and Bitcoin bringing you the latest crypto news and analyses on the future of money.
BTC price faces potential drop below $27K as Bitcoin trend indicators signal a ‘bullish cross’ formation.
Bitcoin (BTC) approached $27,000 following the Wall Street opening on May 11, as bullish momentum was lacking.
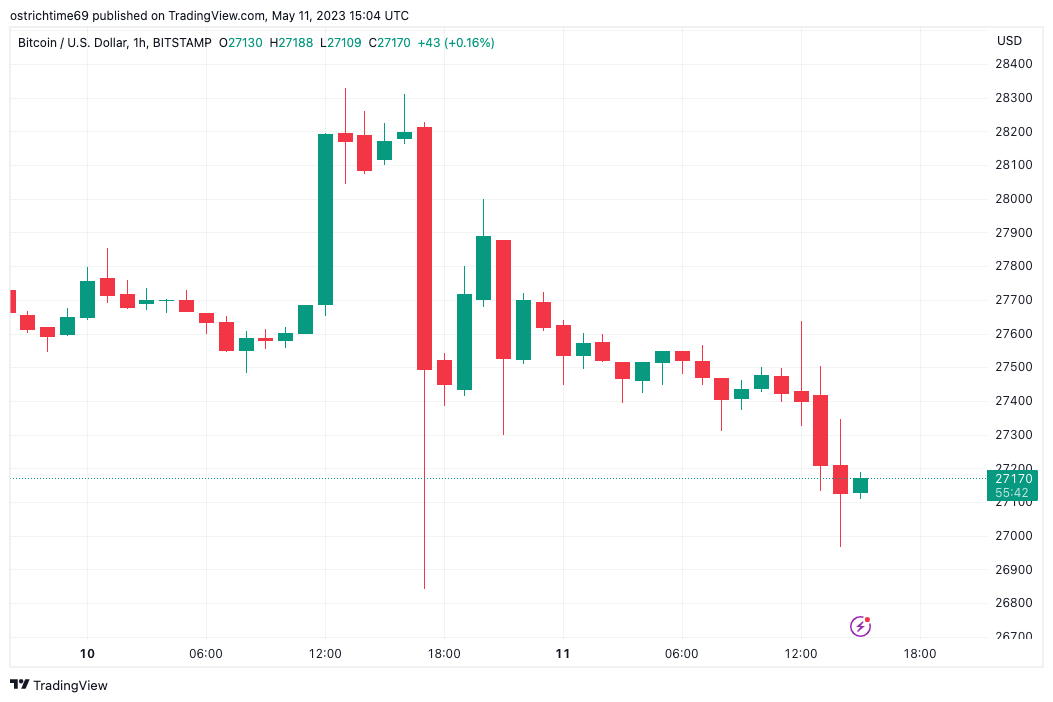 BTC/USD 1-hour candle chart (Bitstamp). Source: TradingView
BTC price “rolls over” after a short-lived recovery
Data from Cointelegraph Markets Pro and TradingView tracked BTC/USD as it faced the risk of losing further support.
Despite a slight rebound from the local lows observed the previous day, the pair remained fragile, even as new macroeconomic data from the United States provided some bullish signals.
“The drop was retraced, but then the price quickly rolled over again,” noted popular trader Daan Crypto Trades.
“We are still trading at the range lows, and until that changes, I believe shorts do not present a favorable risk-reward. Bulls must demonstrate strength by reclaiming the daily open for me to consider a potential reversal scenario.”
As previously reported by Cointelegraph, market participants continued to set downside targets, with many concentrating on the vicinity of $25,000.
“I remain short personally, but for anyone not yet in a short position, I would wait until we drop below $27,000 before considering a short on this support zone loss,” fellow trader Crypto Tony added.
“For now, we are maintaining it, so there is no reason to short just yet.”
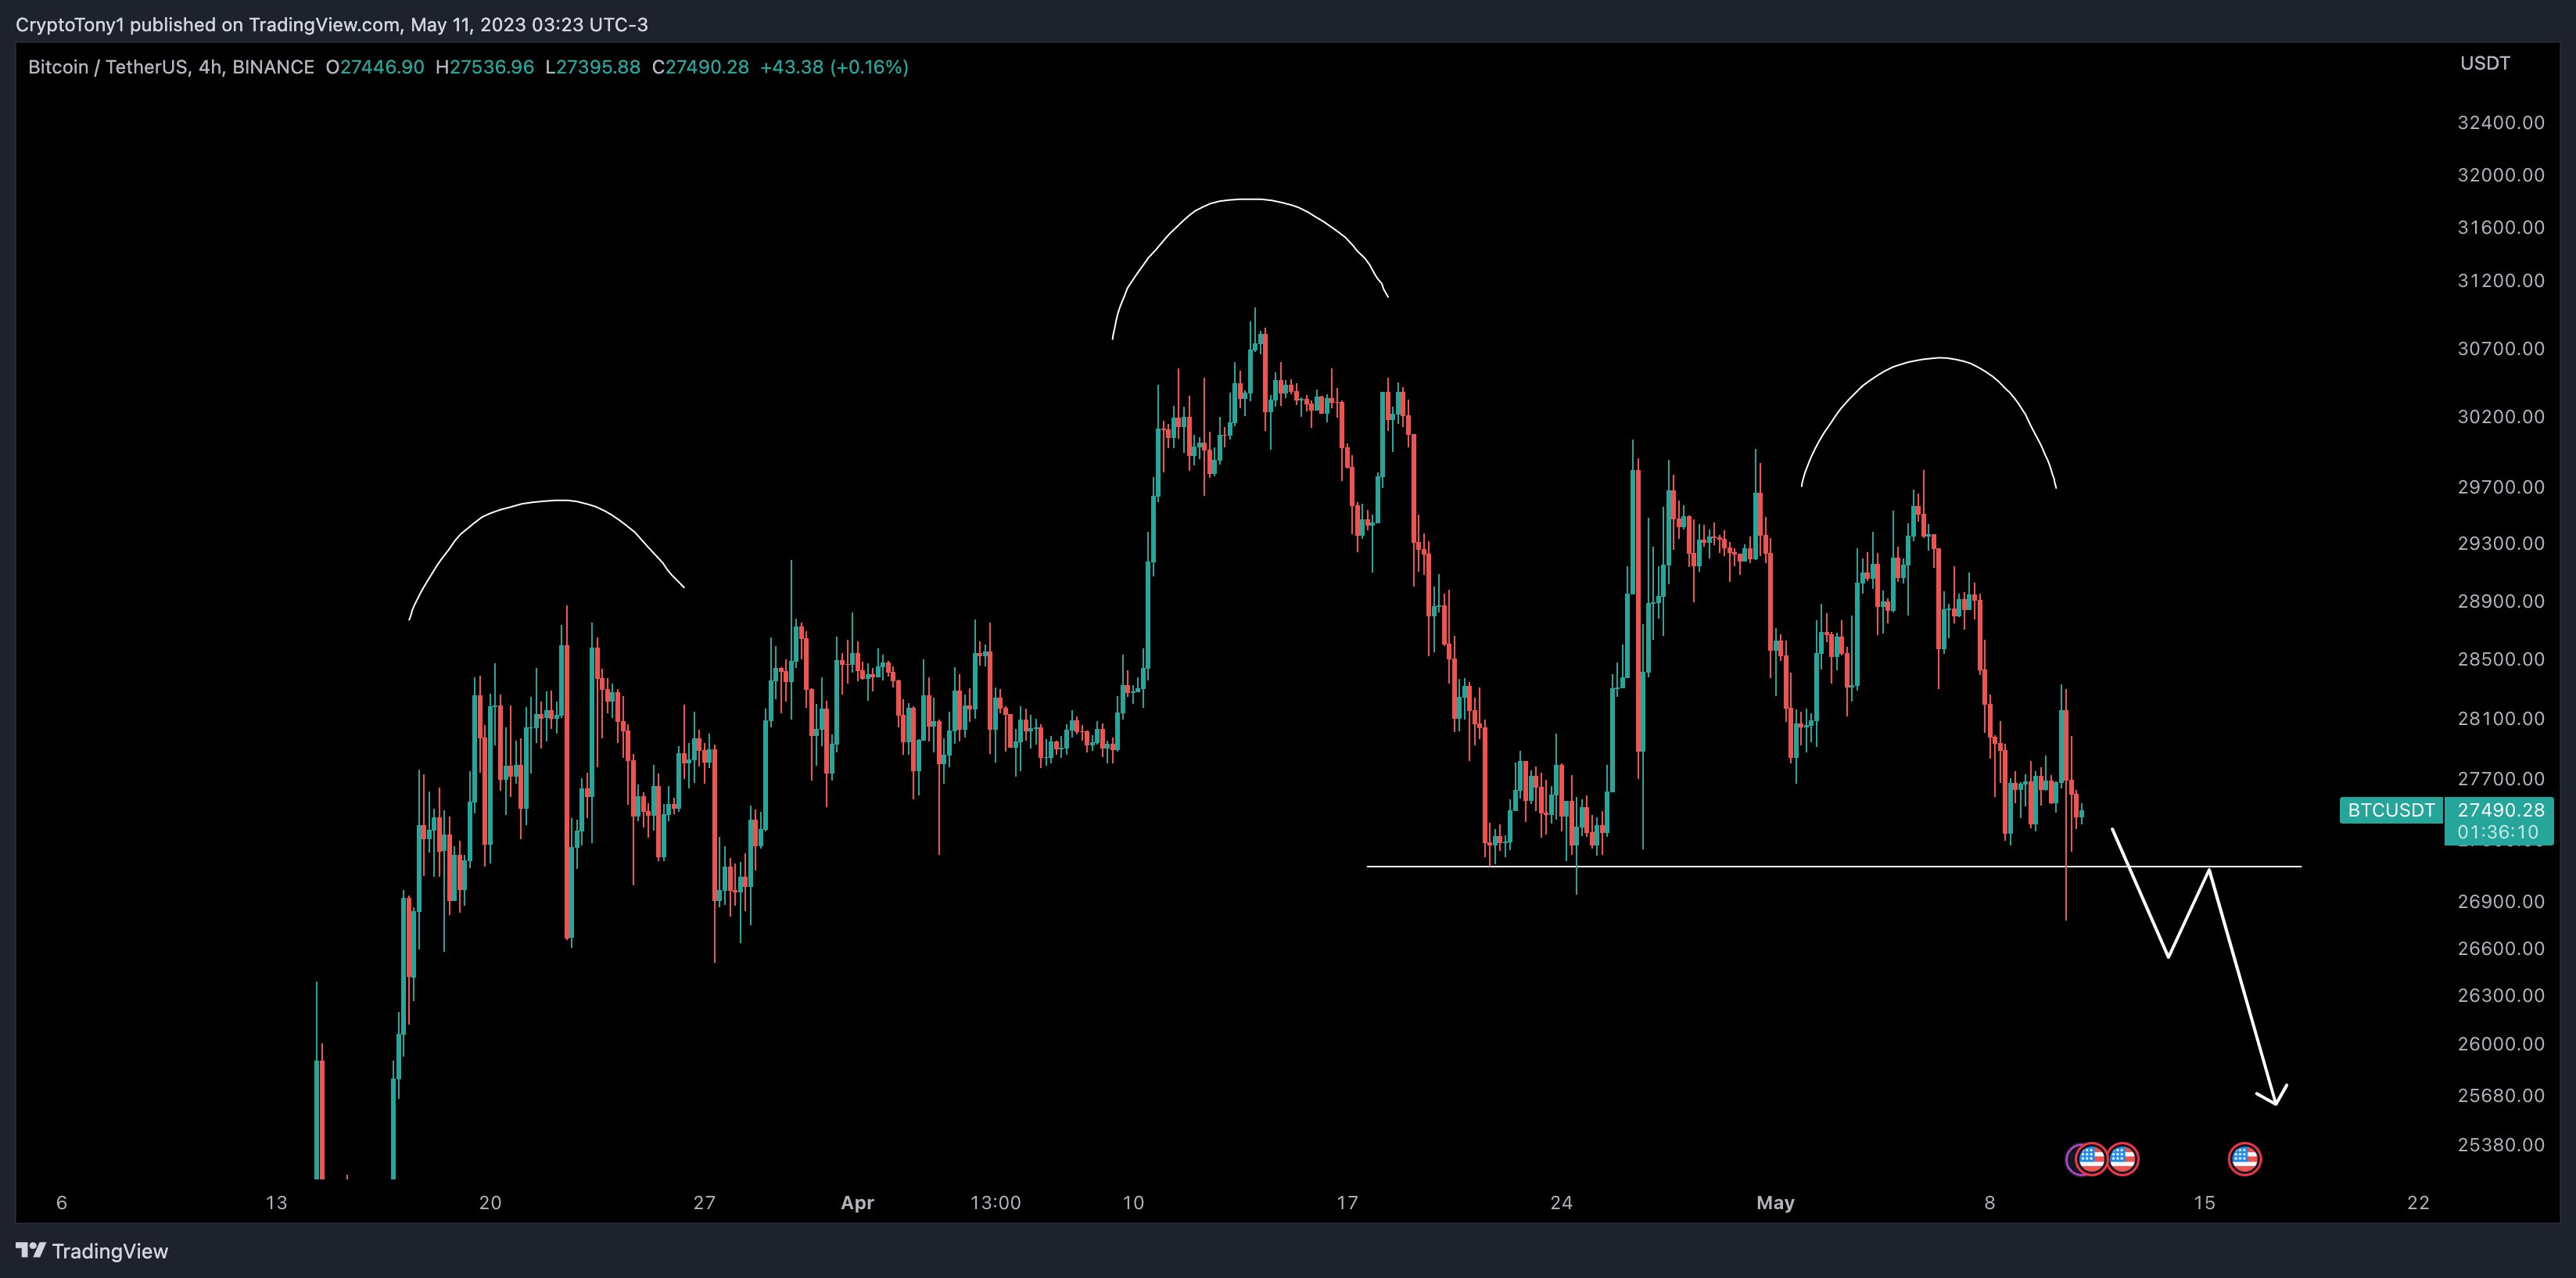 BTC/USD annotated chart. Source: Crypto Tony/ Twitter
Among the optimistic voices of the day was trader and analyst Moustache, who, in a positive analysis, highlighted longer-term price trends.
Specifically, two moving averages, the 20-week and 200-week, were on the verge of forming a “golden cross” – reversing their interaction from September 2022, months before Bitcoin’s most recent cycle low.
Related Posts
“In September 2022, there was a bearish cross of the SMA 20/200 line for the first time on record. This provided many individuals the chance to purchase $BTC at approximately 15k,” Moustache elaborated.
“And now? The SMA 20/200 is about to cross bullishly. Price above blue = Always bullish (see ’15, ’19).”
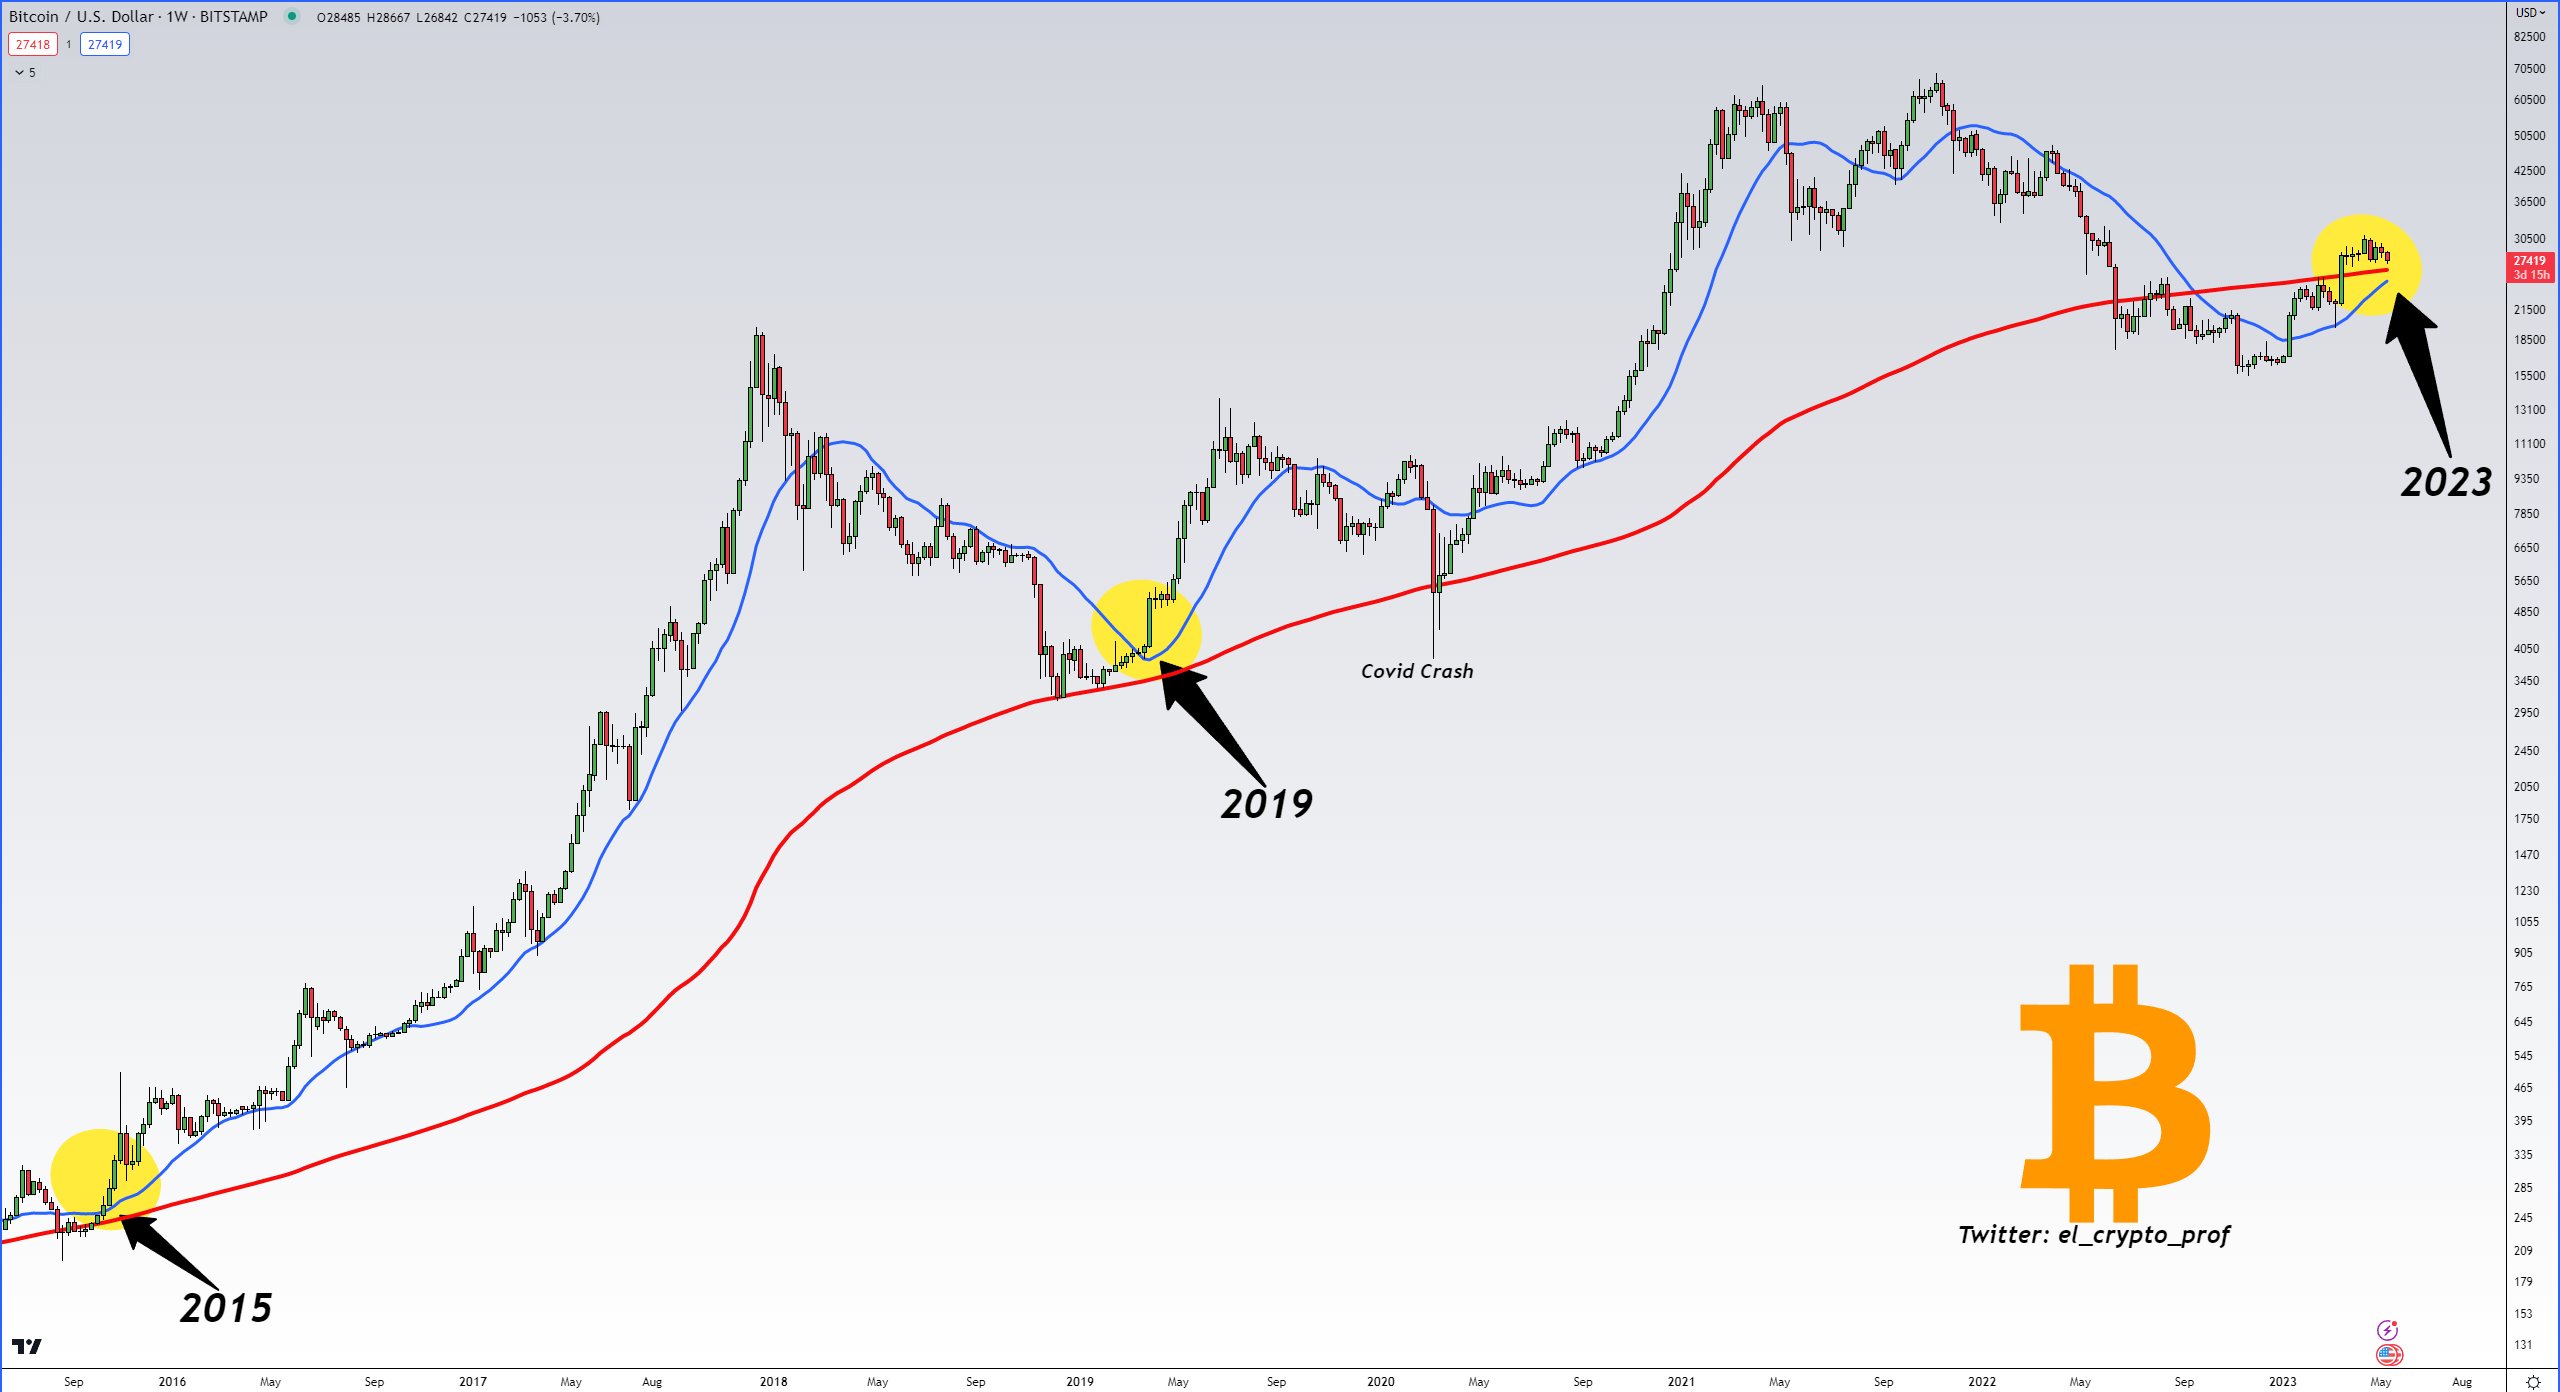 BTC/USD annotated chart. Source: Moustache/ Twitter
U.S. data joins CPI, delivering a fresh blow to inflation
On the macro front, positive U.S. Producer Price Index (PPI) and unemployment data provided crypto investors with a reason for cautious optimism.
Related: Bitcoin trader eyes $63K BTC price for new Bollinger Bands ‘breakout’
Jobless claims increased on the day, while PPI aligned with expectations of inflation continuing to decline.
Alongside similar indications from the Consumer Price Index (CPI) the previous day, the likelihood of interest rates remaining unchanged in June appeared to increase, financial commentator Tedtalksmacro noted.
“US unemployment claims rose to +264k and PPI in line with consensus on the headline + core prints. More data supportive of a pause in June,” he tweeted.
A subsequent post asserted that “Today’s US PPI figures reinforce that the path of least resistance for CPI inflation is downward.”
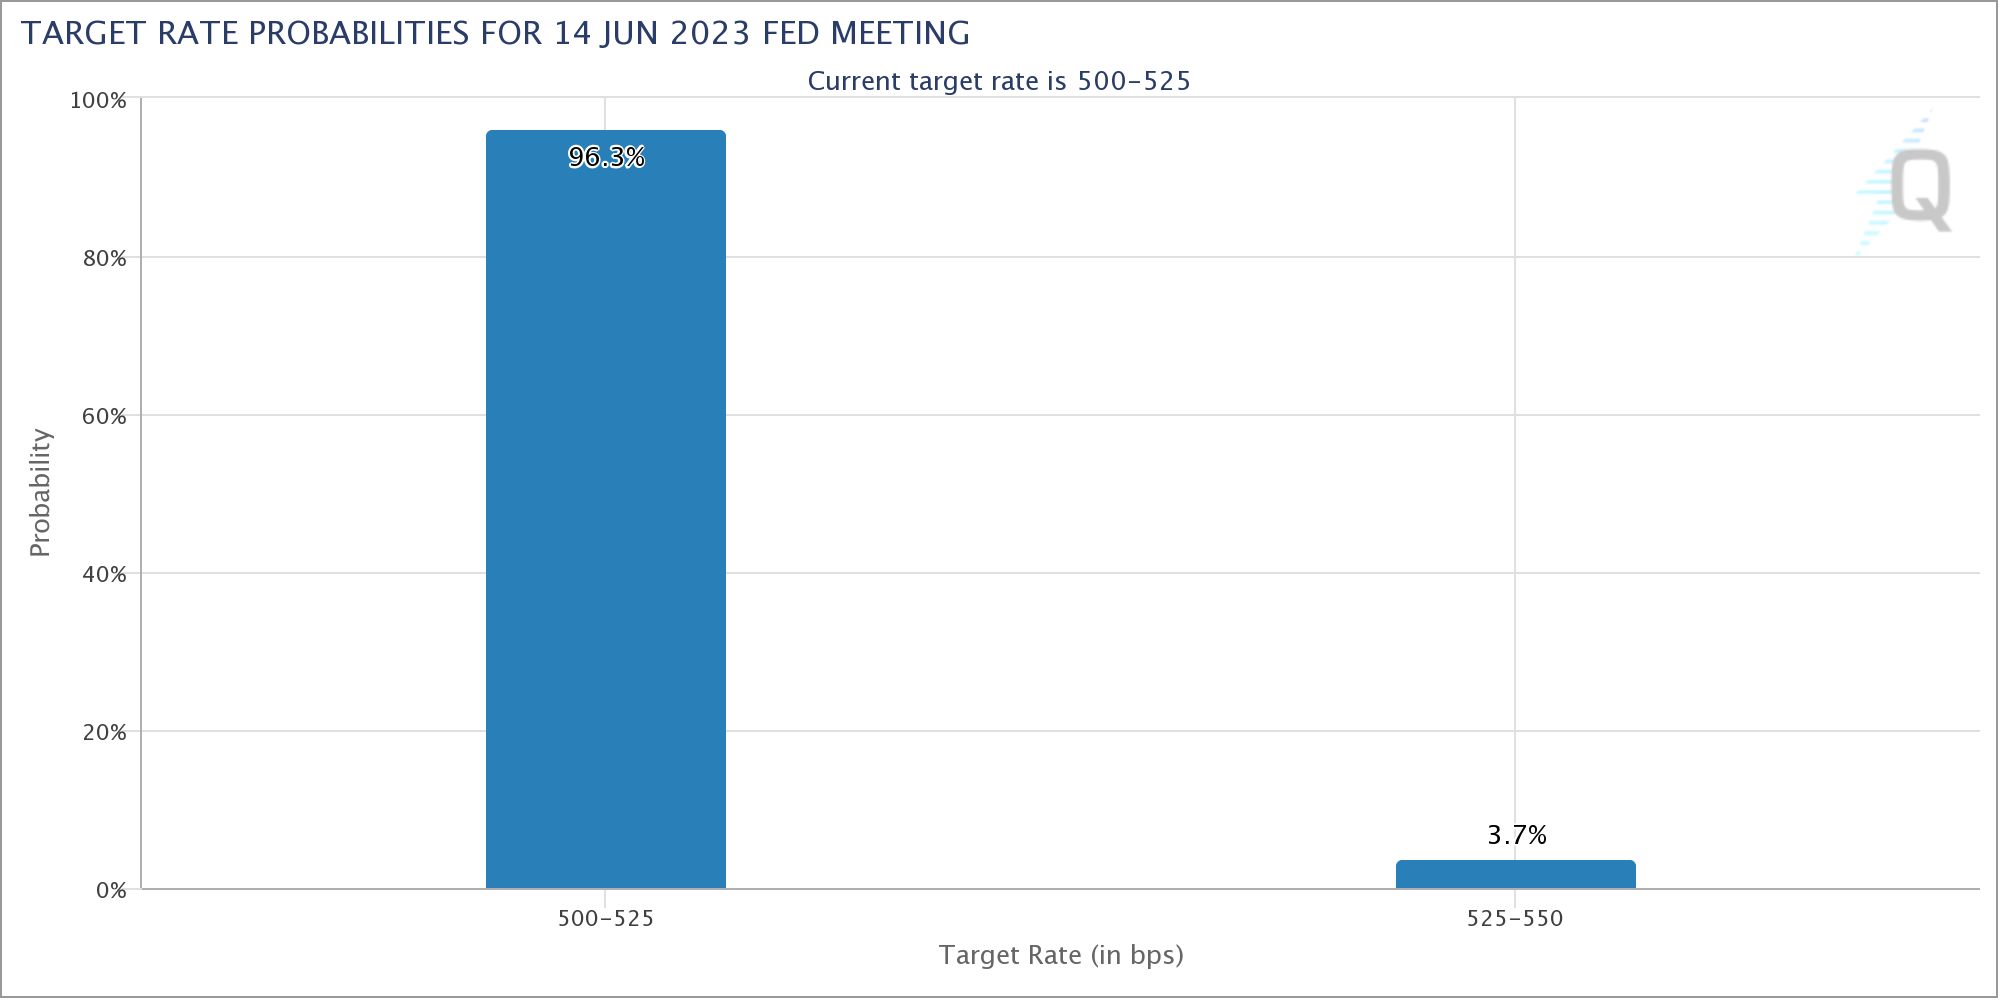 Fed target rate probabilities chart. Source: CME Group
The latest data from CME Group’s FedWatch Tool indicated market consensus for a pause in the June rate hike at over 96%.
Magazine: Unstablecoins: Depegging, bank runs and other risks loom
This article does not contain investment advice or recommendations. Every investment and trading move involves risk, and readers should conduct their own research when making a decision.