Disclaimer: Information found on CryptoreNews is those of writers quoted. It does not represent the opinions of CryptoreNews on whether to sell, buy or hold any investments. You are advised to conduct your own research before making any investment decisions. Use provided information at your own risk.
CryptoreNews covers fintech, blockchain and Bitcoin bringing you the latest crypto news and analyses on the future of money.
On September 15, Bitcoin (BTC) experienced a higher consolidation, with recent price movements being characterized as “textbook” by analysts.
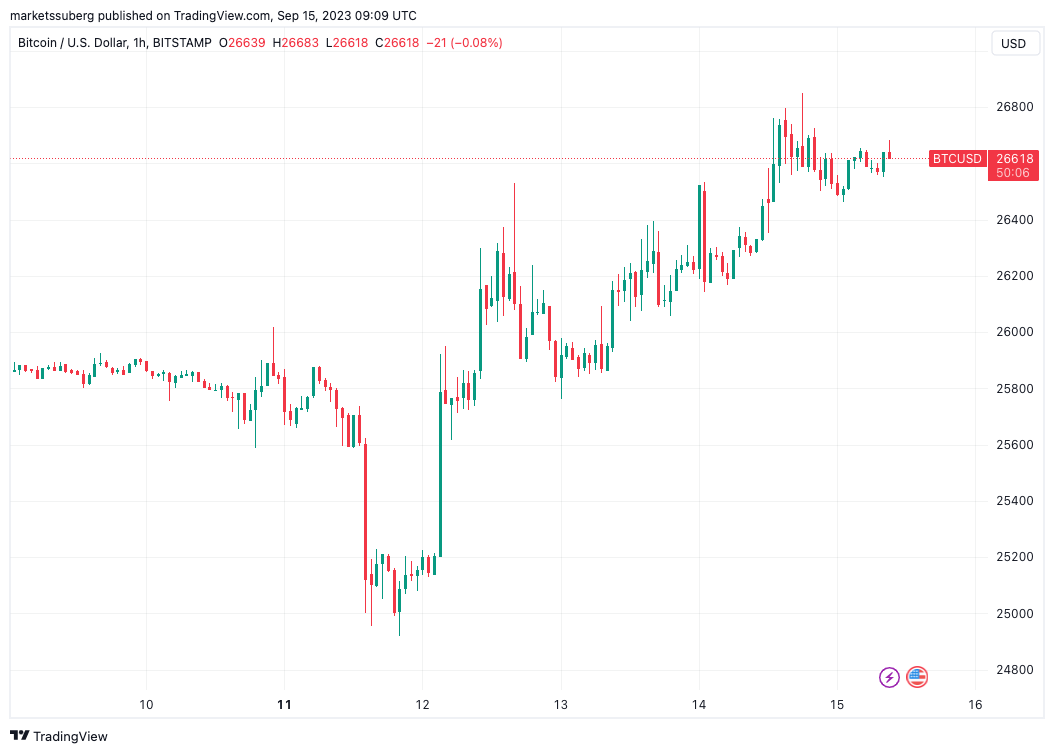 BTC/USD 1-hour chart. Source: TradingView
Analyst on Bitcoin: "September is not Rektember"
Data from Cointelegraph Markets Pro and TradingView indicated that the leading cryptocurrency was concentrating on $26,600, which is below a significant breakout threshold.
Bitcoin had dismissed the latest macroeconomic data reports from the United States the previous day, aligning with traditional markets in an upward trend despite indications that inflation was proving more persistent than anticipated.
With a renewed optimistic sentiment, Michaël van de Poppe, founder and CEO of trading firm Eight, expressed hope that BTC/USD would steer clear of new lows.
“Bitcoin may have the potential to trigger a bullish breakout, but we must ensure it does not retest the lows again,” he noted in a post on X (formerly Twitter) on September 14.
In light of news that Deutsche Bank, Germany’s largest lender, had sought a crypto custody license, Van de Poppe identified $25,000 as a crucial level for bulls to maintain market control.
“We’ve observed a sweep at $25,000 and should be sustaining higher numbers. In that scenario, we ought to hold $25,600-25,900, as falling below that could activate numerous stops before we witness any significant movements,” he proposed.
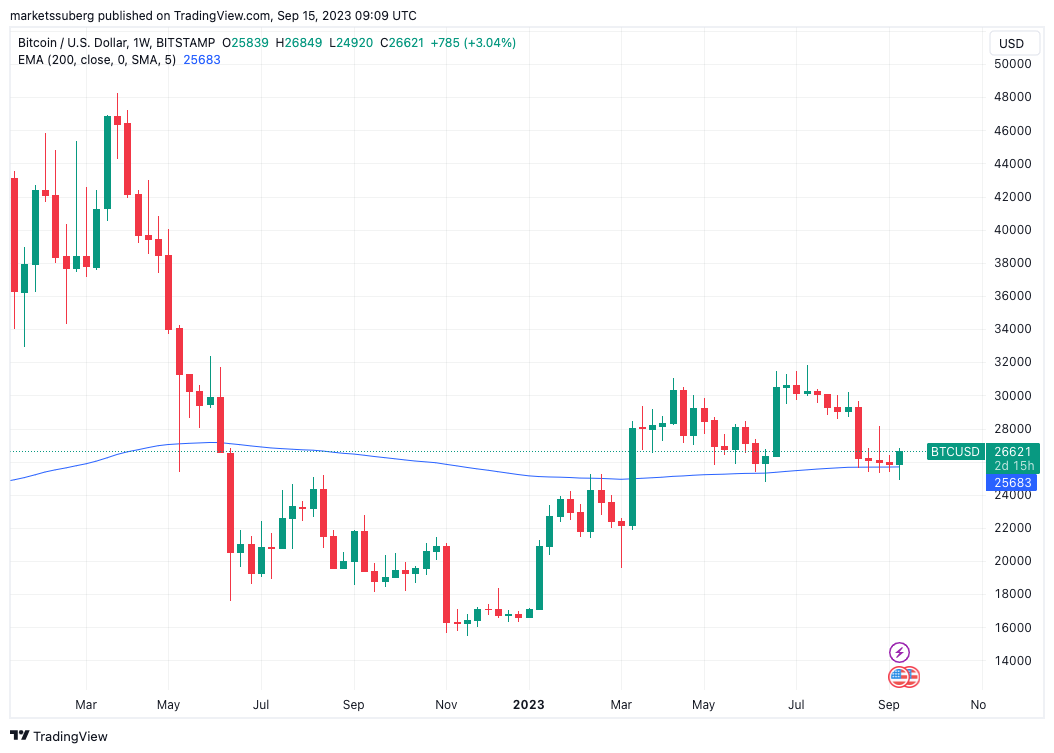 BTC/USD 1-week chart with 200EMA. Source: TradingView
Although remaining beneath a cluster of essential moving averages (MAs), the 200-week exponential moving average (EMA) continues to provide support, having been reclaimed in March and serving as a vital element at the onset of any bull market.
“I believe the likelihood of the low being established in this cycle has increased. Why? We are once again holding above the 200-Week EMA and will likely close above it again for this period,” Van de Poppe elaborated.
Related Posts
“September is not rektember and it appears we will have continuation from here.”
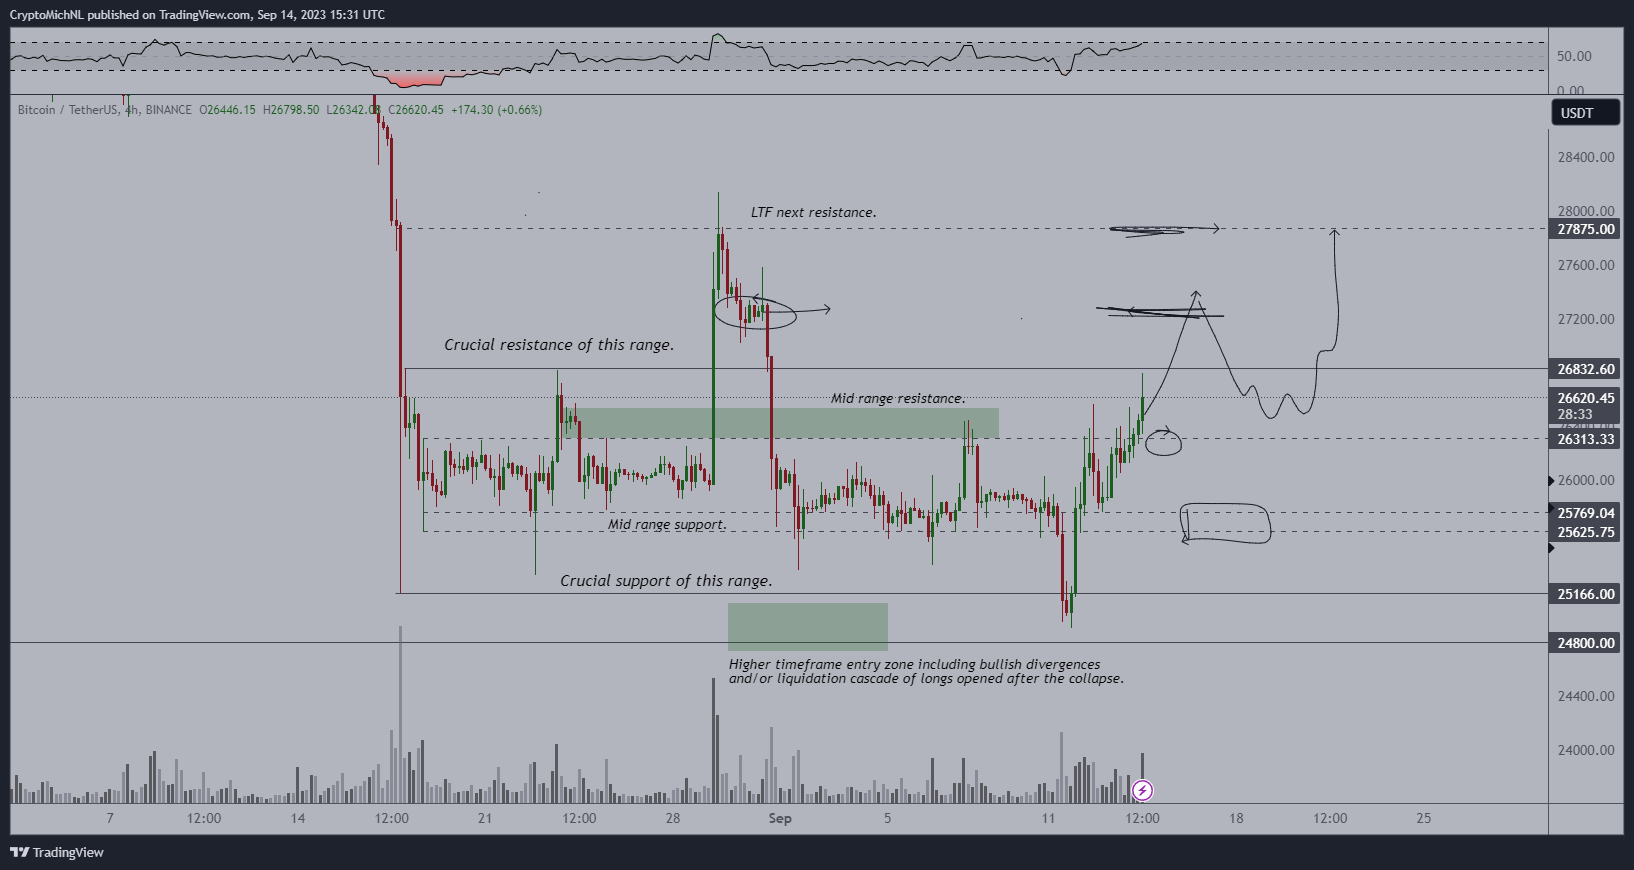 BTC/USD annotated chart. Source: Michaël van de Poppe/X
He pointed out $26,800 — the high from the previous day — as the critical level to surpass.
Wyckoff reveals classic BTC price rebound
Taking a positive long-term perspective, trading resource Stockmoney Lizards similarly concluded that further upside for BTC prices is anticipated.
Related: Bitcoin price can hit $46K by 2024 halving — Interview with Filbfilb
X analysis likened the price movements over the past year to an extended “accumulation” phase, utilizing the Wyckoff method.
This method outlines price cycles of an asset, and accurately identifying the trigger following a swing low, referred to as the “Spring” in Wyckoff, can indicate the onset of a new uptrend or a return to a prior higher trading range.
According to Stockmoney Lizards, the Spring occurred after BTC/USD reached its lowest point in late 2022.
“We have witnessed the spring in January, breakout at the end of March, and now the second throwback. Textbook Wyckoff behavior,” it remarked.
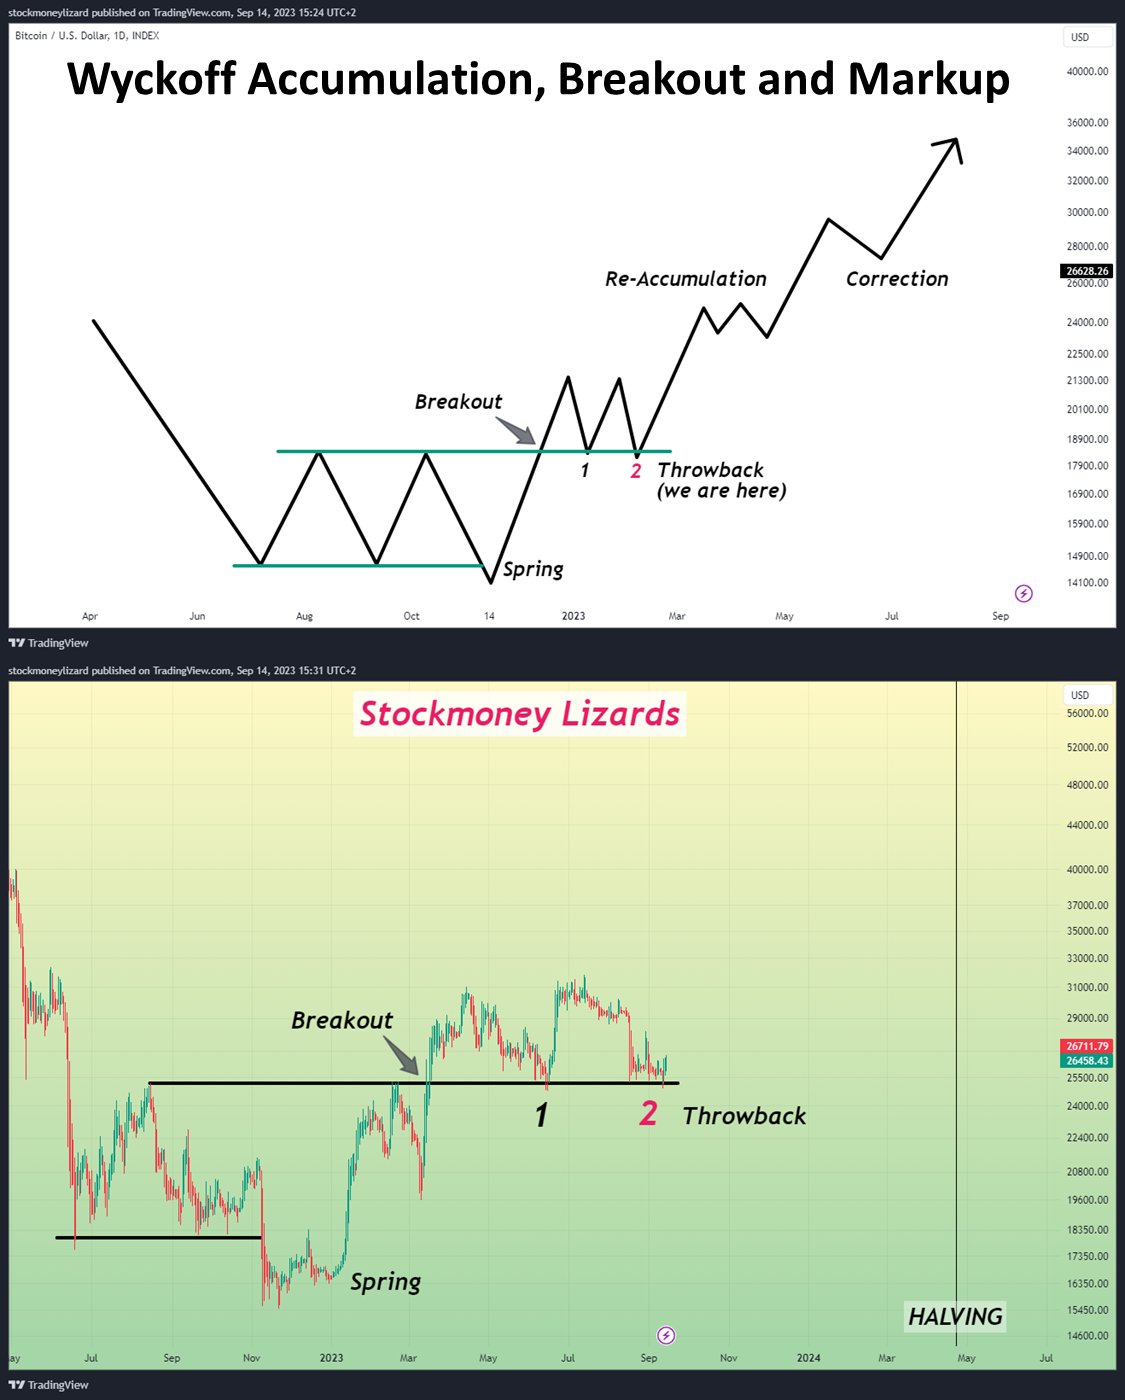 BTC/USD comparative chart. Source: Stockmoney Lizards/X
Collect this article as an NFT to preserve this moment in history and show your support for independent journalism in the crypto space.
This article does not contain investment advice or recommendations. Every investment and trading move involves risk, and readers should conduct their own research when making a decision.