Disclaimer: Information found on CryptoreNews is those of writers quoted. It does not represent the opinions of CryptoreNews on whether to sell, buy or hold any investments. You are advised to conduct your own research before making any investment decisions. Use provided information at your own risk.
CryptoreNews covers fintech, blockchain and Bitcoin bringing you the latest crypto news and analyses on the future of money.
Bitcoin’s price movements are starting to resemble the pre-bull market cycle of BTC from 2015 to 2017.
A recent analysis from the research firm Delphi Digital highlights the expected consistency of price movements and trends within the cryptocurrency market. The report explores the relationship between the four-year Bitcoin (BTC) cycle and wider economic trends.
Delphi Digital analysts indicate that the current consolidation around $30,000 resembles the phase from 2015 to 2017, with indicators suggesting a potential all-time high (ATH) for Bitcoin by the fourth quarter of 2024.
Impact of the economic cycle on Bitcoin’s performance
Delphi’s examination emphasizes the cyclical characteristics inherent in the cryptocurrency market. This cyclicality is illustrated by the intervals between peak-to-trough lows, recovery phases to previous cycle highs, and the timing of price surges to new cycle peaks. Using Bitcoin as a reference point, Delphi delineates the general framework of a cryptocurrency market cycle.
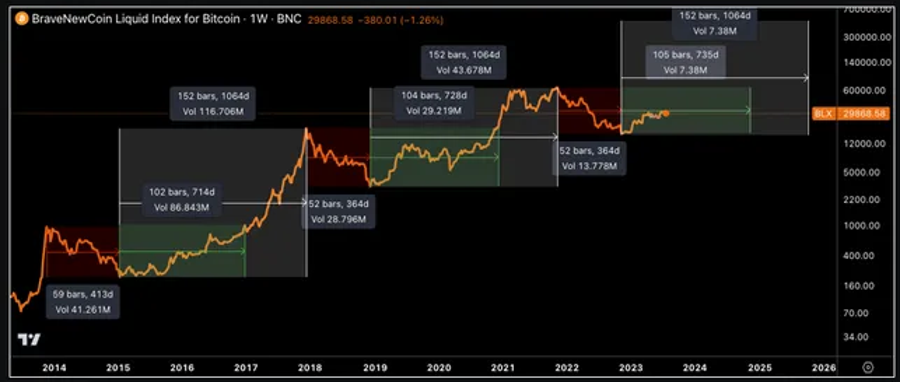 Bitcoin price in USD (log scale) reflecting four-year cycles. Source: Delphi Digital
These four-year cycles typically involve Bitcoin reaching a new ATH, undergoing an approximate 80% drawdown, followed by a bottom approximately one year later. This is generally succeeded by a two-year recovery to previous highs and, ultimately, a price surge for another year leading to a new all-time high.
The research uncovers an intriguing correlation between Bitcoin price peaks and fluctuations in the business cycle, as indicated by the ISM Manufacturing Index.
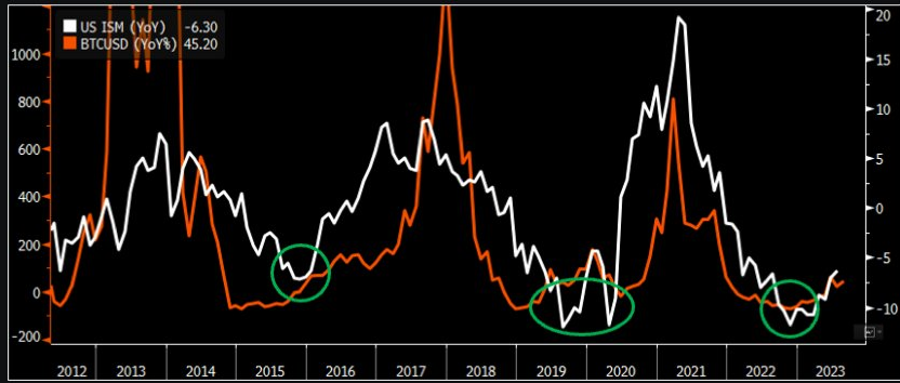 Bitcoin/USD year-over-year (orange) vs. U.S. ISM Manufacturing Index year-over-year (white). Source: Delphi Digital
At the time of Bitcoin’s price peaks, the ISM frequently shows signs of reaching a peak, while active addresses, transaction volumes, and fees hit their highest levels. In contrast, as the business cycle indicates recovery, network activity levels also rise.
The report highlights the significance of the Bitcoin halving within these cycles. The last two halvings occurred roughly 18 months after BTC reached its bottom and about seven months prior to a new ATH. This historical trend suggests a projected new ATH for Bitcoin by the fourth quarter of 2024, coinciding with the anticipated timing of the next halving.
Bitcoin price action resembles the pre-bull run phase of 2015-2017
Related Posts
The report further indicates that the current market conditions exhibit notable similarities to the timeframe between 2015 and 2017. The alignment of market behavior, economic indicators, and historical trends suggests that the present phase is comparable to a period of heightened risk exposure and potential growth, similar to that experienced during that time.
The report observes that the market’s trading patterns, particularly in the S&P 500, closely mirror the trajectory seen during 2015-2017. Even amidst uncertainty, such as an earnings recession, these patterns continue, reflecting the sentiment of that era.
The consistent nature of Bitcoin’s cycle, its alignment with broader economic transitions, and the forthcoming halving in 2024 all support this thesis.
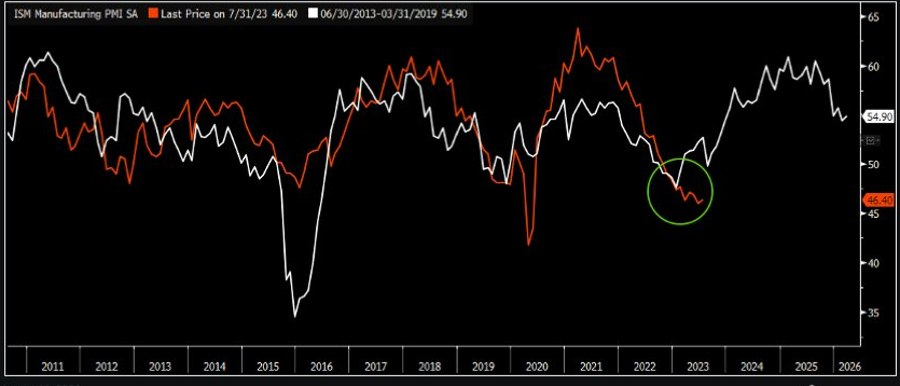 U.S. ISM Manufacturing Index, current (orange) vs. 2013-2019 cycle (white). Source: Delphi Digital
Delphi draws comparisons between the dismal global growth outlook of 2015-2016 and the recent economic uncertainty of 2021-2022. Factors such as the strength of the U.S. dollar and shifts in global liquidity cycles resonate with the past.
The report underscores how gold’s performance during that period, influenced by concerns over currency debasement, shows remarkable parallels to the current situation. These similarities reinforce the notion that macroeconomic conditions are following a familiar path.
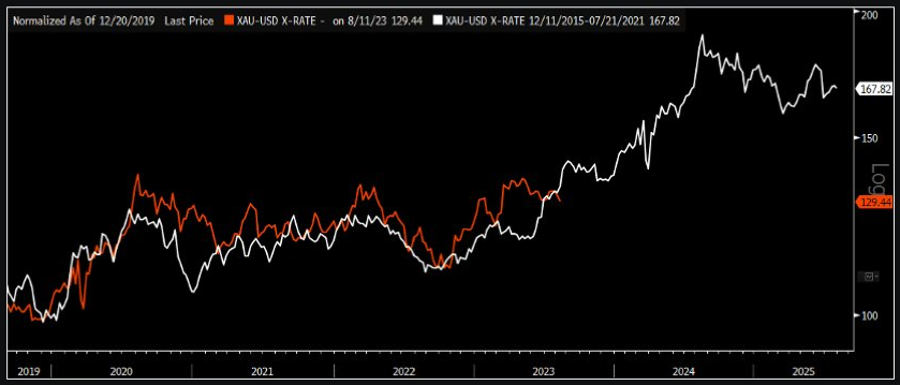 Gold price in USD (log scale), current (orange) vs. 2015-2019 cycle (white). Source: Delphi Digital
Related: Is Bitcoin’s record-low volatility and decline in short-term holders a bull market signal?
The crypto market reflects an optimistic outlook, with some cautionary signs
Delphi’s analysis offers persuasive evidence that the cryptocurrency market functions within cyclical patterns that reflect broader economic shifts. The report’s forecast of a new all-time high by the fourth quarter of 2024 aligns with historical halving trends. This timing, along with the status of indicators like the ISM and expectations of renewed liquidity cycles, bolsters the case for a cycle similar to that observed in 2015-2017.
The upcoming Bitcoin halving in 2024 further supports the firm’s expectations of a potential bull market by the fourth quarter of that year. While the analysis acknowledges certain risks and uncertainties, the overall outlook for the cryptocurrency market in the next 12-18 months appears favorable, given the accumulating catalysts and historical context.
This article is for general informational purposes and is not intended to be and should not be construed as legal or investment advice. The views, thoughts, and opinions expressed here are solely those of the author and do not necessarily reflect or represent the views and opinions of Cointelegraph.