Disclaimer: Information found on CryptoreNews is those of writers quoted. It does not represent the opinions of CryptoreNews on whether to sell, buy or hold any investments. You are advised to conduct your own research before making any investment decisions. Use provided information at your own risk.
CryptoreNews covers fintech, blockchain and Bitcoin bringing you the latest crypto news and analyses on the future of money.
Bitcoin’s decline to $60,000 signaled a warning for stocks, which are now experiencing a similar trend.
Bitcoin has once again served as a primary indicator for risk assets, experiencing a significant decline prior to the current global stock market downturn.
 BTC crashed first early this year. Now stocks follow. (Bernd 📷 Dittrich/Unsplash)
What to know:
- Bitcoin has once again served as a primary indicator for risk assets, experiencing a significant decline prior to the current global stock market downturn.
- Key equity indices, including the S&P 500, SPDR Financial Select Sector ETF, and India’s Nifty index, reflect bitcoin’s pre-decline price movements.
- Historical trends, such as those seen in 2017, prior to the COVID crash, and late 2021, indicate that bitcoin frequently reaches its peak ahead of the S&P 500.
Many consider bitcoin as a safe-haven and store-of-value asset, akin to gold. However, some currency traders view it as an initial indicator for overall market sentiment, a perspective that has proven accurate once more: Bitcoin sharply declined before stabilizing around $70,000 recently, foreshadowing the current global stock market downturn.
Bitcoin’s value reached above $126,000 in early October and subsequently declined, eventually dropping to around $60,000 at the beginning of last month. This sell-off was accompanied by rapid outflows from U.S.-listed spot ETFs. CoinDesk highlighted this situation in January, questioning whether these outflows—without any evident crypto catalyst—indicated an impending macroeconomic disruption and stock market sell-off.
As we look at the present situation: Global market sentiment has deteriorated, influenced by the Iran conflict and rising oil prices, impacting Asian and European indices heavily. The S&P 500 and Nasdaq have also faced downward pressure while the dollar index has strengthened. Meanwhile, bitcoin has remained consistently around $70,000.
Interestingly, significant stock indices such as the S&P 500 have reflected Bitcoin’s pre-decline fluctuations within a broad trading range.
Related Posts
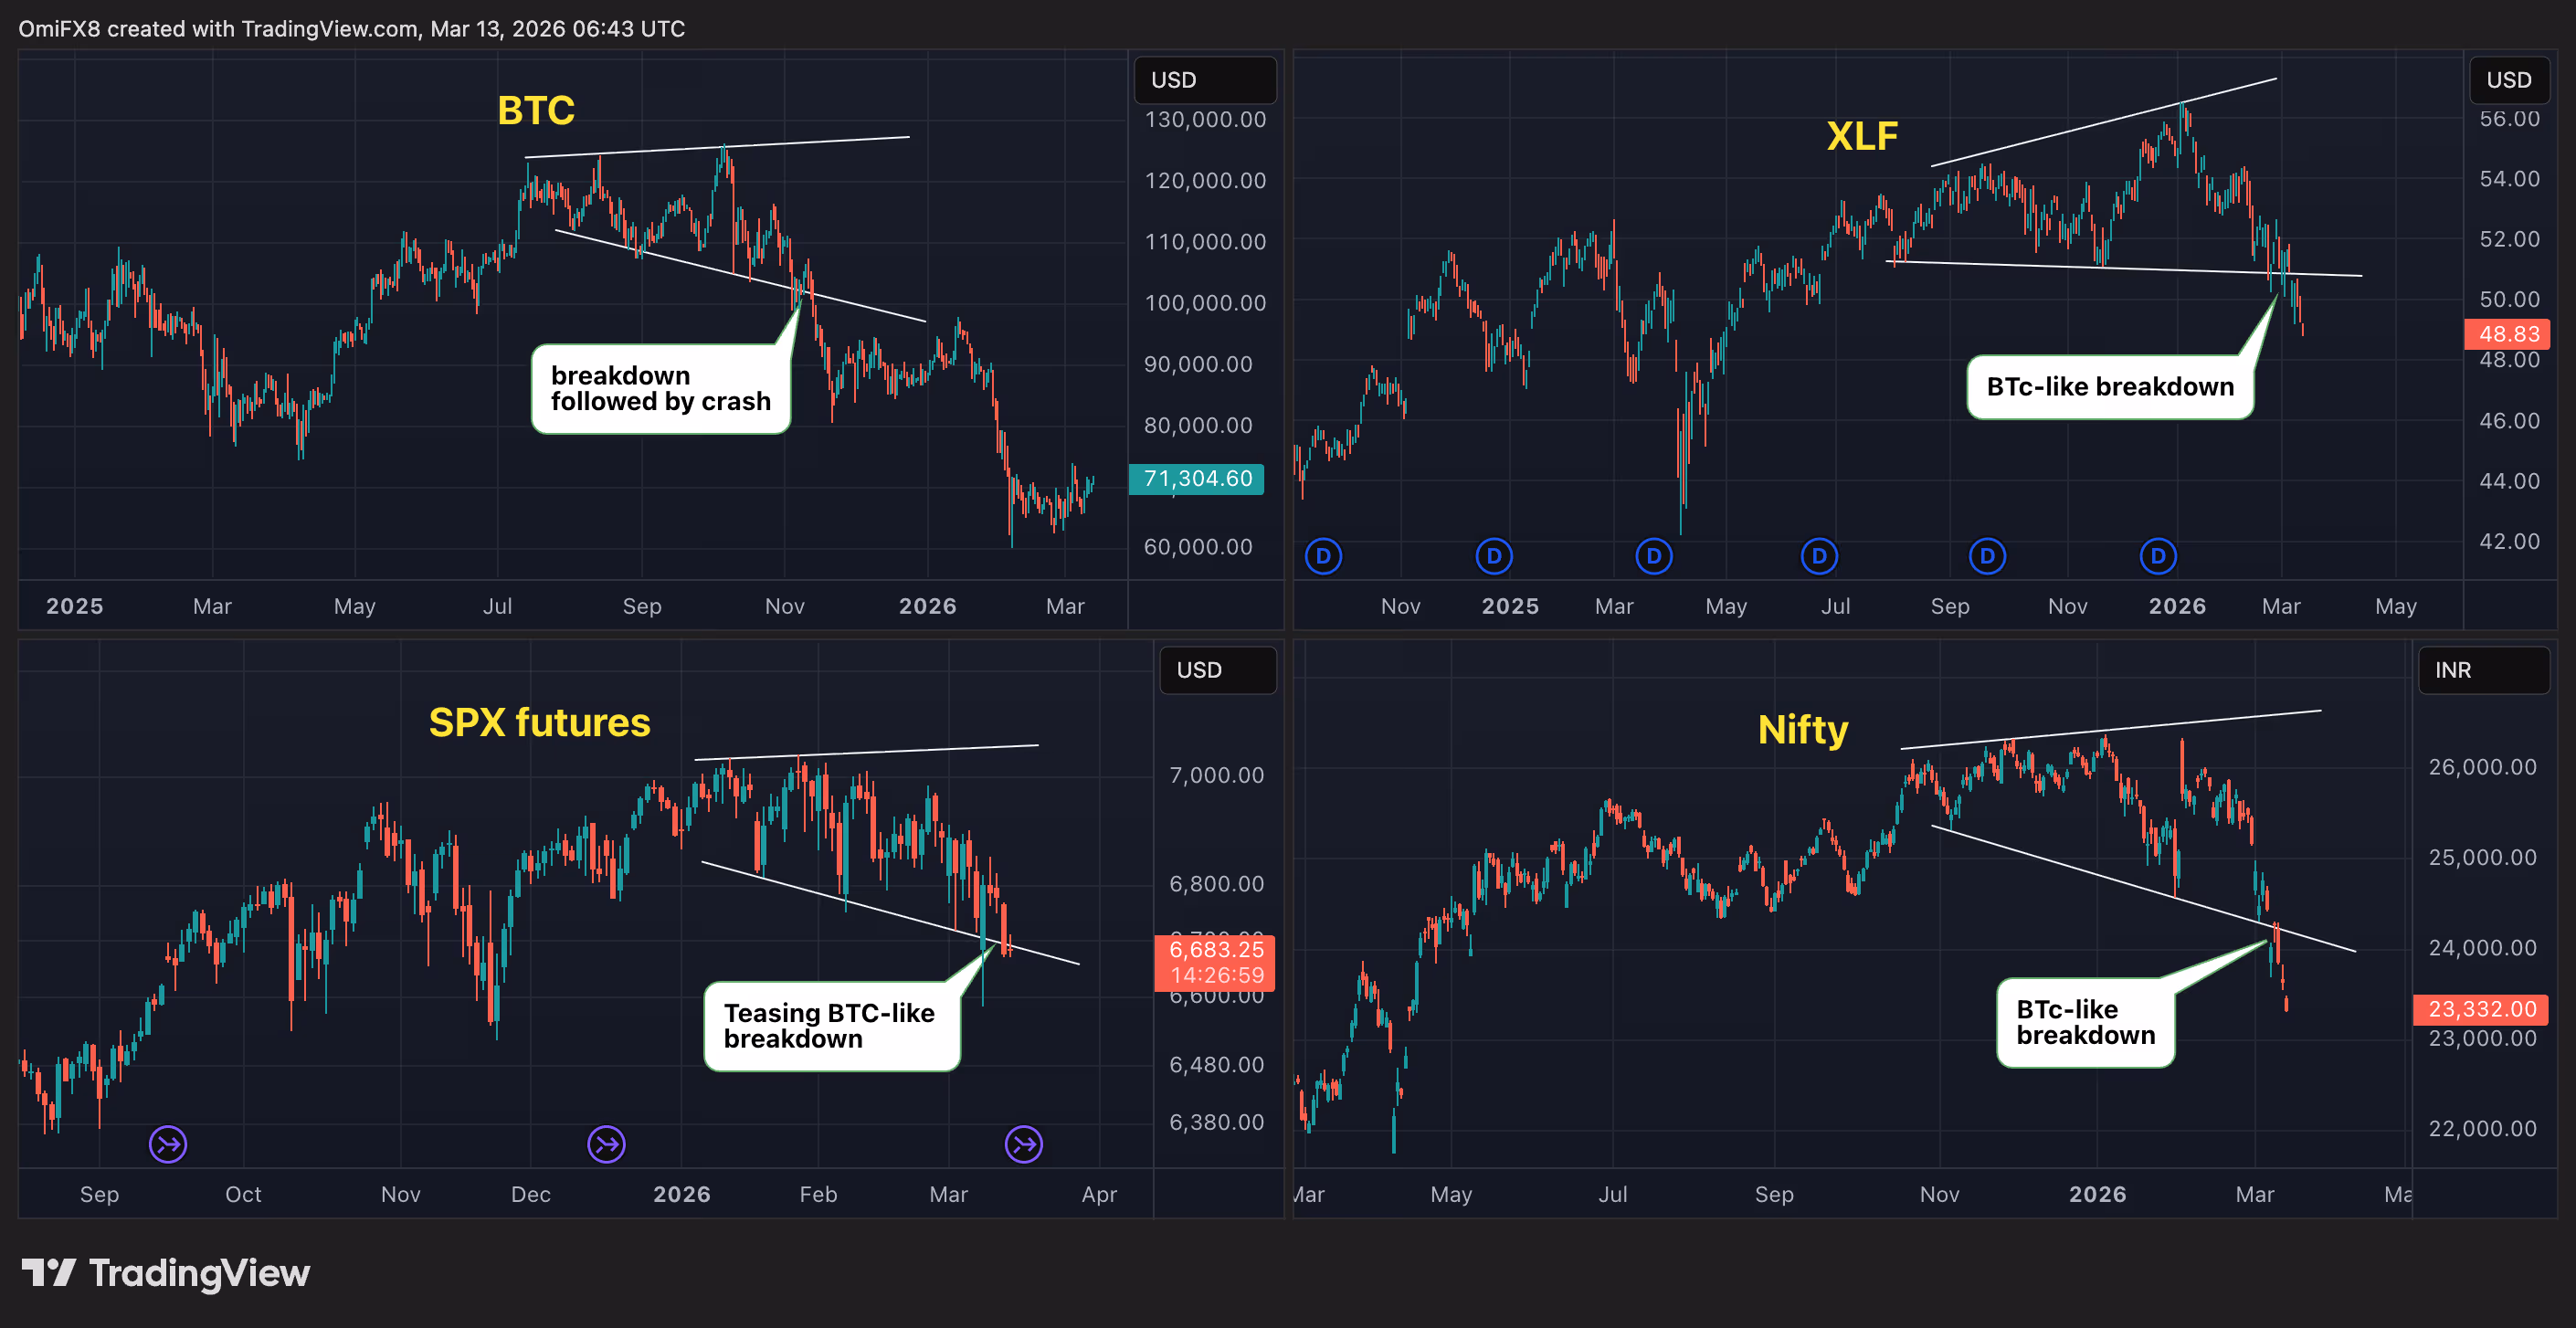 Daily charts for BTC, SPX futures, XLF and Nifty. (TradingView)
Bitcoin maintained a position above $100,000 for several months within this unstable, expanding channel before dropping into a bear market. A similar scenario has emerged in the SPDR Financial Select Sector ETF (XLF), India’s Nifty (which has been particularly affected), and S&P 500 futures.
Repeat of 2021-22
This is not the first occasion bitcoin has influenced price movements in traditional risk assets. Throughout the years, the cryptocurrency has frequently anticipated equity trends, most notably in late 2021-2022.
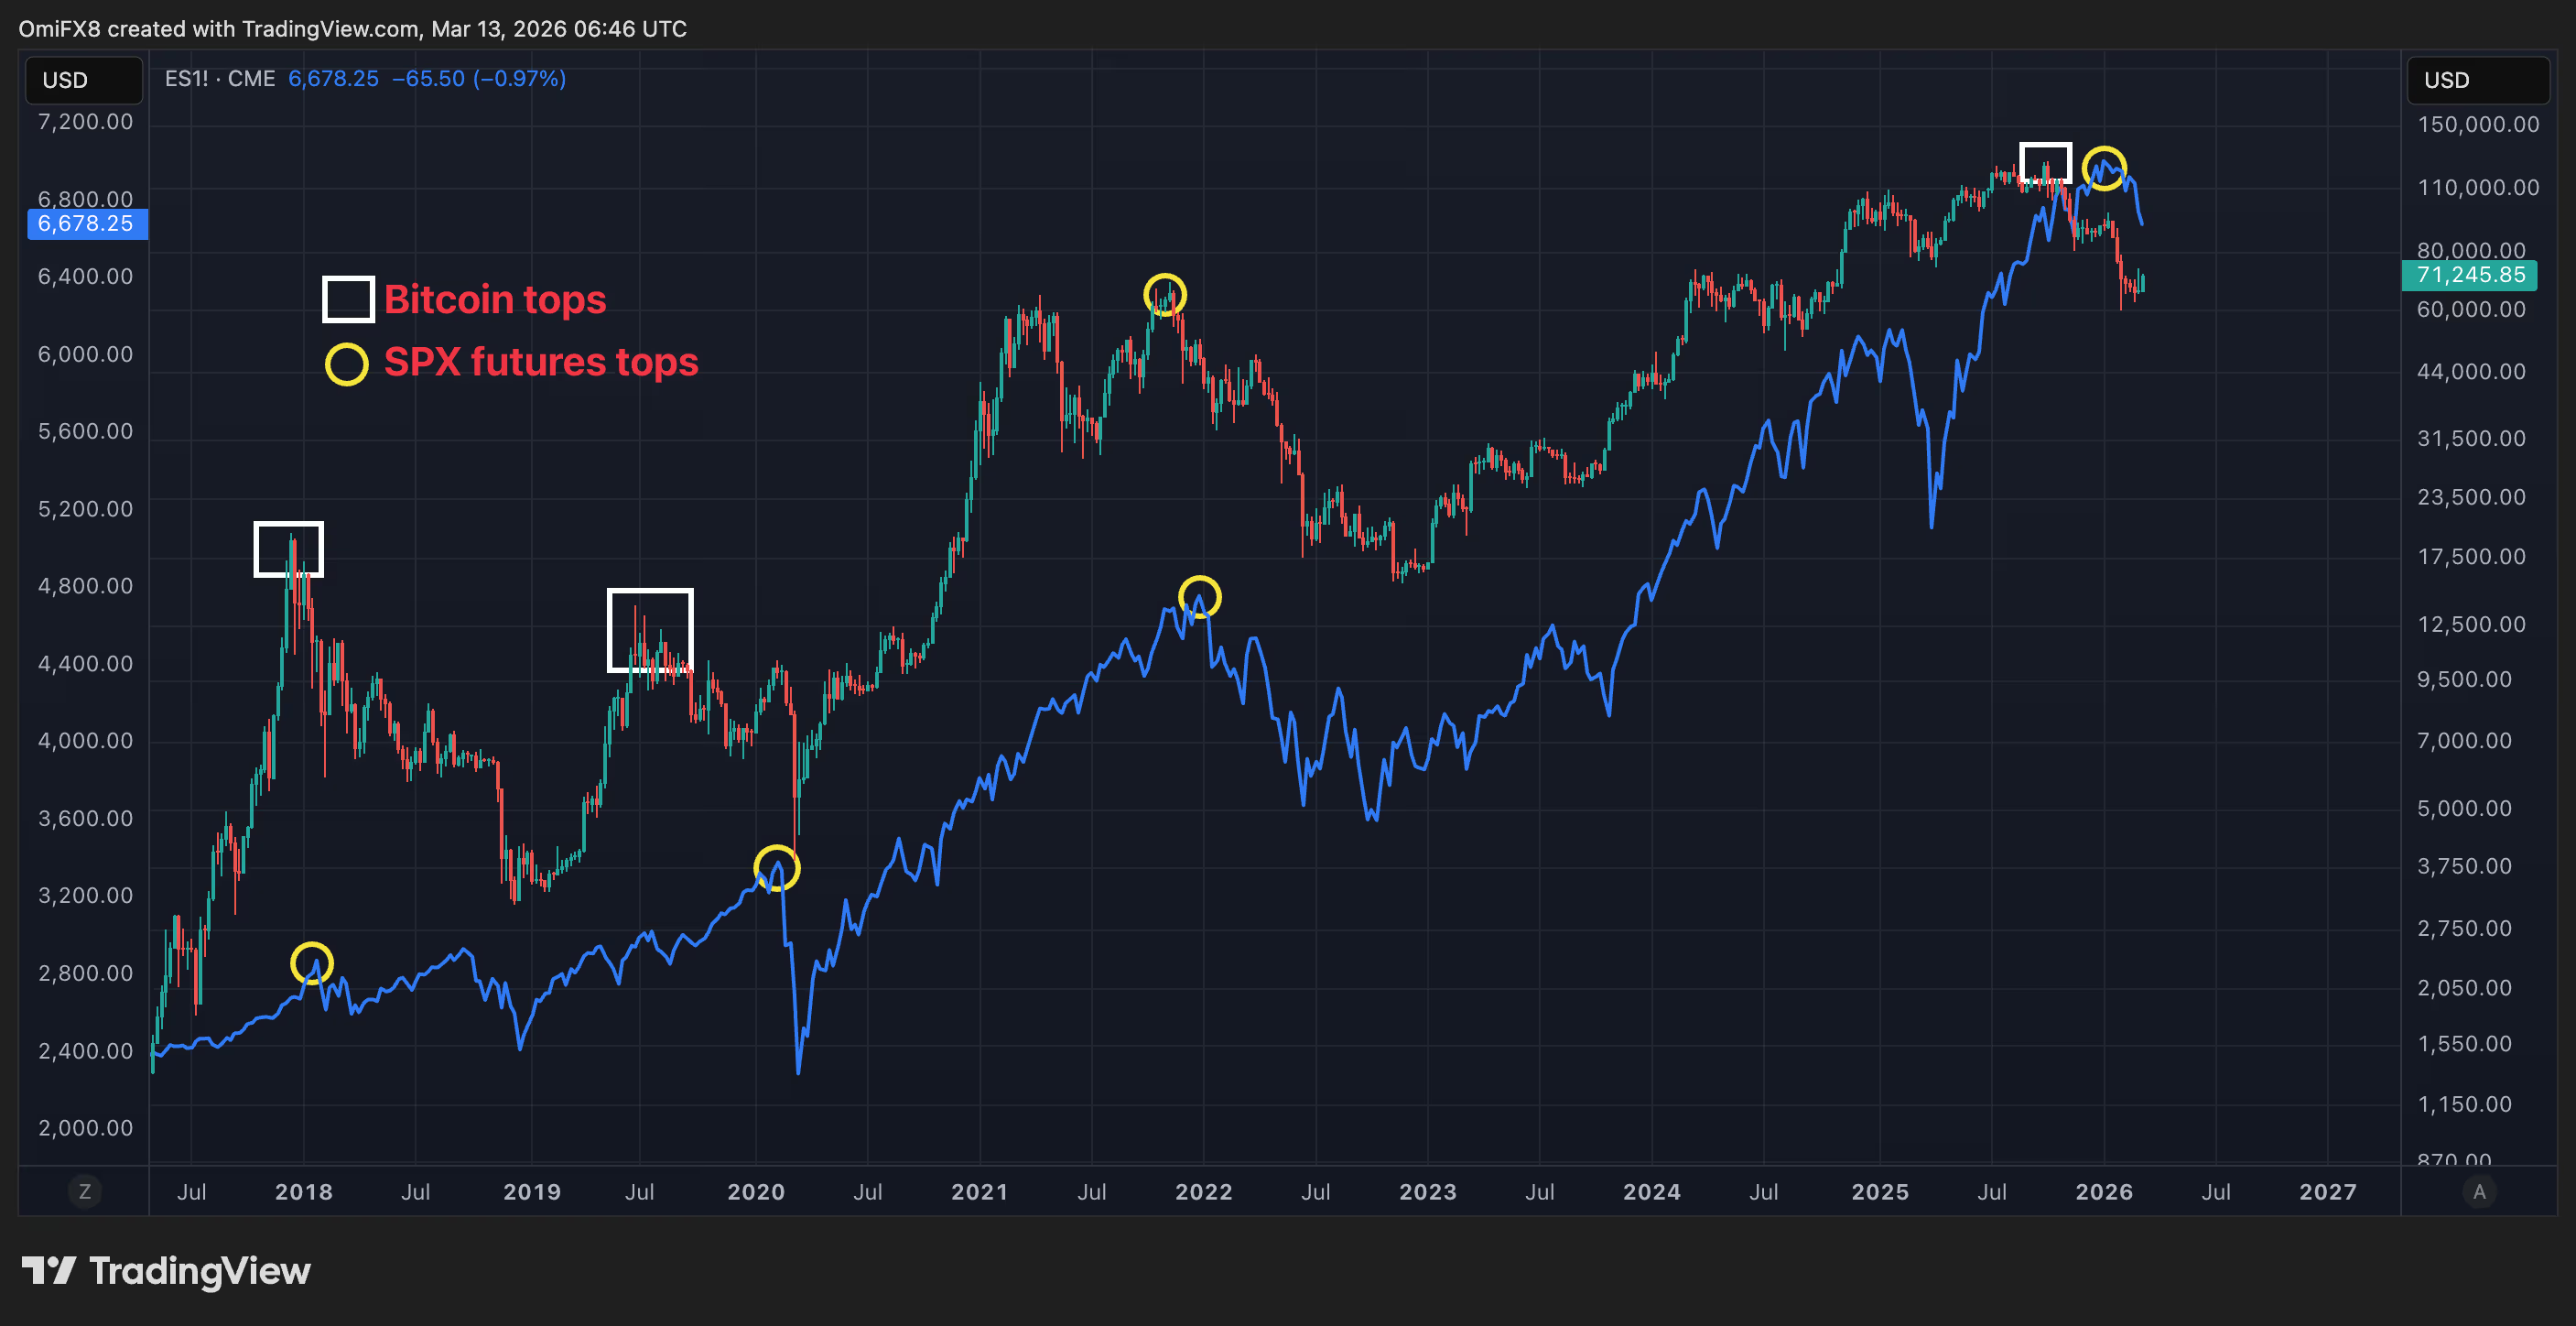 BTC versus S&P 500 e-mini futures. (TradingView)
BTC reached nearly $60,000 in November 2021 and swiftly dropped below $50,000 within a month. The bear market intensified in 2022. The Nasdaq and S&P 500 peaked two months later in January 2022, then mirrored this trend with their own extended downturns as the Federal Reserve rapidly increased interest rates.
Todd Stankiewicz, president and chief investment officer of SYKON Capital, in a blog entry on the Chartered Market Technical (CMT) Association website, observed bitcoin’s pattern of reaching peaks ahead of the S&P 500 in three significant instances: late 2017, shortly before the COVID crash, and late 2021.
“Bitcoin either rolled over or failed to reach new heights while the S&P 500 advanced. In each instance, the equity rally ultimately stalled and reversed,” Stankiewicz stated.
Overall, the conclusion is evident: Stock traders should closely monitor bitcoin trends moving forward.