Disclaimer: Information found on CryptoreNews is those of writers quoted. It does not represent the opinions of CryptoreNews on whether to sell, buy or hold any investments. You are advised to conduct your own research before making any investment decisions. Use provided information at your own risk.
CryptoreNews covers fintech, blockchain and Bitcoin bringing you the latest crypto news and analyses on the future of money.
Bitcoin (BTC) on-chain activity has reached levels not observed since before its ascent to the all-time highs of 2021, according to data.
In a post on X (formerly Twitter) dated Aug. 25, Ki Young Ju, the CEO of analytics platform CryptoQuant, highlighted that Bitcoin velocity has hit multiyear lows.
Bitcoin supply remains stagnant at $26,000
Bitcoin is increasingly remaining static at its current price points — with a lack of overall BTC price movement for several months, the motivation to buy or sell has diminished.
This status is emphasized by velocity, which measures the movement of BTC units across the network.
As per CryptoQuant, on daily timeframes, this metric is now at levels last recorded in October 2020.
“There are two perspectives on this situation,” Ki noted.
“It can be interpreted as positive since whales are retaining their holdings, or negative as it is not being transferred to new investors.”
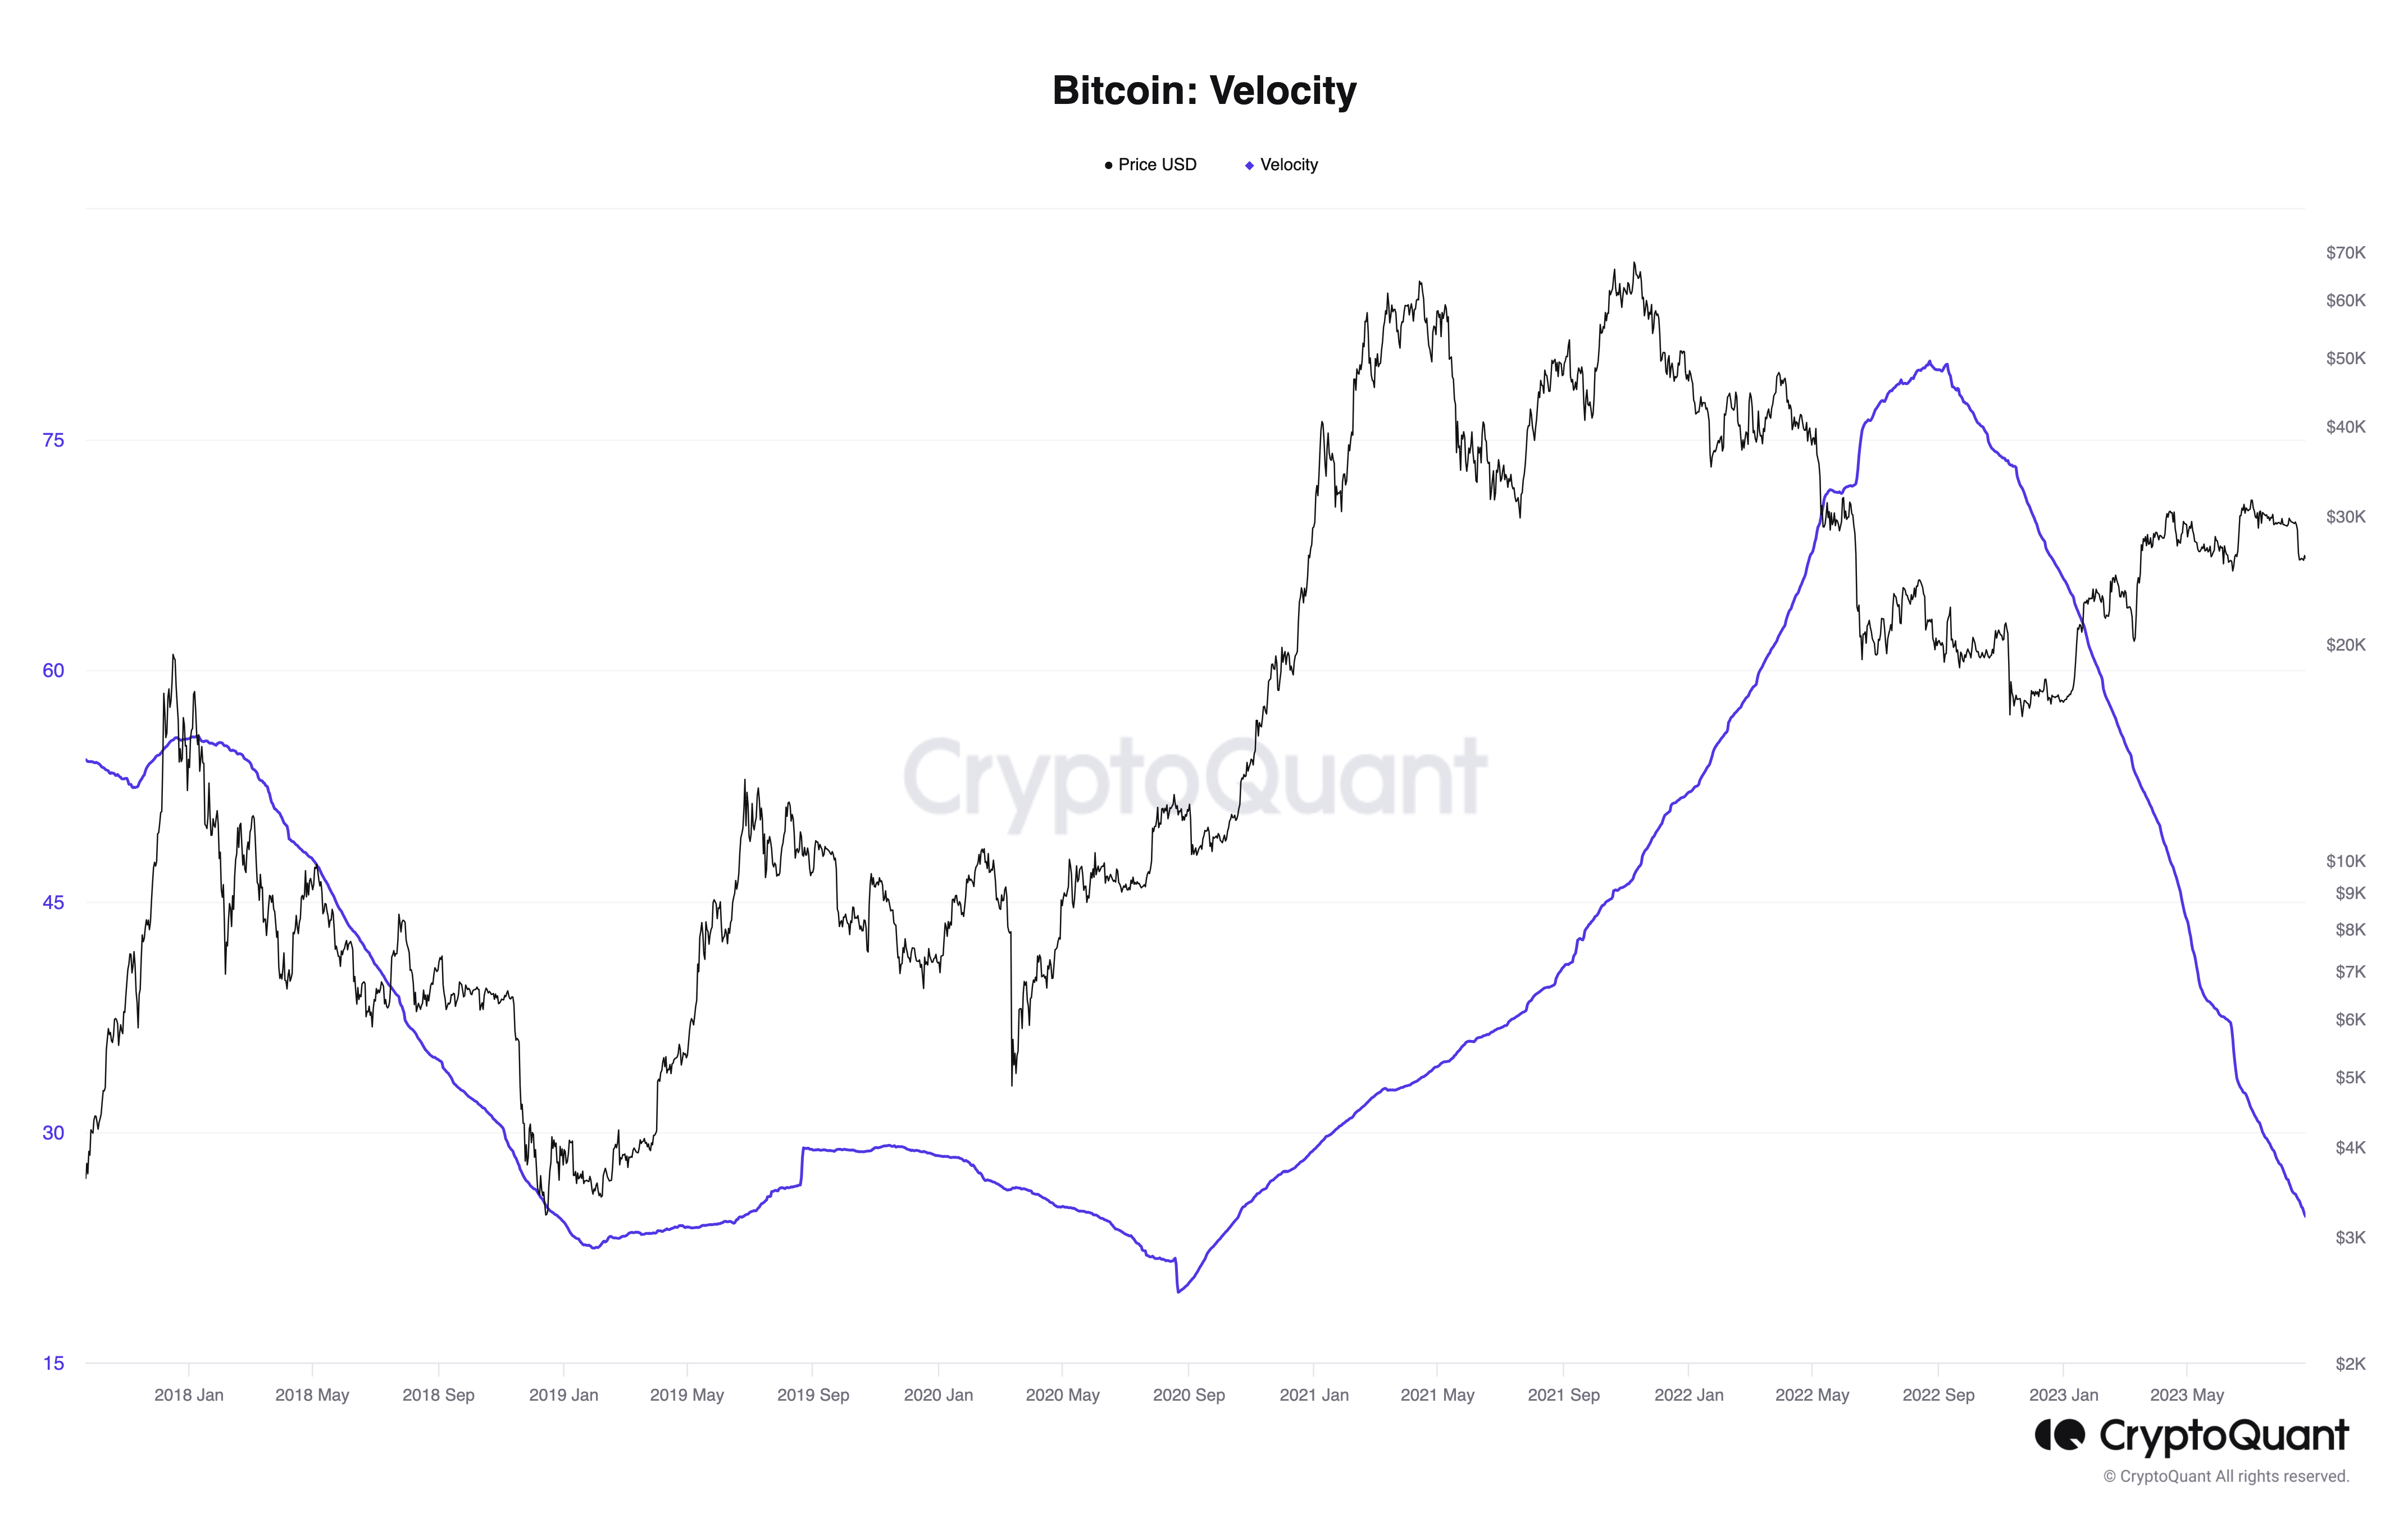 Bitcoin velocity chart. Source: CryptoQuant
Ki pointed out a similar lack of significant trading activity among high-volume investors — contributing to the narrative that the market is currently in a “wait and see” phase regarding BTC.
Related Posts
As reported by Cointelegraph, new capital entering the market was evident at the start of the year, as BTC/USD initiated its Q1 rally, which ultimately reached 70%.
“Oversold” RSI signal continues
The volume data also appears noteworthy for another reason.
Related: Wen moon? Bitcoin halving cycle hints at Q4 as smart money 'buys the rumor'
In late 2020, after establishing a long-term bottom, the rebound of this metric coincided with Bitcoin’s initial rise past $20,000 to new all-time highs a year later.
In contrast, Bitcoin currently seems broadly oversold at its present price of $26,000, according to its daily relative strength index (RSI) as assessed by Cointelegraph Markets Pro and TradingView.
As noted by Cointelegraph, the 12-hour RSI reached its lowest point in five years this month and has yet to bounce back — again indicating that a resurgence of investor interest has yet to occur.
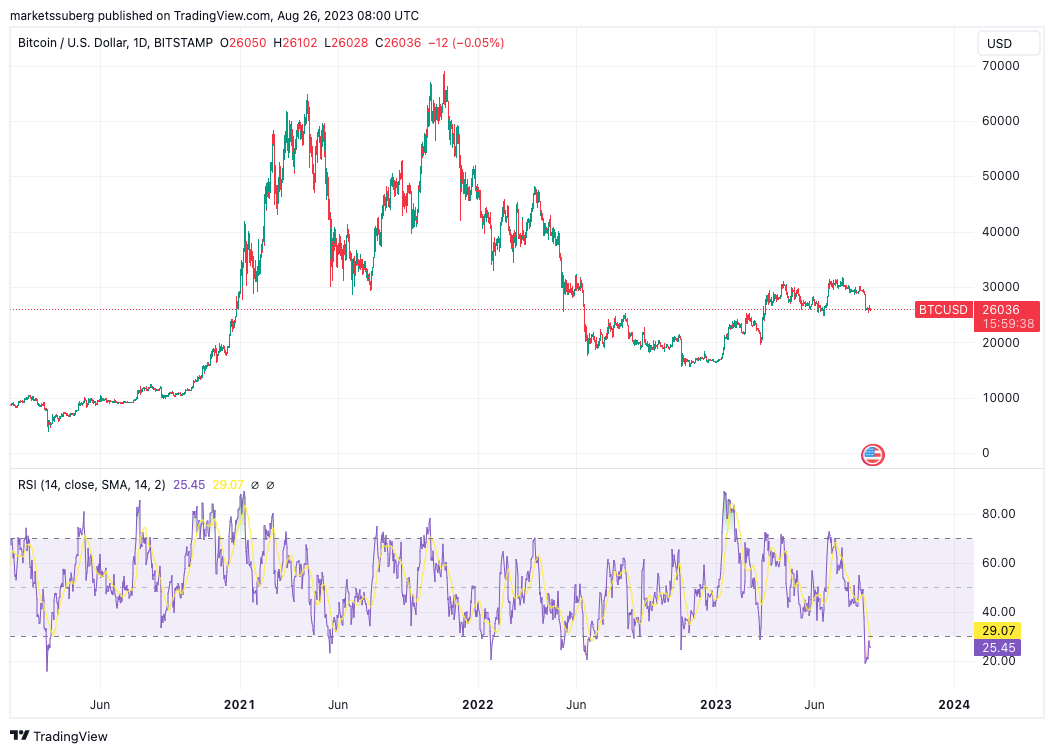 BTC/USD 1-day chart with RSI. Source: TradingView
Collect this article as an NFT to preserve this moment in history and show your support for independent journalism in the crypto space.
This article does not provide investment advice or recommendations. Every investment and trading decision carries risk, and readers should perform their own research before making any decisions.