Disclaimer: Information found on CryptoreNews is those of writers quoted. It does not represent the opinions of CryptoreNews on whether to sell, buy or hold any investments. You are advised to conduct your own research before making any investment decisions. Use provided information at your own risk.
CryptoreNews covers fintech, blockchain and Bitcoin bringing you the latest crypto news and analyses on the future of money.

- U.S. inflation for August surpassed expectations at 3.7%, marking the second month in a row of increasing inflation.
- Bitcoin (BTC) has rebounded from the $25,000 to $26,500 range.
The inflation rate in the United States rose to an annual figure of 3.7% in August, exceeding the anticipated rate of 3.6%, as per the latest Consumer Price Index (CPI) data released by the U.S. Bureau of Labor Statistics. This represents the second consecutive month of inflation growth, with the CPI increasing from 3.2% in July and 3% in June, although it remains at the slowest growth rate since March 2021.
In the cryptocurrency sector, FTX, a cryptocurrency exchange currently in bankruptcy, has received court approval to liquidate its crypto assets, which are valued at an impressive $3.4 billion, highlighting the ongoing difficulties and volatility in the crypto market.
In light of these economic challenges, Bitcoin (BTC), the largest cryptocurrency, has demonstrated some positive movement. Earlier this week, BTC found support at $25,000, and as of this writing, it is trading at $26,284. During the early hours of the day, Bitcoin even reached $26,500.
Bitcoin (BTC) Price on Surge
Related Posts
In the last 24 hours, Bitcoin’s price has increased by more than 1.5%, with a weekly rise of 2.10%. These significant gains have drawn the attention of both investors and traders.
Examining the daily price chart, Bitcoin is currently situated above several key support levels on the one-hour chart. It has notably broken through a descending trendline. Additionally, the 50-day moving average has crossed above the 200-day moving average, which is a bullish indicator in technical analysis. Presently, the BTC price continues to trade above these moving averages.
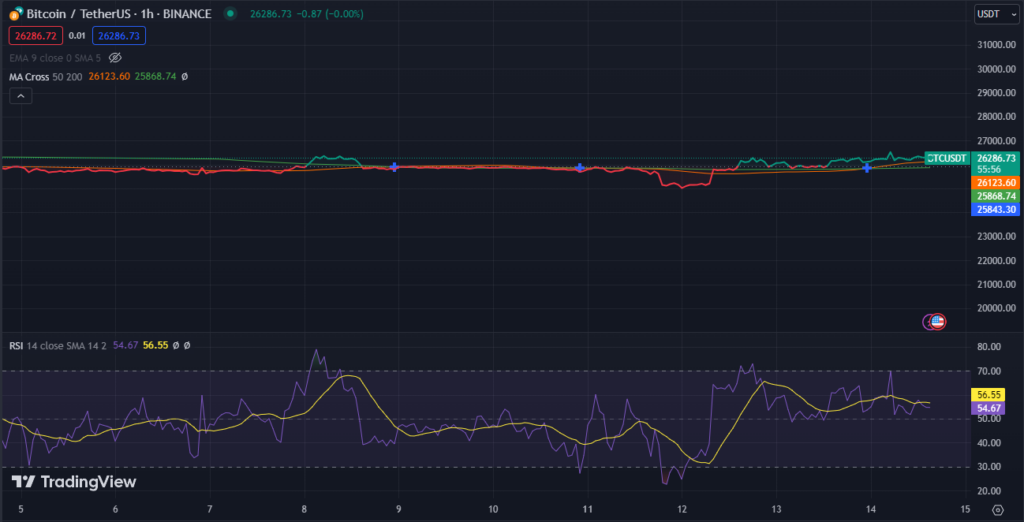 Bitcoin (BTC) Price Chart (Source: TradingView)
The Relative Strength Index (RSI) for Bitcoin is at 56, indicating a neutral position. This implies that there is potential for further price fluctuations.
Looking forward, if Bitcoin succeeds in breaking through the critical support level of $26,565 and maintains stability above this point, it could set the stage for an upward trend towards $28,000 and possibly $30,000.
Nonetheless, the chance of bearish movements cannot be completely dismissed. Should the bears take control, Bitcoin might see a decline to $25,843 or potentially lower, down to $25,200.