Disclaimer: Information found on CryptoreNews is those of writers quoted. It does not represent the opinions of CryptoreNews on whether to sell, buy or hold any investments. You are advised to conduct your own research before making any investment decisions. Use provided information at your own risk.
CryptoreNews covers fintech, blockchain and Bitcoin bringing you the latest crypto news and analyses on the future of money.
Bitcoin (BTC) experienced reduced volatility on April 30 as the weekly and monthly candle closures approached.
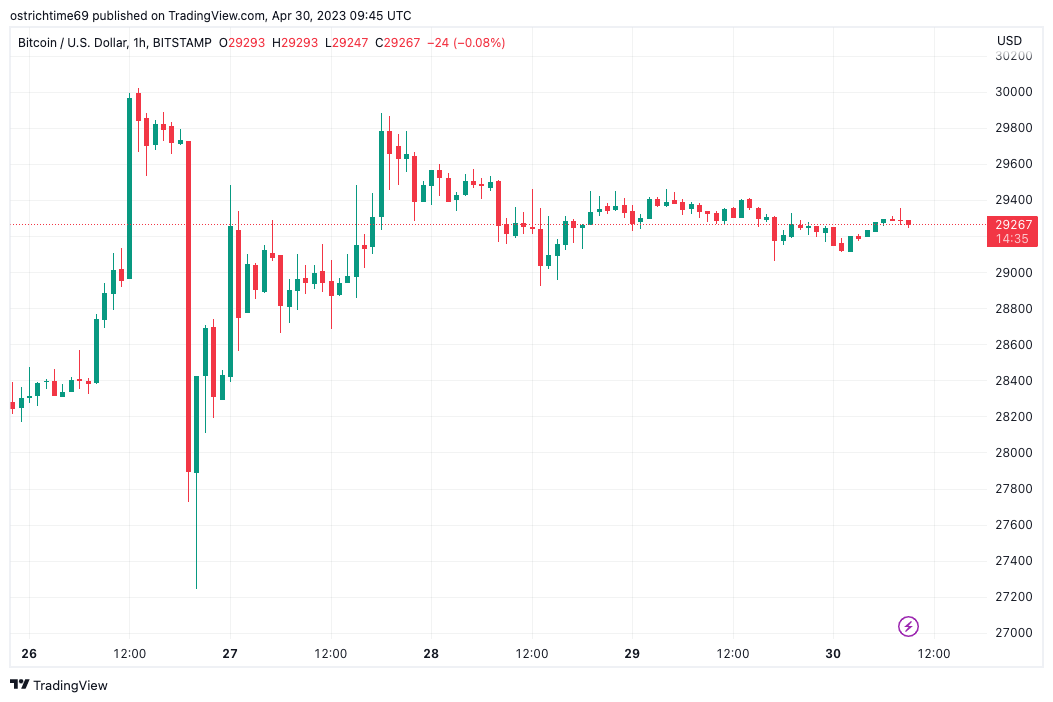 BTC/USD 1-hour candle chart (Bitstamp). Source: TradingView
Trader anticipates BTC price resistance at $32,500
Data from Cointelegraph Markets Pro and TradingView monitored BTC/USD as it hovered just above $29,000 over the weekend.
Following erratic price movements earlier in the week, Bitcoin reverted to a sideways trading pattern, with markets experiencing an unusual tranquility despite the possibility of volatility due to diminished weekend liquidity.
Consequently, traders remained optimistic that no unexpected developments would occur during the candle closures.
$BTC / $USD – Update
Stablecoin Sunday for #Bitcoin today please pic.twitter.com/4qphyAOssT— Crypto Tony (@CryptoTony__) April 30, 2023
“Nothing has changed,” noted prominent trader Elizy in a recent Twitter analysis of the three-day chart.
Elizy identified a potential upside target of up to $32,500 in the event of a breakout, while a breach of a crucial trend line below the current price would warrant a shift to a “very bearish” outlook.
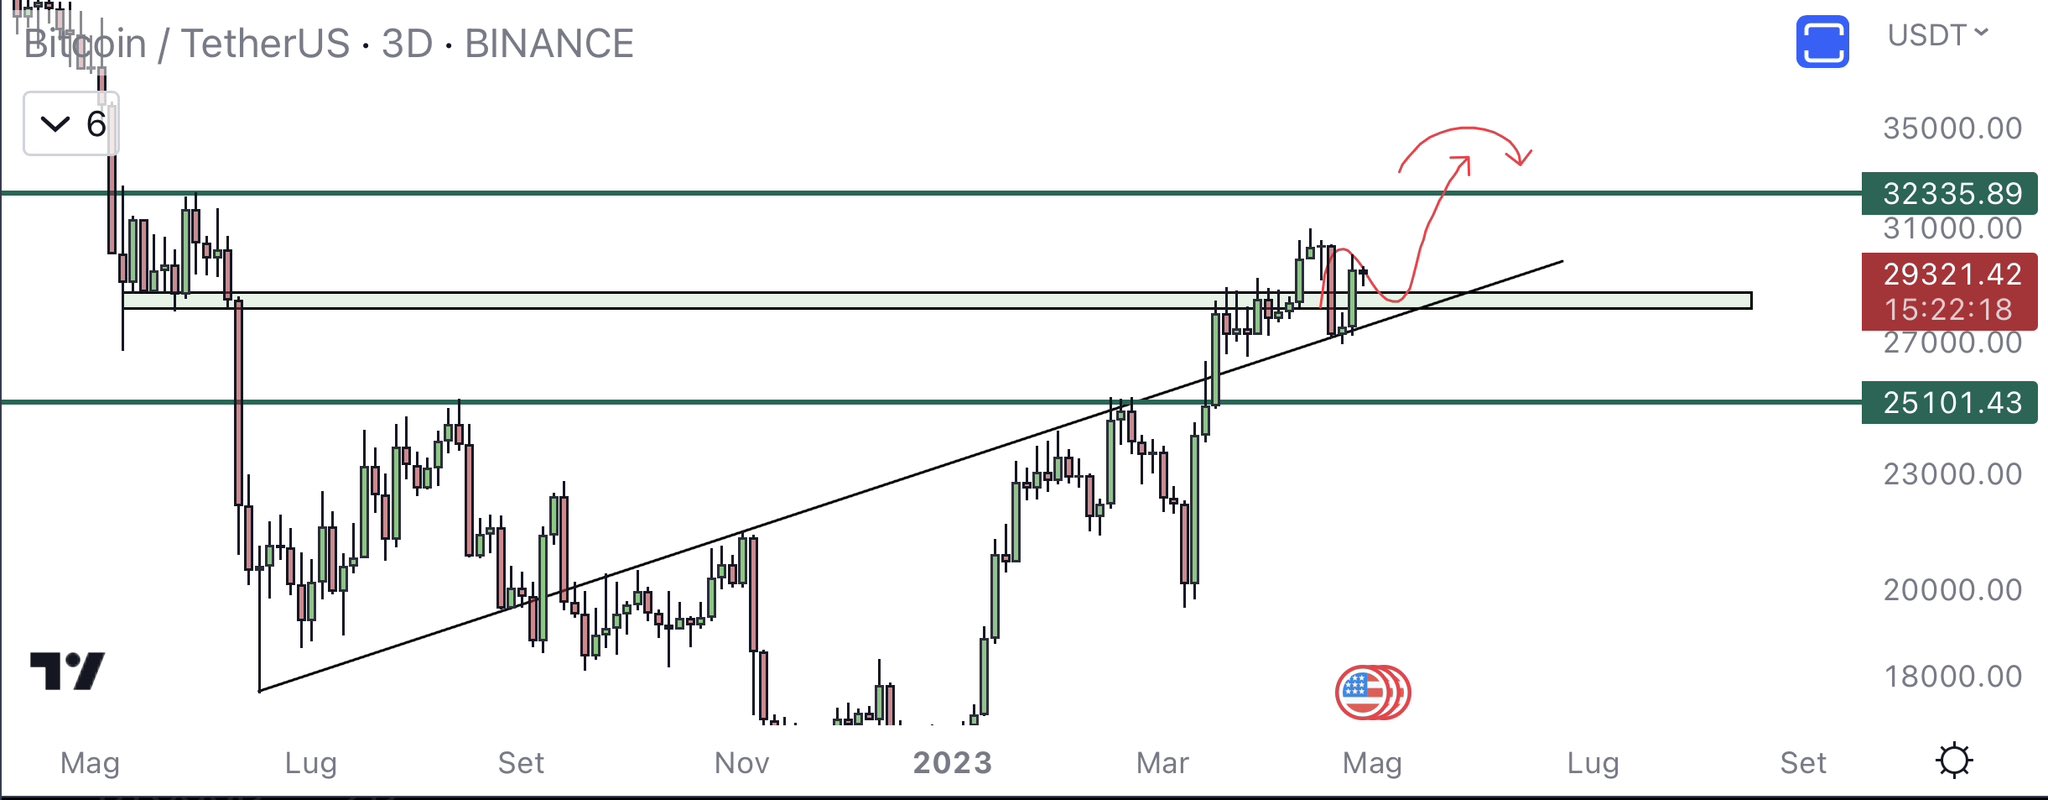 BTC/USD annotated chart. Source: Elizy/Twitter
Another trader known as J focused on the monthly closure, observing that BTC/USD was currently positioned at a historically significant level based on patterns from its ongoing halving cycle.
“On the monthly, we can see Bitcoin has surged into the 2021 lows, which represents a significant resistance + supply area,” he summarized.
Related Posts
In terms of the long-term outlook, the leading cryptocurrency is expected to experience “Chop + slightly down during May – Sep/Oct,” J added, before performance improves.
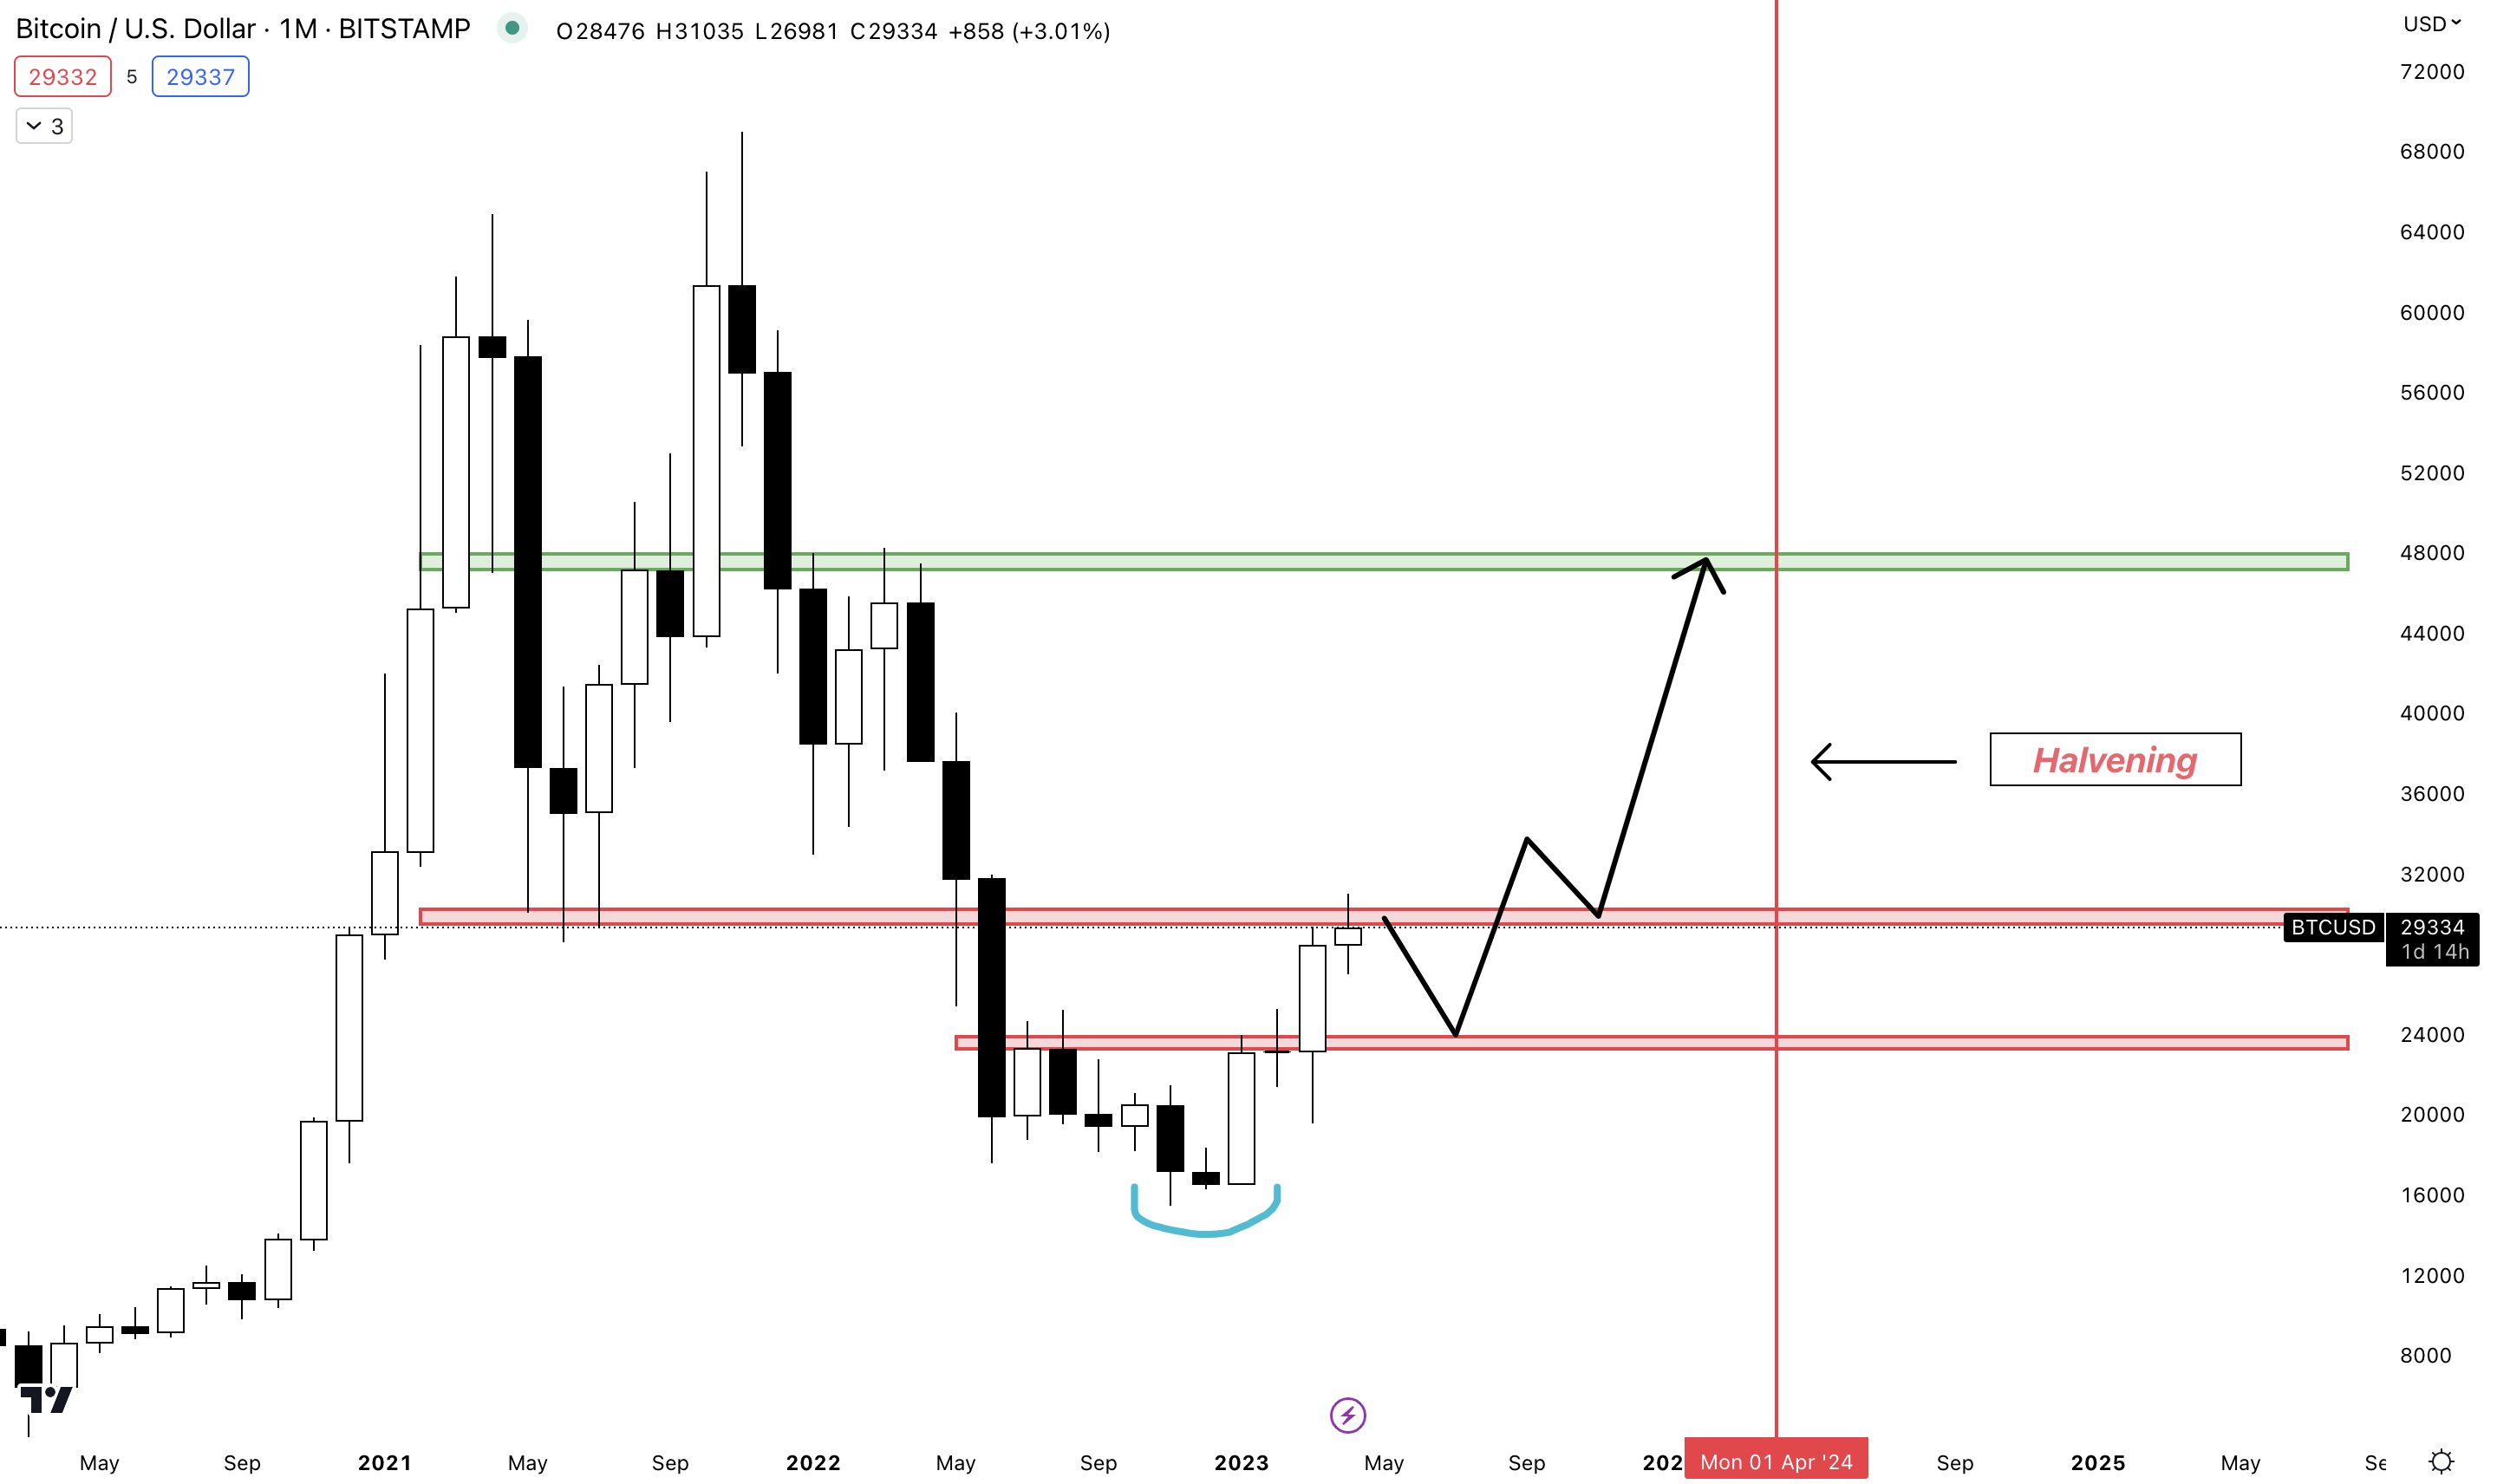 BTC/USD annotated chart. Source: J/Twitter
“Good luck bears”
With limited information available on shorter timeframes, others also turned to analyzing strength on the weekly chart and beyond.
Related: Bitcoin price holds $29K as US PCE data sparks 90% Fed rate hike bets
Among these was analyst Moustache, who pointed out that support remained above key exponential moving averages (EMAs), similar to conditions that preceded significant upward movements in previous years.
“Imagine being bearish on BTC even though it has been forming support ABOVE the EMA ribbon bands for several weeks. Good luck bears,” he remarked.
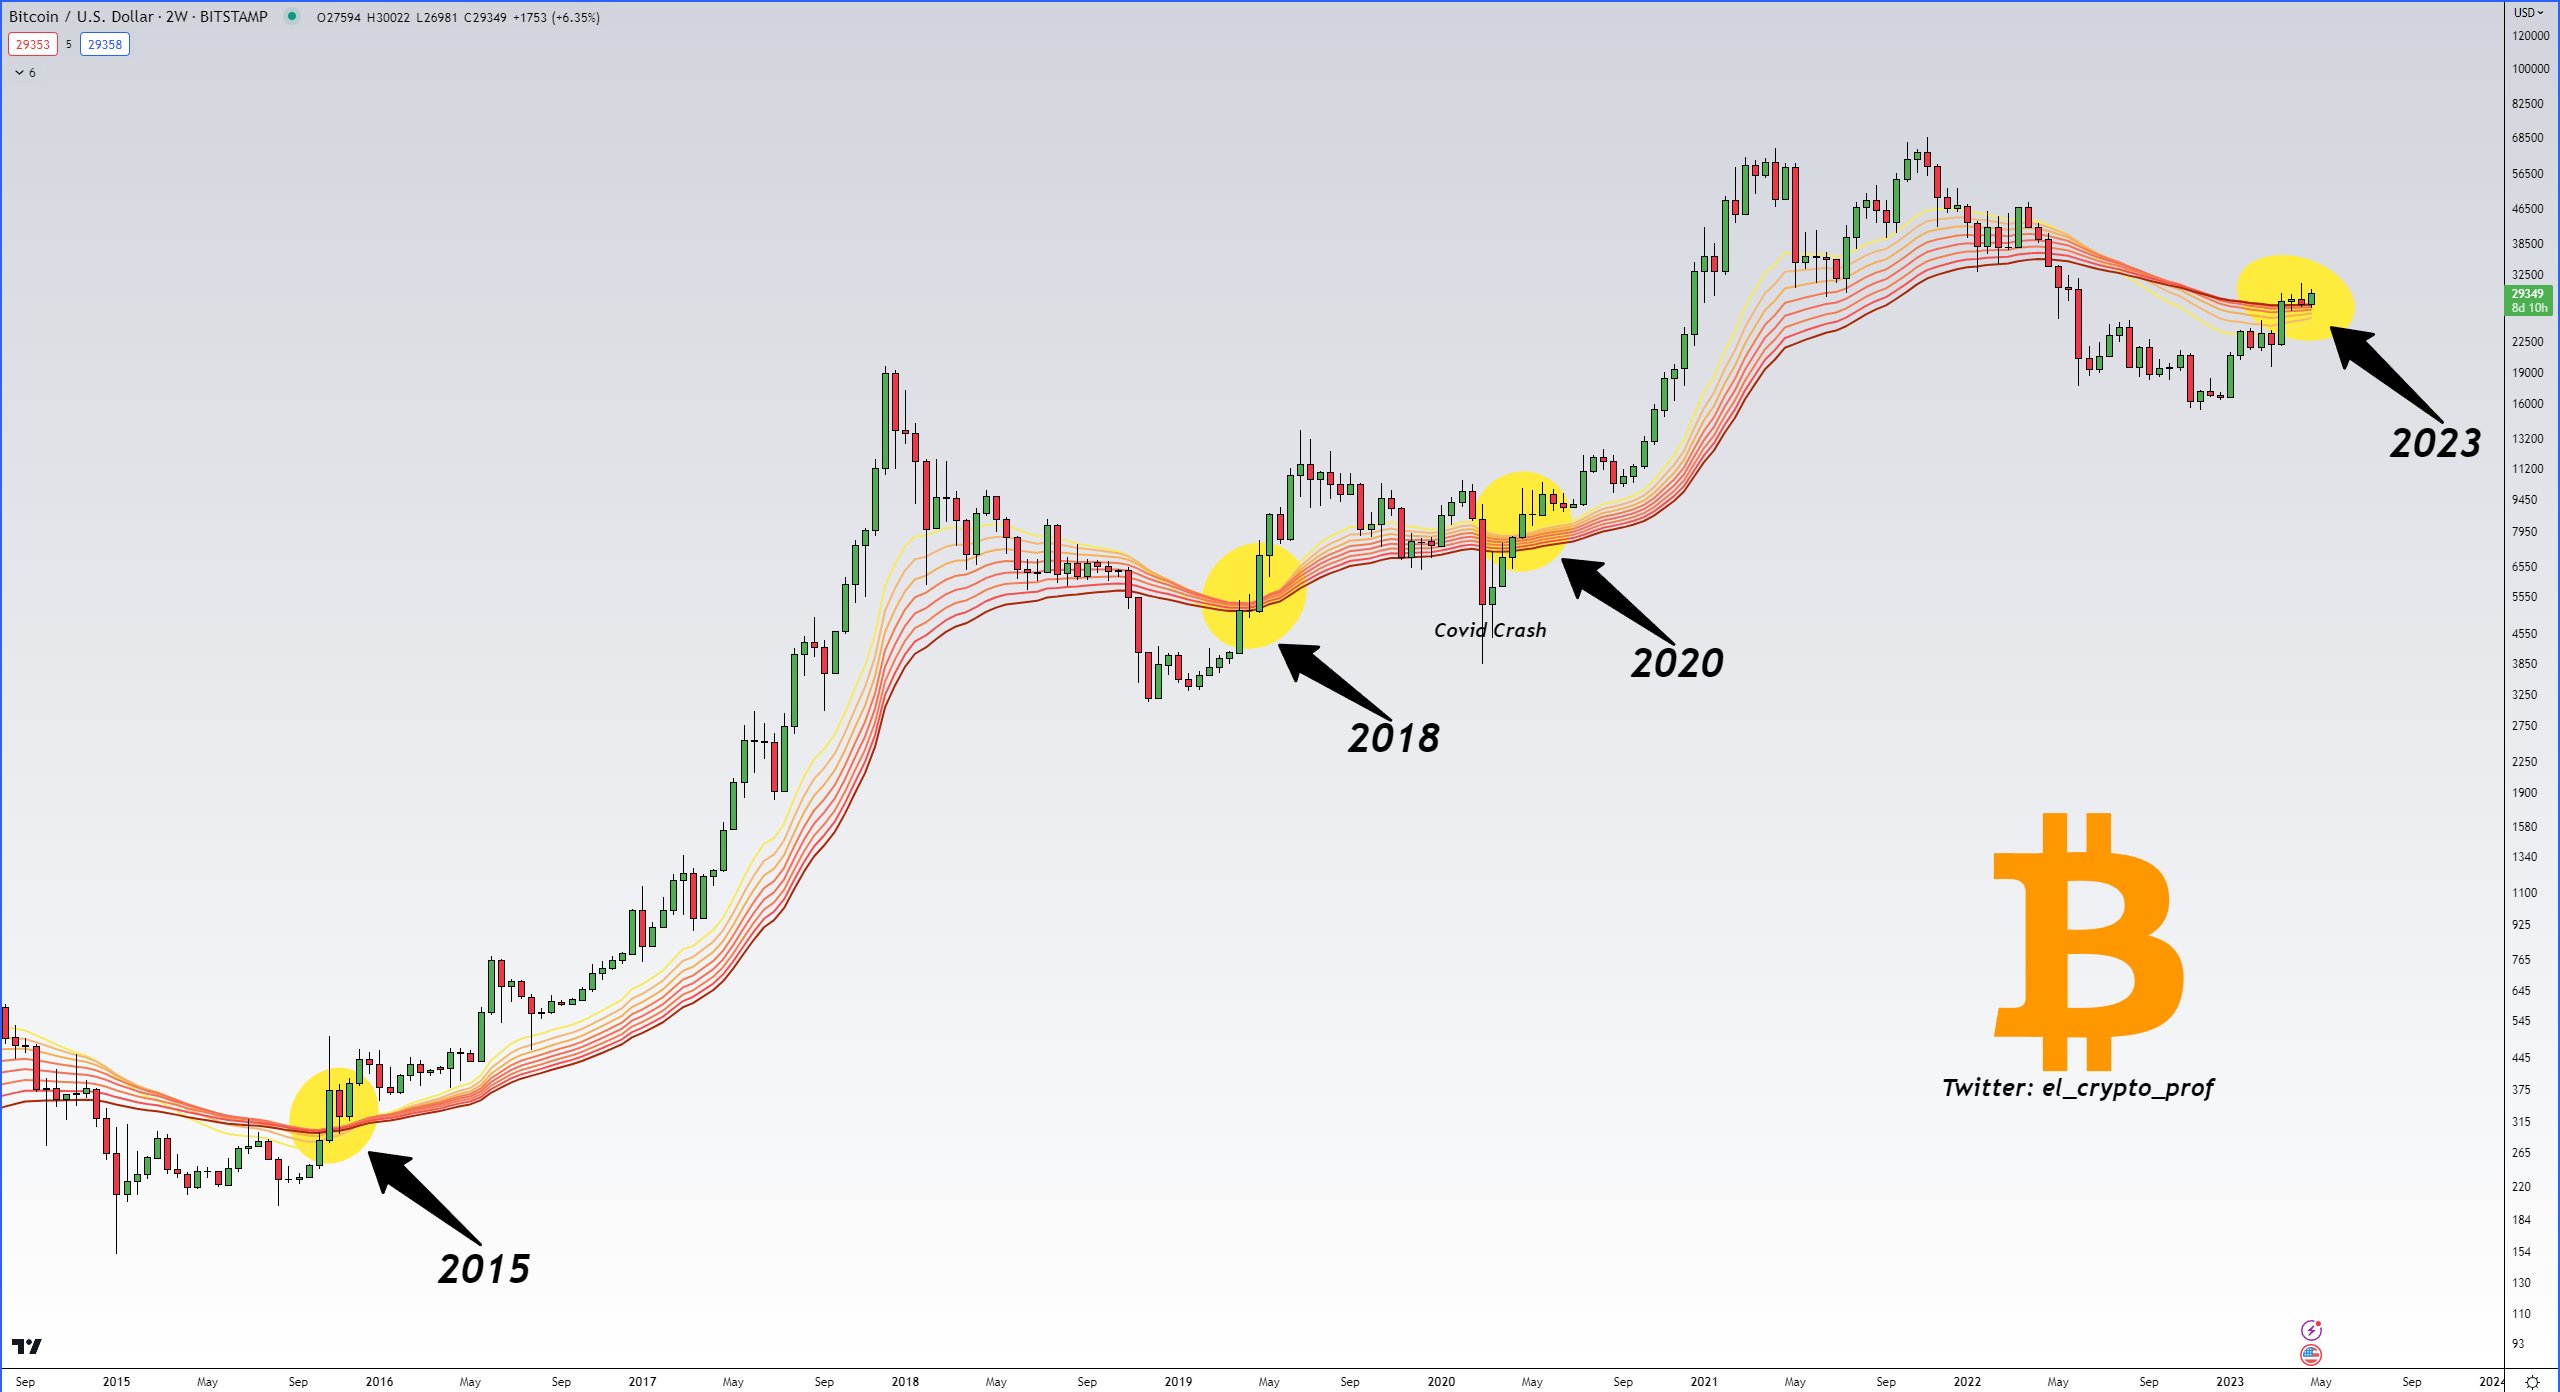 BTC/USD annotated chart. Source: Moustache/Twitter
Last week, Moustache contended that “smart money” had already established BTC positions and was now poised for the actual upward movement to commence.
At the current price of $29,267, Bitcoin would significantly offset the previous weekly candle losses if it were to close without any last-minute volatility.
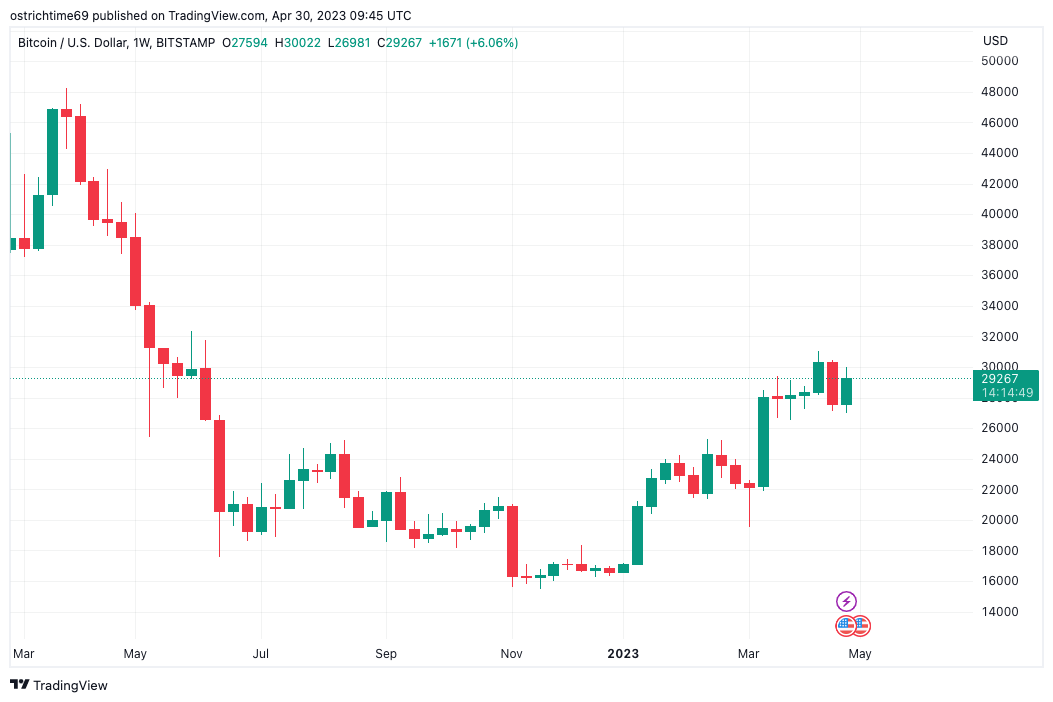 BTC/USD 1-week candle chart (Bitstamp). Source: TradingView
Magazine: Whatever happened to EOS? Community shoots for unlikely comeback
This article does not provide investment advice or recommendations. Every investment and trading decision carries risk, and readers should perform their own research before making any choices.