Disclaimer: Information found on CryptoreNews is those of writers quoted. It does not represent the opinions of CryptoreNews on whether to sell, buy or hold any investments. You are advised to conduct your own research before making any investment decisions. Use provided information at your own risk.
CryptoreNews covers fintech, blockchain and Bitcoin bringing you the latest crypto news and analyses on the future of money.
On May 16, Bitcoin (BTC) hovered around $27,000 as traders remained optimistic about potential upward movement.
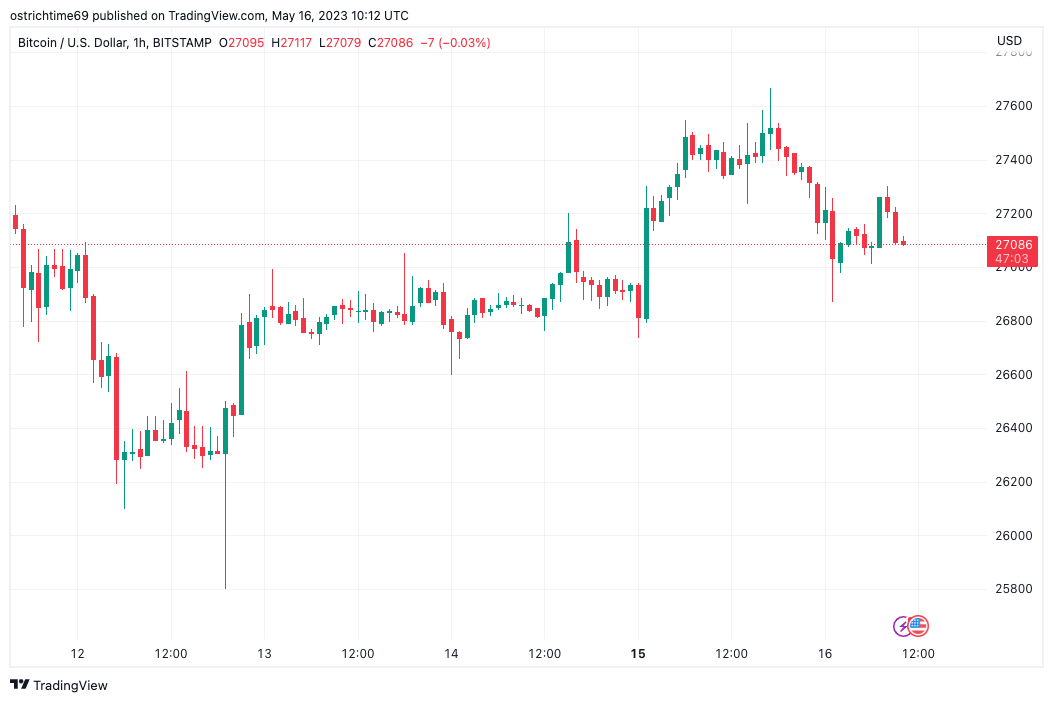 BTC/USD 1-hour candle chart on Bitstamp. Source: TradingView
Trader indicates $24,000 BTC price still relevant
Data from Cointelegraph Markets Pro and TradingView indicated that BTC/USD was still centered on the $27,000 level, having dipped to $26,870 following the daily close.
With a lack of clear direction, traders were hopeful that the pair would either break out of its current tight range or reach more significant levels either upward or downward.
According to well-known trader Crypto Ed, potential targets included the “gap” in CME futures created over the weekend.
“The action is really happening on the lower timeframe; the higher timeframe is not particularly thrilling,” he summarized in his latest YouTube update for the day.
The CME gap to the downside is situated between $26,500 and $26,800 — just beneath the overnight lows.
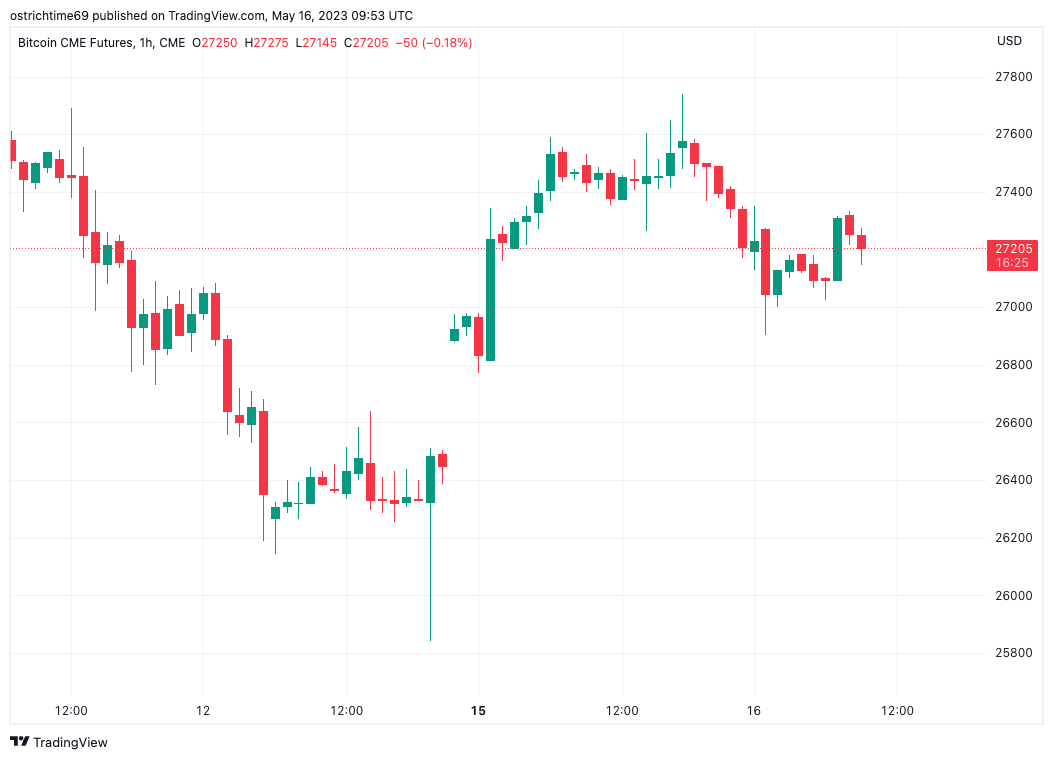 CME Bitcoin futures 1-hour candle chart. Source: TradingView
Crypto Ed noted that a rebound following the gap could push BTC/USD back to its range highs at $28,800, but the possibility of a downside move kept $24,000 as a relevant target.
Other market participants shared similar caution, with trader Jackis describing Bitcoin as “very difficult to interpret” under the current conditions.
“My personal view is that we will see Weekly continuation and Daily breakdown,” he concluded in his Twitter analysis for the day.
Related Posts
In this context, the potential for higher levels on weekly timeframes persisted despite the ongoing pullback.
“It’s important to highlight that the weekly structure remains bullish & that whether from this point or if a deeper pullback occurs, it could represent a potential higher low in a bullish trend, which should lead to a break of 31K until proven otherwise,” Jackis explained.
Analyst cautions about debt ceiling volatility
In other news, macroeconomic factors increasingly began to encompass the ongoing debt ceiling crisis in the United States.
Related: Digital asset market contracts as fund outflows hit $200M: CoinShares
With the June 1 deadline for a potential default approaching swiftly, markets were already feeling the strain, according to trader Skew.
“Lackluster price action is primarily due to the U.S. debt ceiling evolving into a likely crisis, especially as we near the June 1 deadline,” he tweeted regarding the U.S. dollar index (DXY).
“The implications will be what large funds are monitoring as we approach late May (raised or suspended). Anticipate increased volatility & diminishing liquidity in the coming weeks, particularly around the deadline period.”
The DXY, which is traditionally but not exclusively inversely correlated with BTC price movements, continued to decline on the day following a week of sharp gains.
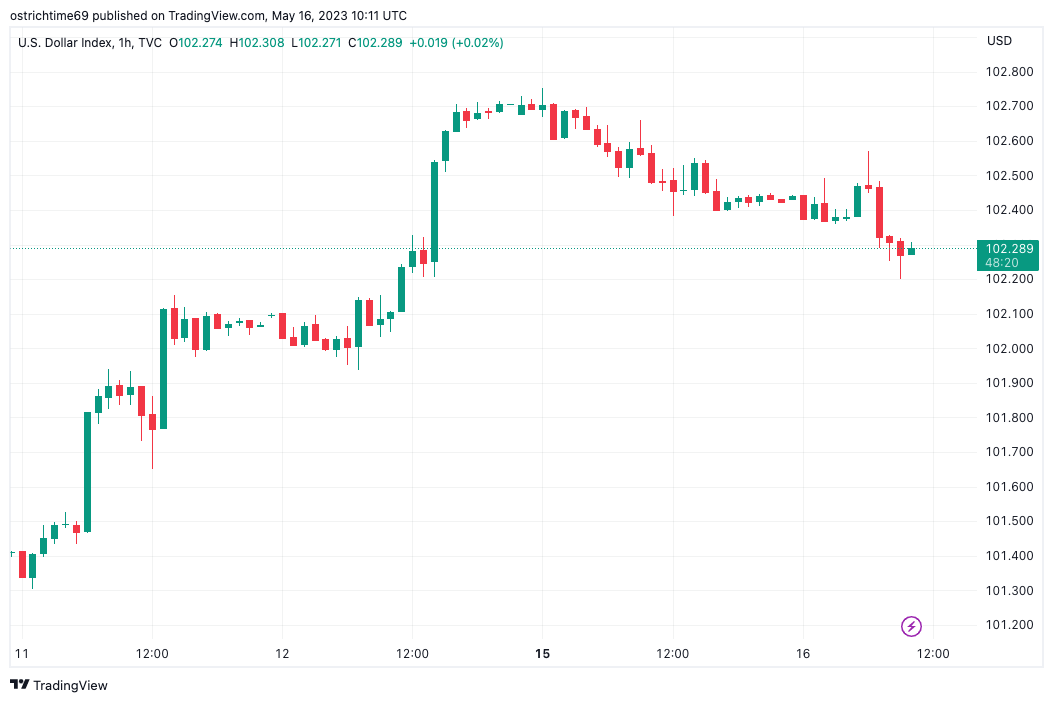 U.S. dollar index (DXY) 1-hour candle chart. Source: TradingView
As reported by Cointelegraph, the key macro event of the week will be public remarks by Jerome Powell, Chair of the Federal Reserve, on May 19.
Magazine: Alameda’s $38B IRS bill, Do Kwon kicked in the assets, Milady frenzy: Asia Express
This article does not provide investment advice or recommendations. Every investment and trading decision carries risk, and readers should perform their own research before making any decisions.