Disclaimer: Information found on CryptoreNews is those of writers quoted. It does not represent the opinions of CryptoreNews on whether to sell, buy or hold any investments. You are advised to conduct your own research before making any investment decisions. Use provided information at your own risk.
CryptoreNews covers fintech, blockchain and Bitcoin bringing you the latest crypto news and analyses on the future of money.
Bitcoin reaches a critical juncture as BTC price stands at $28.8K, according to the creator of Bollinger Bands.
Bitcoin (BTC) dipped below $29,000 on April 20 as bulls encountered challenges in maintaining ground regained in March.
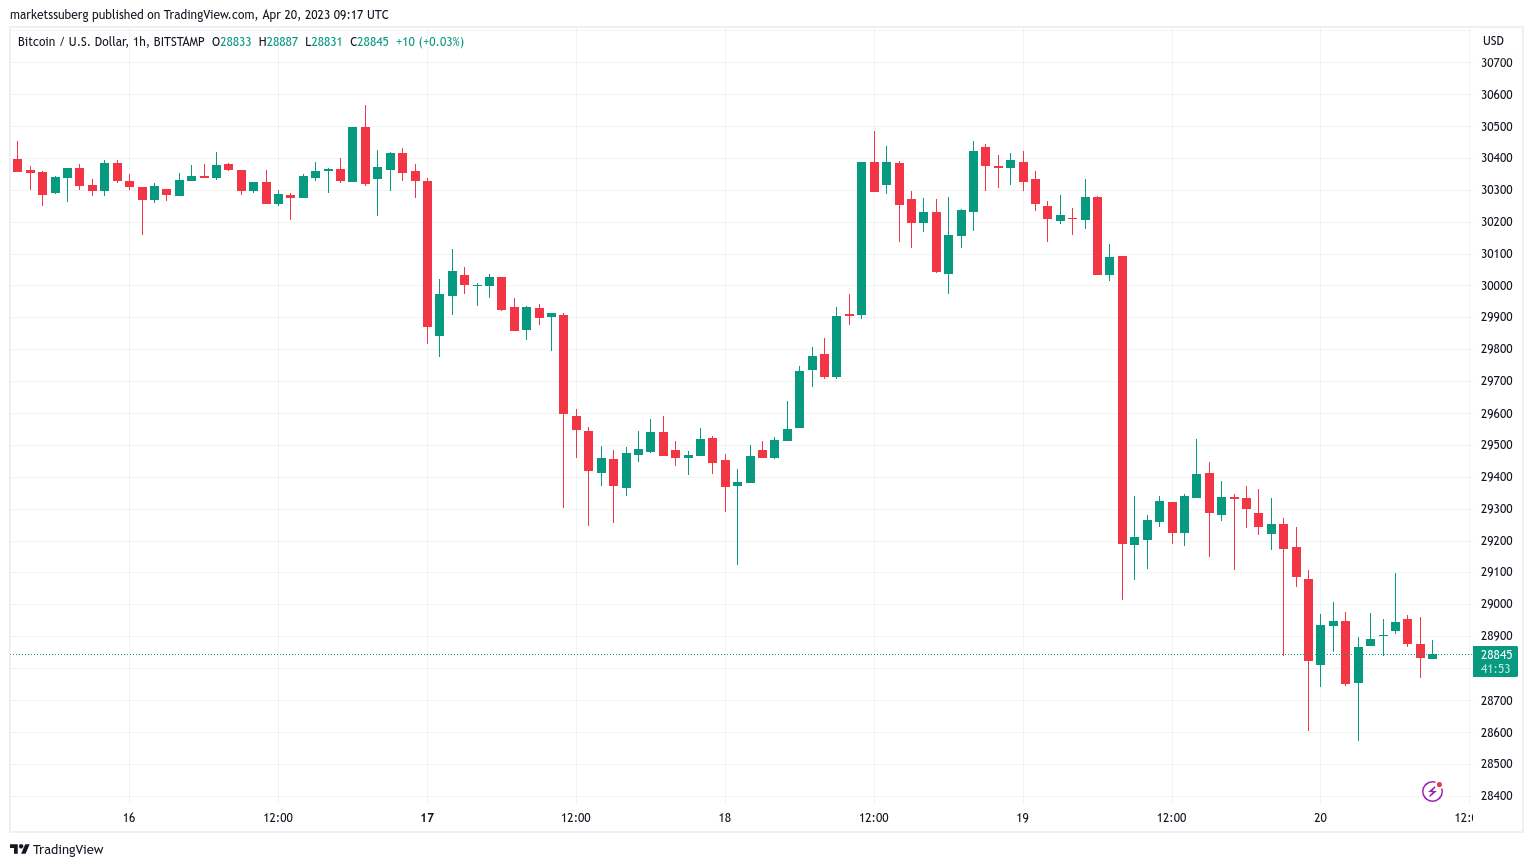 BTC/USD 1-hour candle chart (Bitstamp). Source: TradingView
Will $30,000 become Bitcoin’s latest “Bart Simpson”?
Data from Cointelegraph Markets Pro and TradingView indicated that BTC/USD was approaching $28,800 on Bitstamp.
Previous wicks below $28,600 were swiftly purchased, yet Bitcoin still posed a risk of turning $29,000 into resistance for the day, as traders focused on a vital support area.
$BTC / $USD – Update
Currently on support, so I am scalping a long while we stay above the lows at $28,550 on a 4-hour closure.
We’ll see how this unfolds today pic.twitter.com/qsjmVn2kb9— Crypto Tony (@CryptoTony__) April 20, 2023
“While the Bitcoin market is undergoing a correction, the average transactor continues to take profits,” Checkmate, the lead on-chain analyst at Glassnode, stated in part of a Twitter analysis.
“This suggests to me that assets are still being removed from the market, and we have not yet seen a complete exit of top buyers (similar to March).”
Checkmate further noted that he was anticipating realized losses to take precedence as a sign of “panic” among those who acquired BTC when it surpassed $30,000 earlier this month.
An accompanying chart illustrated the Adjusted Spent Output Profit Ratio (aSOPR) metric, which reflects the overall profit and loss of on-chain transactions.
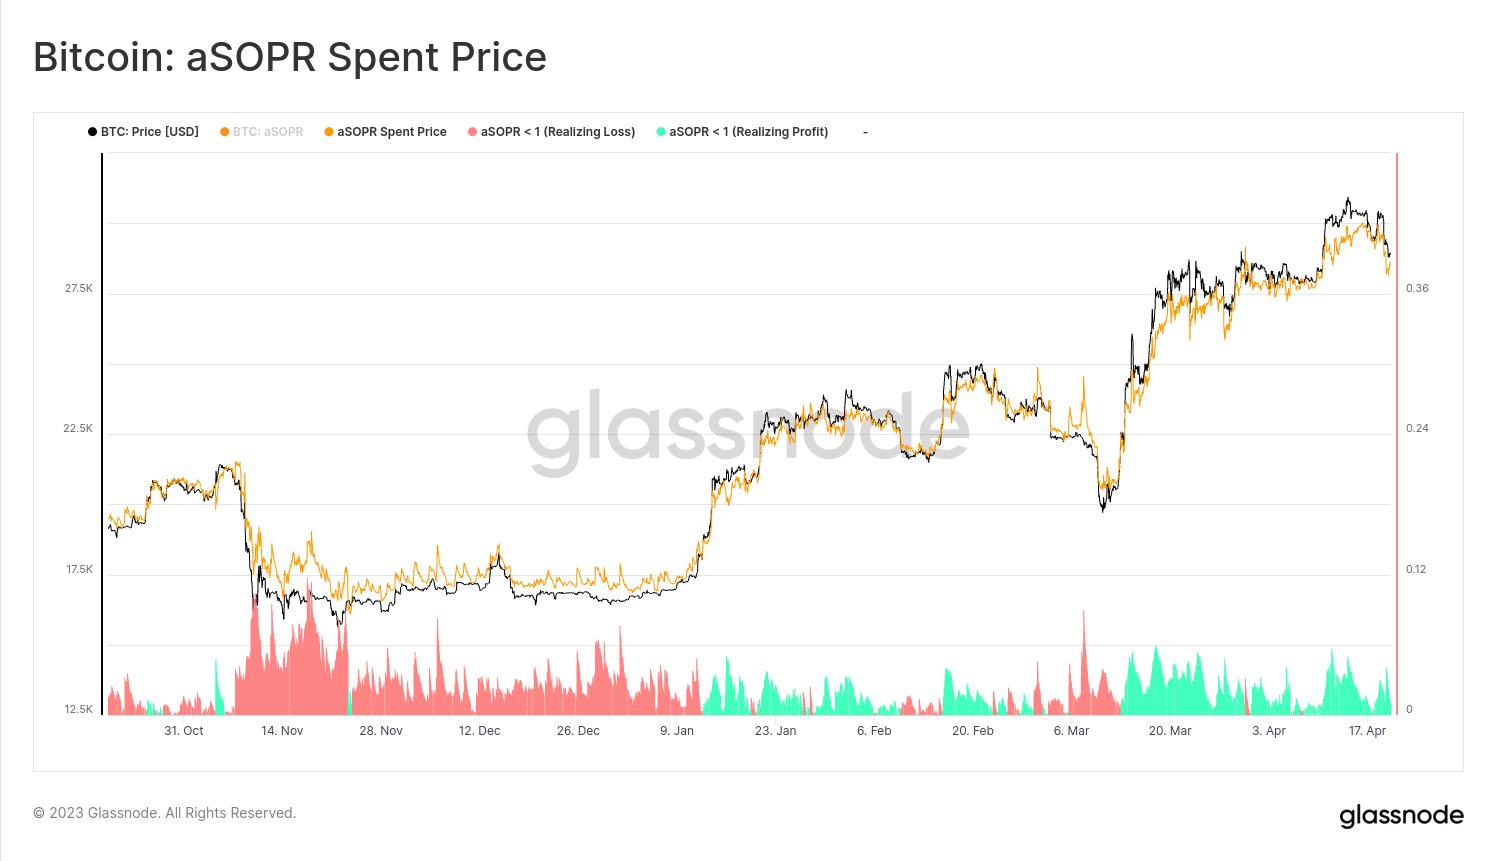 Bitcoin aSOPR chart. Source: Checkmate/Twitter
Some analysts maintained a more optimistic perspective, with Matthew Hyland highlighting one-month lows in Bitcoin’s relative strength index (RSI) on daily timeframes.
RSI provides insight into how overbought or oversold BTC/USD is at a specific price point, and while still relatively elevated, such a reset and subsequent reversal can indicate a potential upward trend.
Related Posts
#Bitcoin Daily RSI now at its lowest level since BTC closed at $24,200 over a month ago pic.twitter.com/JjGd7IqVJ5
— Matthew Hyland (@MatthewHyland_) April 19, 2023
In another observation, popular trader and analyst Jelle noted a mimicking pattern by BTC/USD, which closely followed a price fractal from 2020.
This ultimately formed a so-called “Bart Simpson” pattern — a rise, followed by a plateau and subsequent decline — only to eventually break out even higher afterward.
“$28,800 has been acting as a bottom so far. If we can maintain this level for the next week or so – I anticipate a breakout above $30,000 soon after,” Jelle projected.
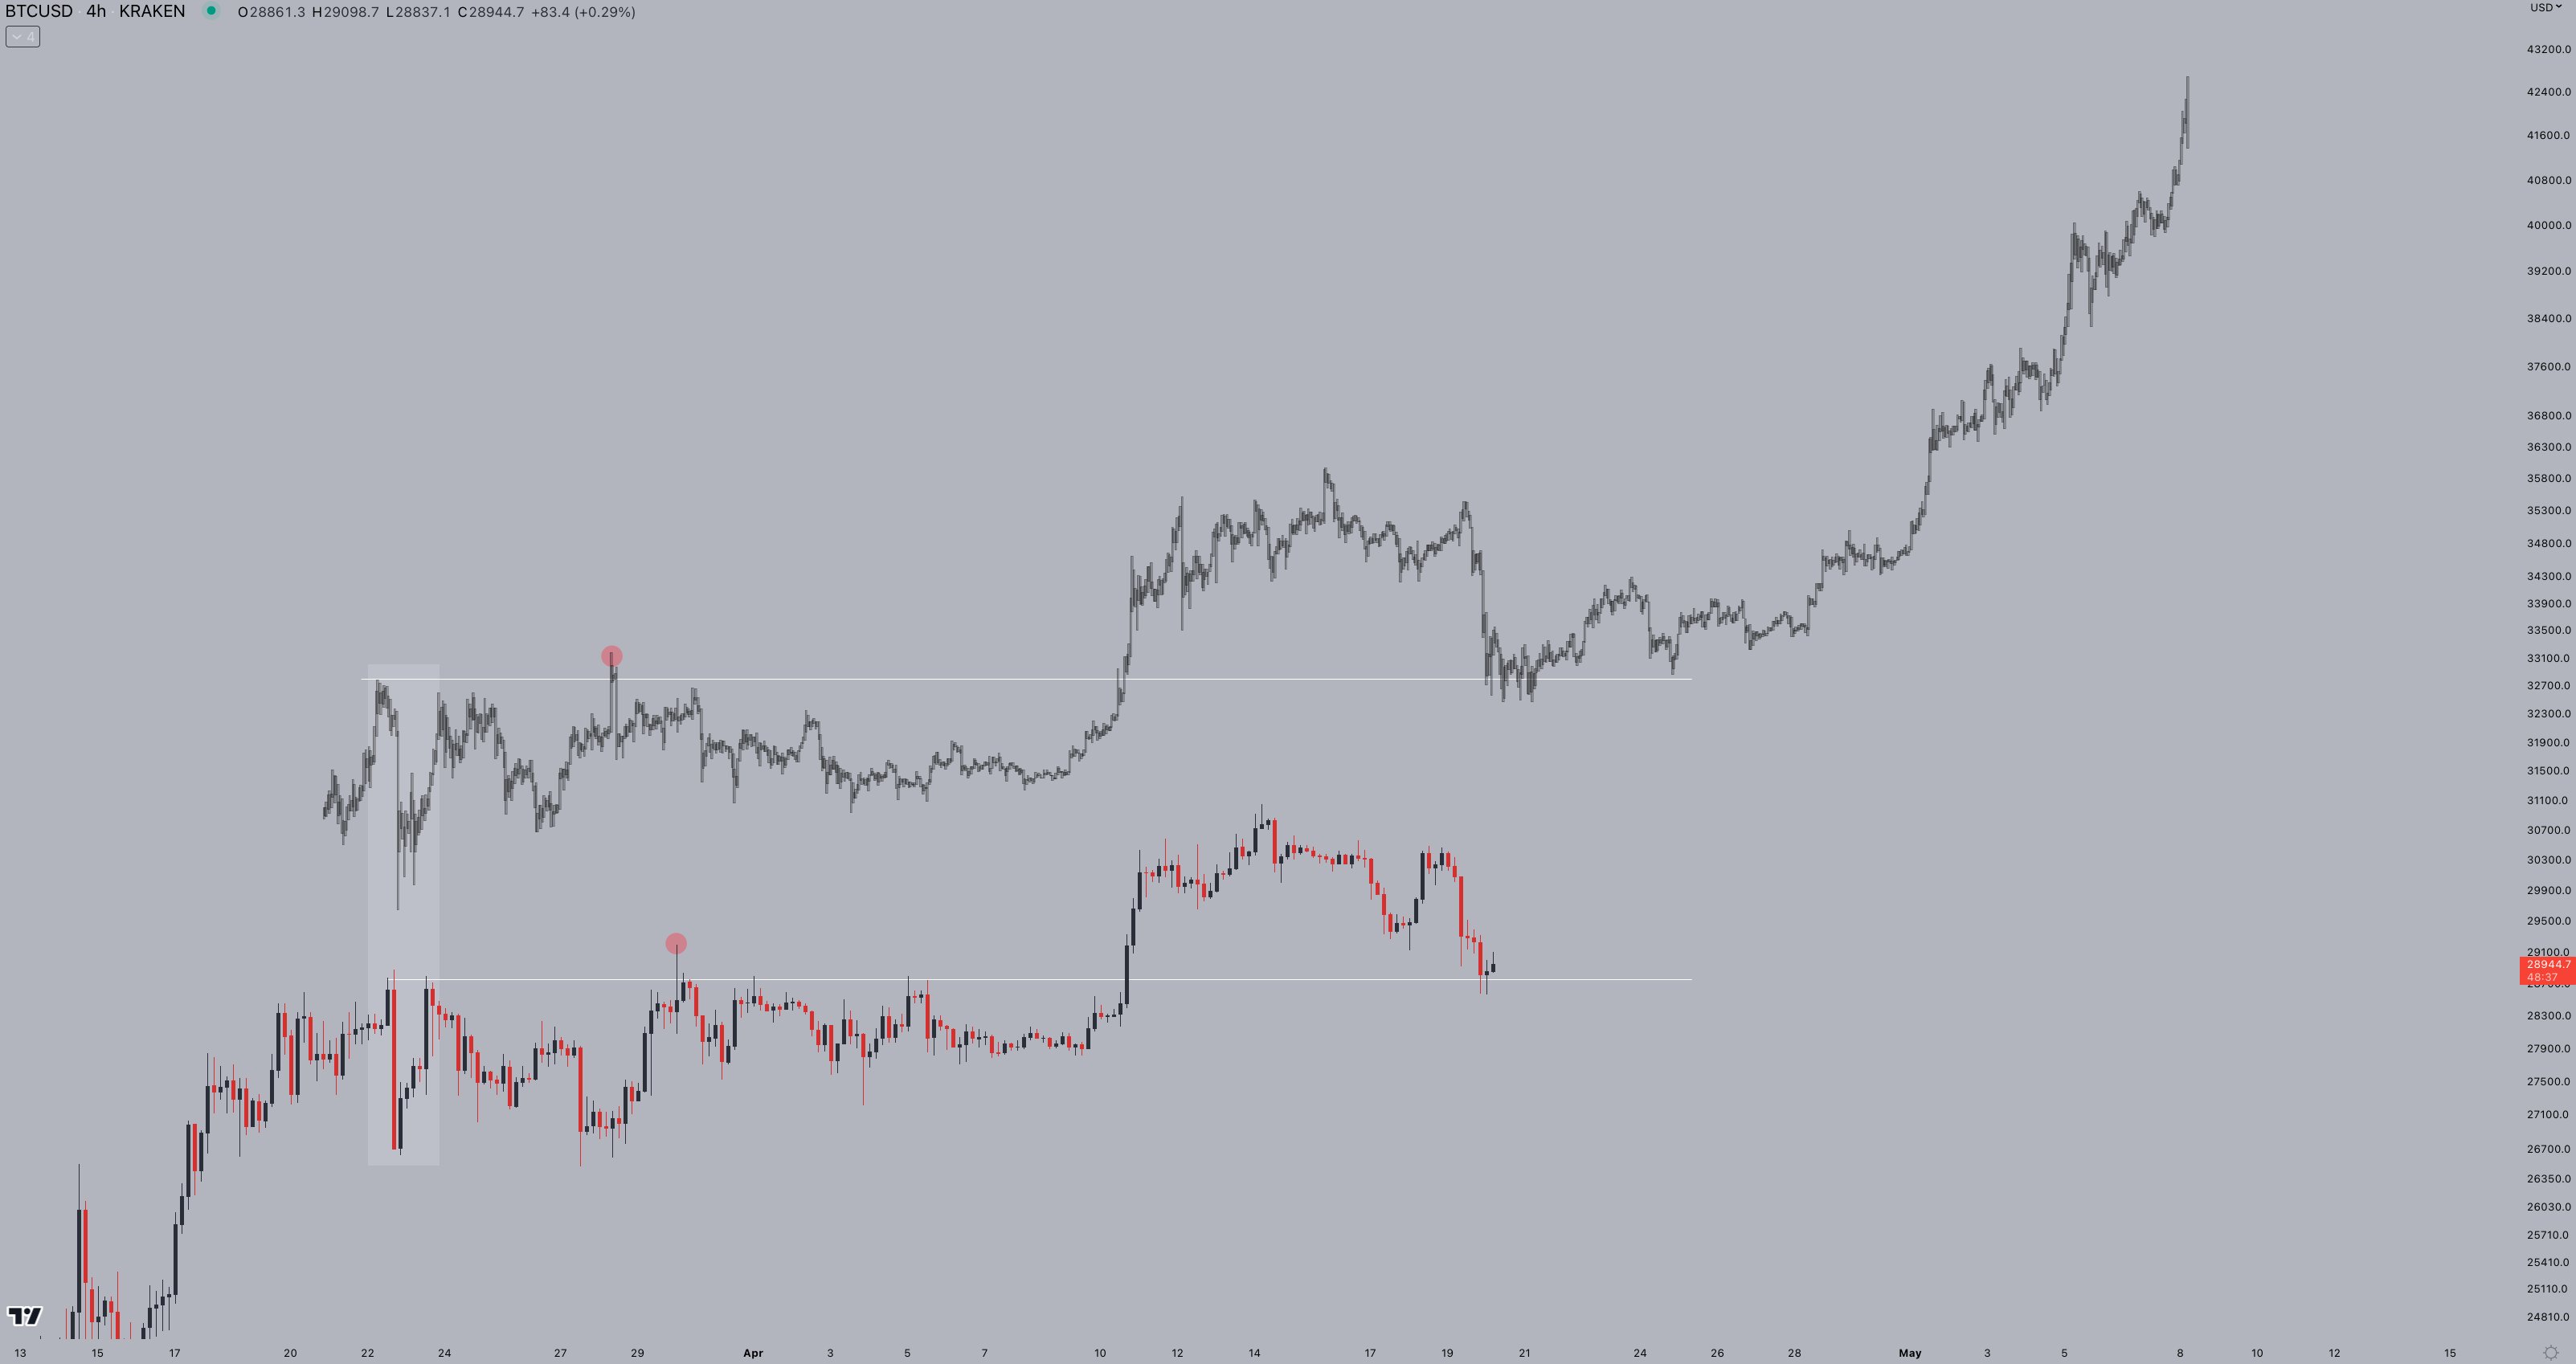 BTC/USD chart fractal. Source: Jelle/Twitter
BTC price returns to “logical place”
With volatility returning to BTC/USD in recent days, John Bollinger, the creator of the Bollinger Bands volatility indicator, advised caution.
Related: Is Bitcoin overbought or oversold? Use Bollinger Bands to find out!
Bitcoin, he remarked on the day, had retreated from its upper Bollinger band, foregoing a breakout beyond it.
“Bitcoin just pulled back to its middle Bollinger Band and its previous breakout level. We refer to this as a logical place. Time to Pay Attention!” he tweeted.
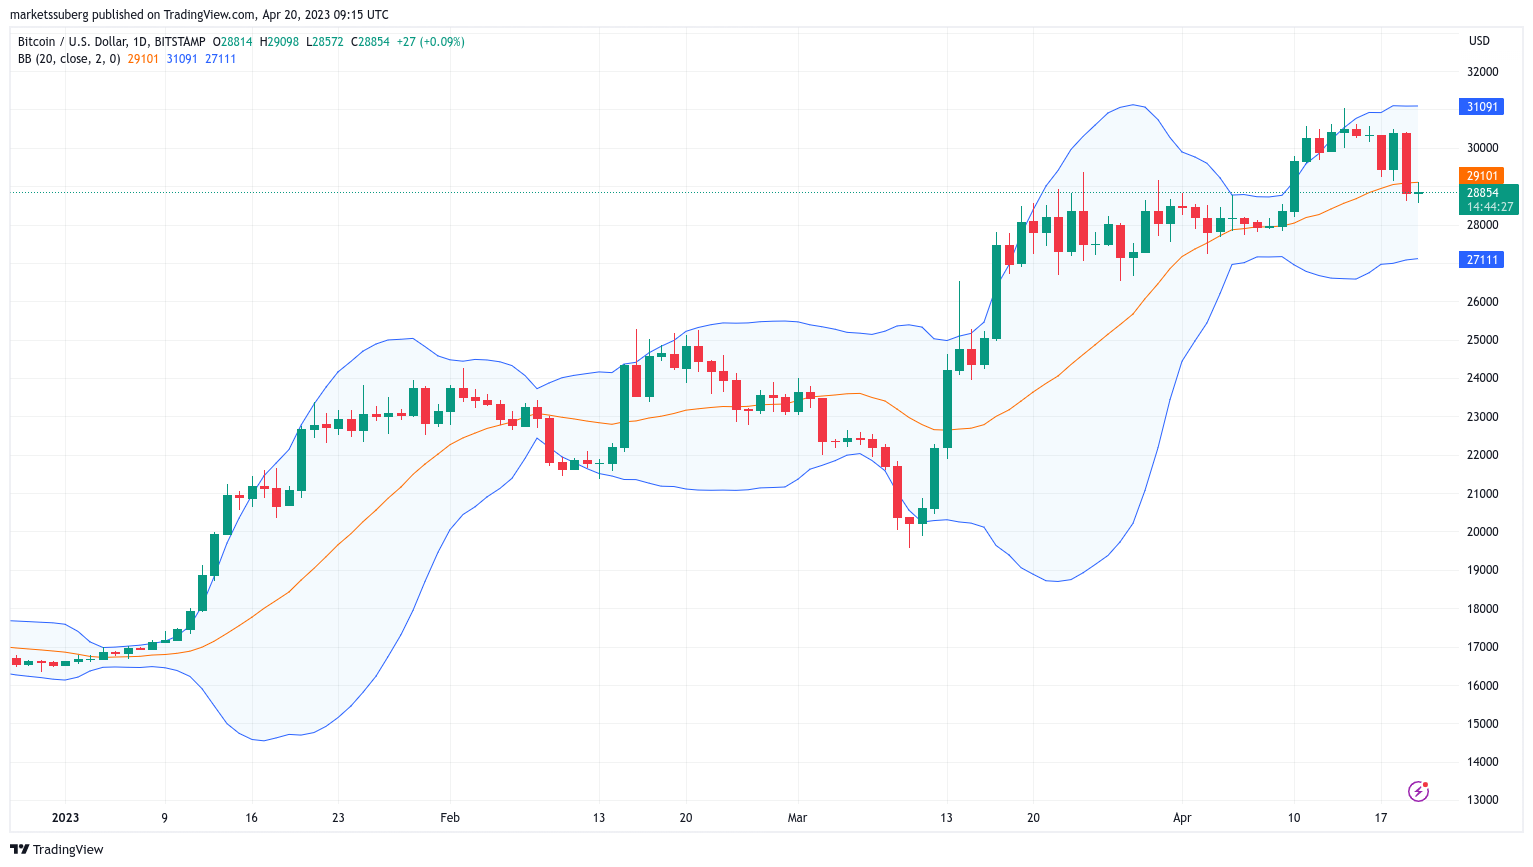 BTC/USD 1-day candle chart (Bitstamp) with Bollinger bands. Source: TradingView
Magazine: Crypto audits and bug bounties are broken: Here’s how to fix them
This article does not provide investment advice or recommendations. Every investment and trading decision carries risk, and readers should perform their own research before making a choice.