Disclaimer: Information found on CryptoreNews is those of writers quoted. It does not represent the opinions of CryptoreNews on whether to sell, buy or hold any investments. You are advised to conduct your own research before making any investment decisions. Use provided information at your own risk.
CryptoreNews covers fintech, blockchain and Bitcoin bringing you the latest crypto news and analyses on the future of money.

The value of Bitcoin surged towards $48,000 following a post regarding Spot BTC ETF approval from the compromised SEC X account.
The “misleading” X post triggered a rise in Bitcoin towards the resistance levels of $47,800 and $48,000.
However, once it was revealed that the X post was fraudulent, Bitcoin reversed all its gains. Nonetheless, the uptrend support remains intact around $45,200.
At the time of writing, Bitcoin is trading above $45,500 and the 100 hourly Simple Moving Average.
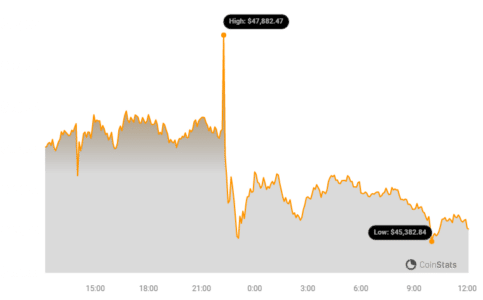 Bitcoin Price Chart | Source: Coinstats
Bitcoin Price Encounters Rejection
The price of Bitcoin initiated a new increase above the $45,500 resistance area.
BTC gained bullish momentum surpassing the $46,000 and $46,500 thresholds following the tweet from the hacked SEC account regarding the ETF approval.
After clarification, there was a significant rejection near the $48,000 area. A peak was reached around $47,988 before the price began to decline again.
The price fell below the $47,000 and $46,500 levels, heading towards the $45,000 support.
A low was established around $44,828, and the price is currently on the rise. It has moved back above the 23.6% Fib retracement level of the recent decline from the $47,988 swing high to the $44,828 low.
Related Posts
See Also: Misleading SEC Tweet Triggered $210m Crypto Meltdown, Did SEC Manipulate The Crypto Market With Fake Tweet?
Bitcoin is presently trading above $45,500 and the 100 hourly Simple Moving Average.
A significant contracting triangle is also forming with resistance near $46,800 on the hourly chart of the BTC/USD pair. On the upside, immediate resistance is located around the $46,400 level.
This is close to the 50% Fib retracement level of the recent decline from the $47,988 swing high to the $44,828 low.
The first major resistance is at $46,800. A decisive move above the $46,800 resistance could propel the price towards the $47,200 resistance.
The next resistance is now developing near the $48,000 level. A close above the $48,000 mark could push the price even higher. The next significant resistance is at $49,250.
If Bitcoin does not manage to surpass the $46,800 resistance zone, it may initiate a new decline. Immediate support on the downside is near the $45,550 level.
The next major support is at $45,200. If the price moves below $45,200, it could gain bearish momentum.
In that scenario, the price might drop towards the $44,800 support in the near term.
Technical Indicators:
- Hourly MACD – The MACD is currently losing momentum in the bearish zone.
- Hourly RSI (Relative Strength Index) – The RSI for BTC/USD is now below the 50 level.
- Major Support Levels – $45,500, followed by $45,200.
- Major Resistance Levels – $46,400, $46,800, and $47,200.
The post Bitcoin Price Rejects 48K After The SEC Drama But Uptrend Still Intact appeared first on BitcoinWorld.