Disclaimer: Information found on CryptoreNews is those of writers quoted. It does not represent the opinions of CryptoreNews on whether to sell, buy or hold any investments. You are advised to conduct your own research before making any investment decisions. Use provided information at your own risk.
CryptoreNews covers fintech, blockchain and Bitcoin bringing you the latest crypto news and analyses on the future of money.
Bitcoin (BTC) might have experienced a more significant decline last week following the recurrence of an on-chain metric reminiscent of the FTX crash.
As highlighted on September 5 by James Straten, a research and data analyst at the crypto insights firm CryptoSlate, the Short to Long-Term Realized Value (SLRV) Ratio has “flipped” for the first time since November 2022.
Bitcoin SLRV Ratio signals FTX caution
The current weakness in BTC prices is prompting market analysts to brace for a potential drop towards $23,000, yet the repercussions from Bitcoin’s downturn in August could have been considerably more severe.
The SLRV Ratio indicates that there was a surge in the sale of “older” Bitcoin in mid-August.
Created by renowned analyst David Puell in collaboration with ARK Invest, the SLRV utilizes the widely recognized HODL Waves metric to monitor Bitcoin’s on-chain velocity.
HODL Waves categorize the circulating BTC supply based on the age of coins involved in transactions. The SLRV takes into account coins that have moved in the last 24 hours and divides them by those that have changed hands between six and twelve months prior.
This metric also incorporates two moving averages — the 30-day and 150-day trendlines — with crossovers between these averages aligning with significant BTC price movements.
Just prior to the FTX crisis, the 150-day line crossed above the 30-day line; this occurrence repeated in mid-August for the first time since that event.
“SLRV ribbons inverted on August 13, three days before Bitcoin fell to $25k. The last inversion of this metric occurred just before the FTX collapse,” Staten noted in a commentary accompanying a chart of SLRV from the on-chain analytics firm Glassnode.
Related Posts
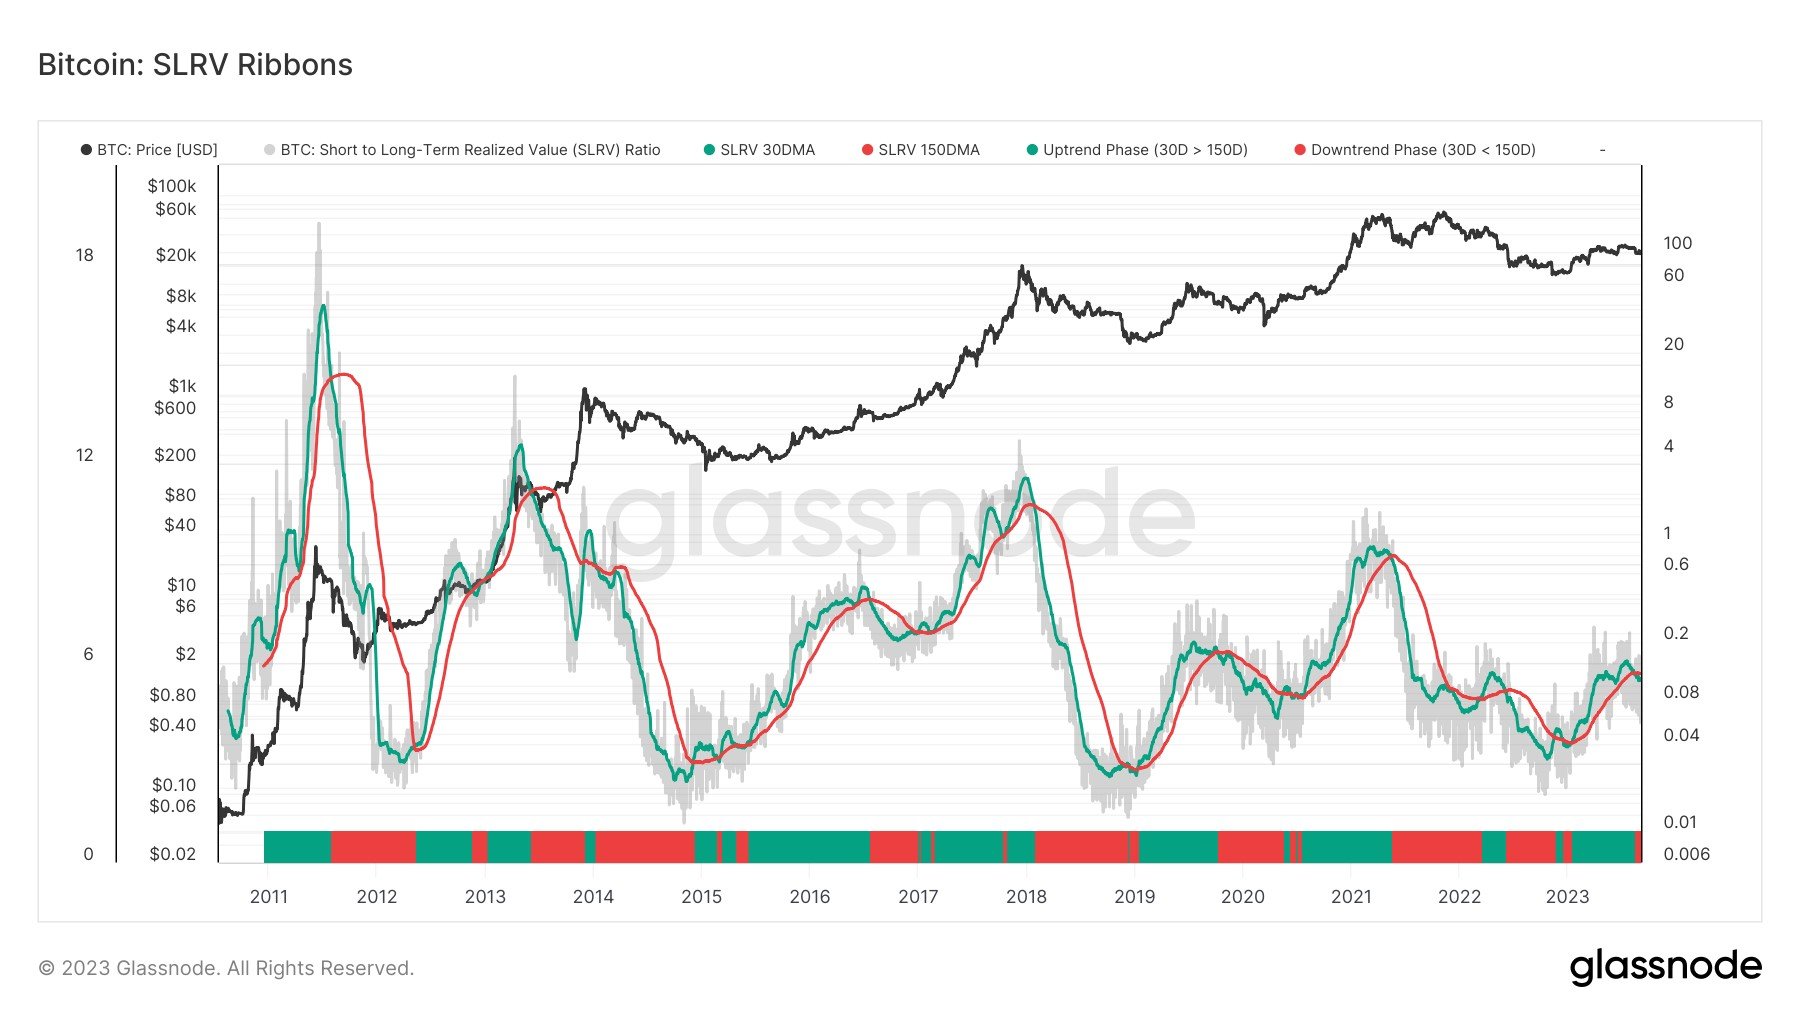 Bitcoin SLRV Ratio chart. Source: James Straten/X
Speculators reduce BTC exposure
Earlier analyses have focused on the behavior of different Bitcoin investor groups.
Related: Bitcoin speculators now hold the least BTC since the $69K all-time highs
Particular attention is being paid to those holding BTC for 155 days or less, referred to as short-term holders (STHs) or speculators, in contrast to long-term holders.
The short-term holder cost basis — the total price at which STHs acquired their portion of the BTC supply — previously served as market support, but this seems to no longer be valid.
Currently, the STH cost basis is above the spot price, with Straten indicating that speculators have been selling off their holdings at a loss since late August.
Data from CryptoQuant illustrates the price at which various coins involved in transactions were last moved.
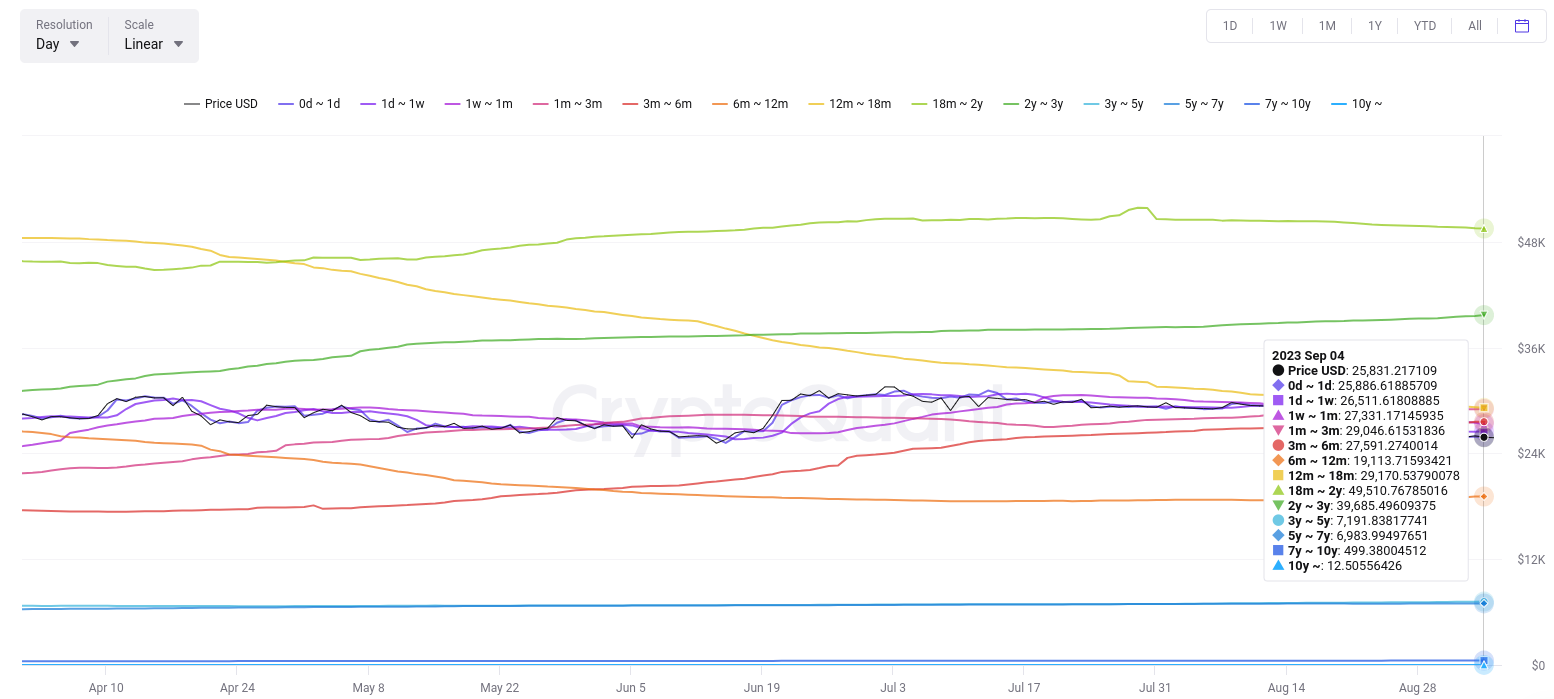 Bitcoin transaction realized price by age band chart (screenshot). Source: CryptoQuant
This article does not provide investment advice or recommendations. Every investment and trading decision carries risk, and readers should perform their own research before making any choices.