Disclaimer: Information found on CryptoreNews is those of writers quoted. It does not represent the opinions of CryptoreNews on whether to sell, buy or hold any investments. You are advised to conduct your own research before making any investment decisions. Use provided information at your own risk.
CryptoreNews covers fintech, blockchain and Bitcoin bringing you the latest crypto news and analyses on the future of money.

- Bitcoin has decreased by 11% over the last 30 days.
- Traders are observing historical rally similarities during the 2023 bear market.
In the fourth quarter of 2023, Bitcoin, the cryptocurrency with the highest market capitalization, encountered persistent bearish pressure that reverberated across the market. As September commenced, BTC found itself engaged in a struggle for stability, with prices fluctuating between $26,409 and a low of $25,404, representing its lowest level in almost five months. This resulted in an 11% decline over the past month.
Despite the challenges, Bitcoin continued to draw global interest with expectations for 2024. The upcoming Bitcoin halving and the anticipated SEC approval of Bitcoin ETFs are seen as potential catalysts for transforming the cryptocurrency landscape.
In the meantime, traders and investors have drawn comparisons between the current downturn and Bitcoin’s historical declines in 2015-16 and 2019-20, during which the cryptocurrency staged remarkable recoveries, fostering optimism among dedicated investors.
Additionally, some analysts suggest that the April 2024 block subsidy halving could mark a pivotal moment for Bitcoin’s price trajectory. There are speculations that BTC/USD could rise to $46,000 by that time, although risks of further losses remain.
According to Bitcoin’s monthly returns chart, BTC has experienced six consecutive “negative Septembers” since 2016. Among these years, 2019 recorded the largest loss at 13.47%, while losses in 2022 were comparatively lower at 3.12%. This historical backdrop leads the community to ponder whether bearish sentiment will intensify.
Related Posts
Recent data from the analytics firm IntoTheBlock has highlighted the activities of significant Bitcoin holders. Addresses that own at least 0.1% of all circulating Bitcoin, valued at over $500 million, have seen an impressive $1.5 billion increase in their holdings during the last two weeks of August.
Where is The Price of BTC Headed?
An examination of Bitcoin’s recent price trends indicates a prevailing bearish pattern on the daily chart. The 50-day exponential moving average (EMA) currently stands at $27,428, reflecting the dominant bearish sentiment. With the daily relative strength index (RSI) at 42, Bitcoin is approaching oversold conditions. Additionally, it has experienced a slight increase in trading volume, which has risen by 4.68% in the past 24 hours.
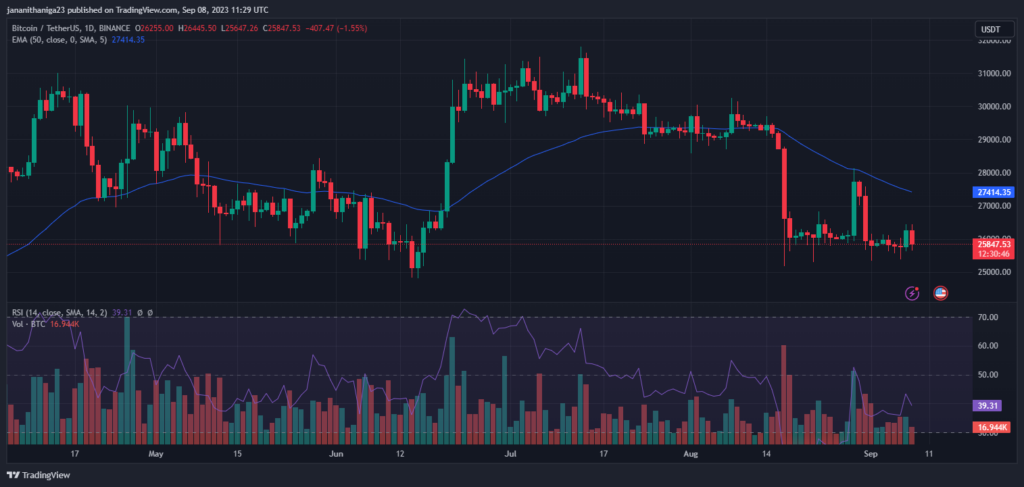 BTC/USD Daily Price Chart — MA, RSI (Source: TradingView)
This indicates that bears are taking advantage of rallies near $1,650, and this narrow-range trading may not last much longer. If the price continues to fall below $1,600, it could indicate that bears are gaining control, with minor support at $1,550, and a potential further decline to $1,368.
On the upside, bears are anticipated to vigorously defend the area around $1,650. If buyers succeed in breaching this resistance, there is potential for the pair to rise towards the 50-day SMA at $1,772.
Will BTC Break its Bearish Pressure? Share your thoughts by tweeting us at @The_NewsCrypto