Disclaimer: Information found on CryptoreNews is those of writers quoted. It does not represent the opinions of CryptoreNews on whether to sell, buy or hold any investments. You are advised to conduct your own research before making any investment decisions. Use provided information at your own risk.
CryptoreNews covers fintech, blockchain and Bitcoin bringing you the latest crypto news and analyses on the future of money.
On September 7, Bitcoin (BTC) tested a significant long-term trendline as the strength of the U.S. dollar reached its highest point in six months.
 BTC/USD 1-hour chart. Source: TradingView
Bitcoin’s Position Relative to the 200-Week Moving Average Raises a Key Question
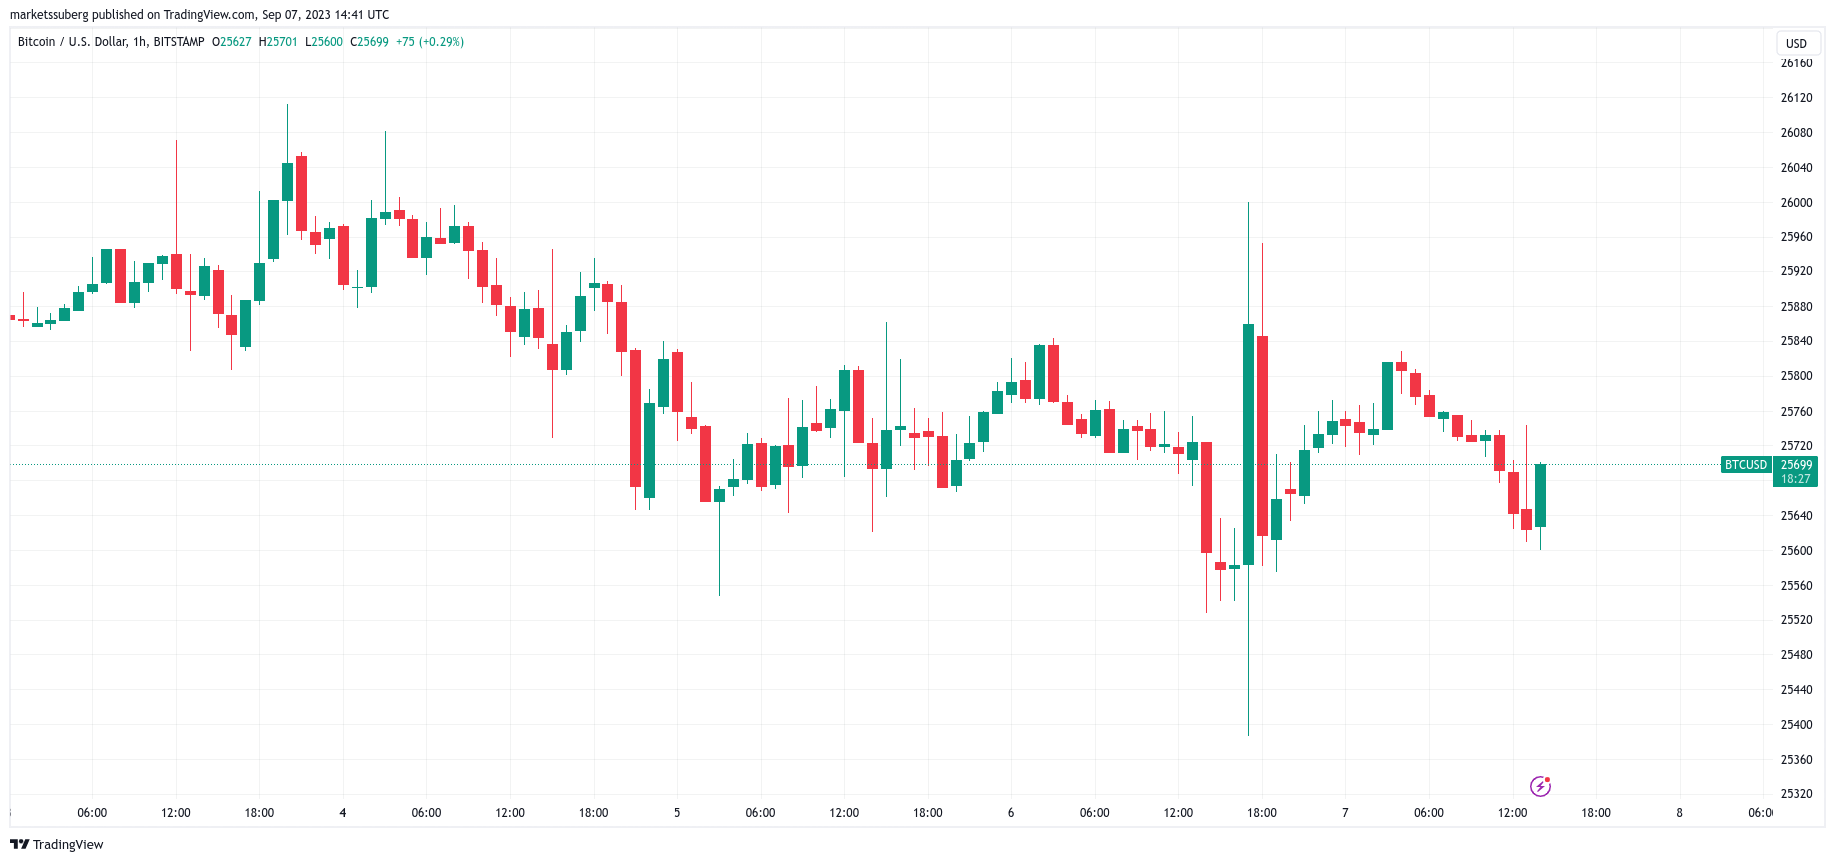
Data from Cointelegraph Markets Pro and TradingView indicated that BTC price movements were centered around the $25,700 mark.
Market conditions were less turbulent compared to the previous day, which experienced fluctuations reaching $26,000 and local lows below $25,400 within a single hourly candle.
Participants in the Bitcoin market remained generally cautious, with increasing speculation about potential further declines.
#Bitcoin Open Interest is rising once more.
It appears to be preparing for another wick that may liquidate some positions soon. It seems primarily to be shorts pursuing price at this stage. pic.twitter.com/lr3VYtxu7F— Daan Crypto Trades (@DaanCrypto) September 7, 2023
“$BTC – unless we reclaim May’s low, I still anticipate lower,” noted popular trader TraderSZ in a message to X subscribers on that day.
“I have taken a short position here at half size, targeting 23.6k. If we reclaim May’s low, I will consider scaling out.”
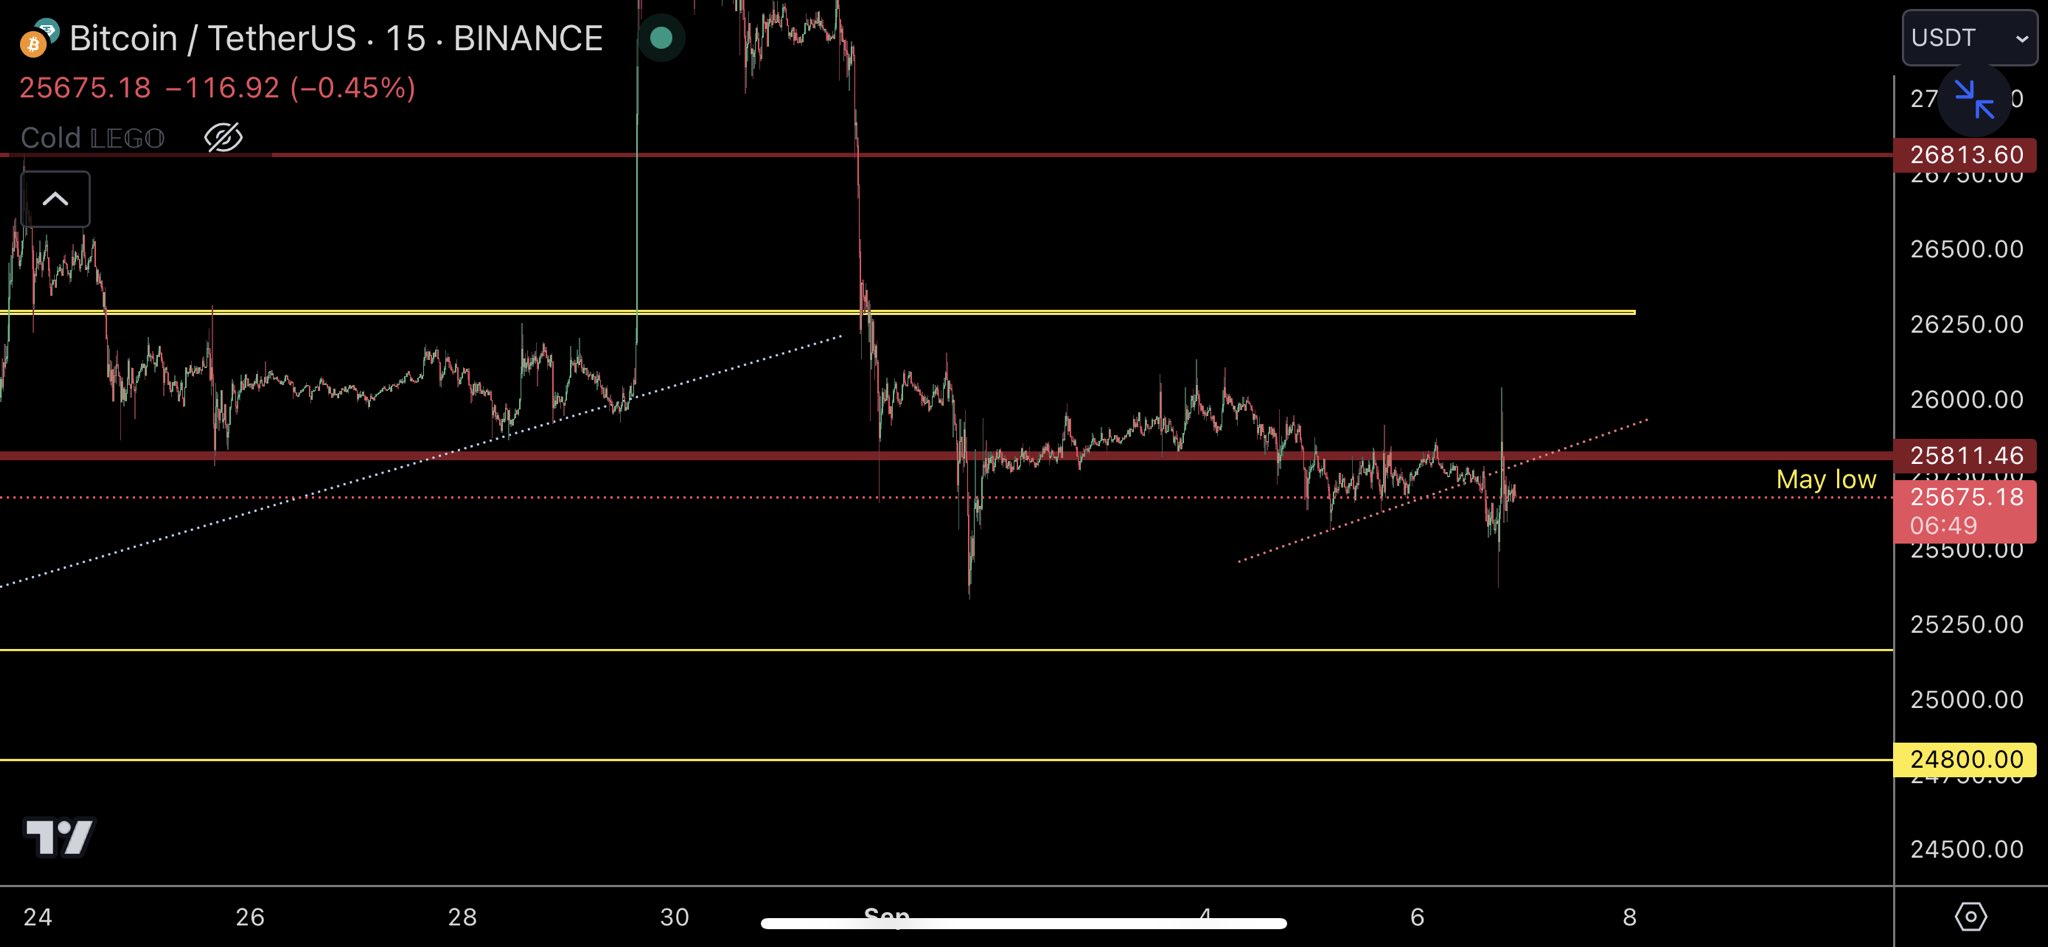 BTC/USD annotated chart. Source: TraderSZ/X
Michaël van de Poppe, founder and CEO of trading firm Eight, highlighted the 200-week exponential moving average (EMA) at $25,670 as a crucial level to monitor on weekly charts.
“The key question is whether Bitcoin can maintain its position above the 200-Week EMA,” he summarized.
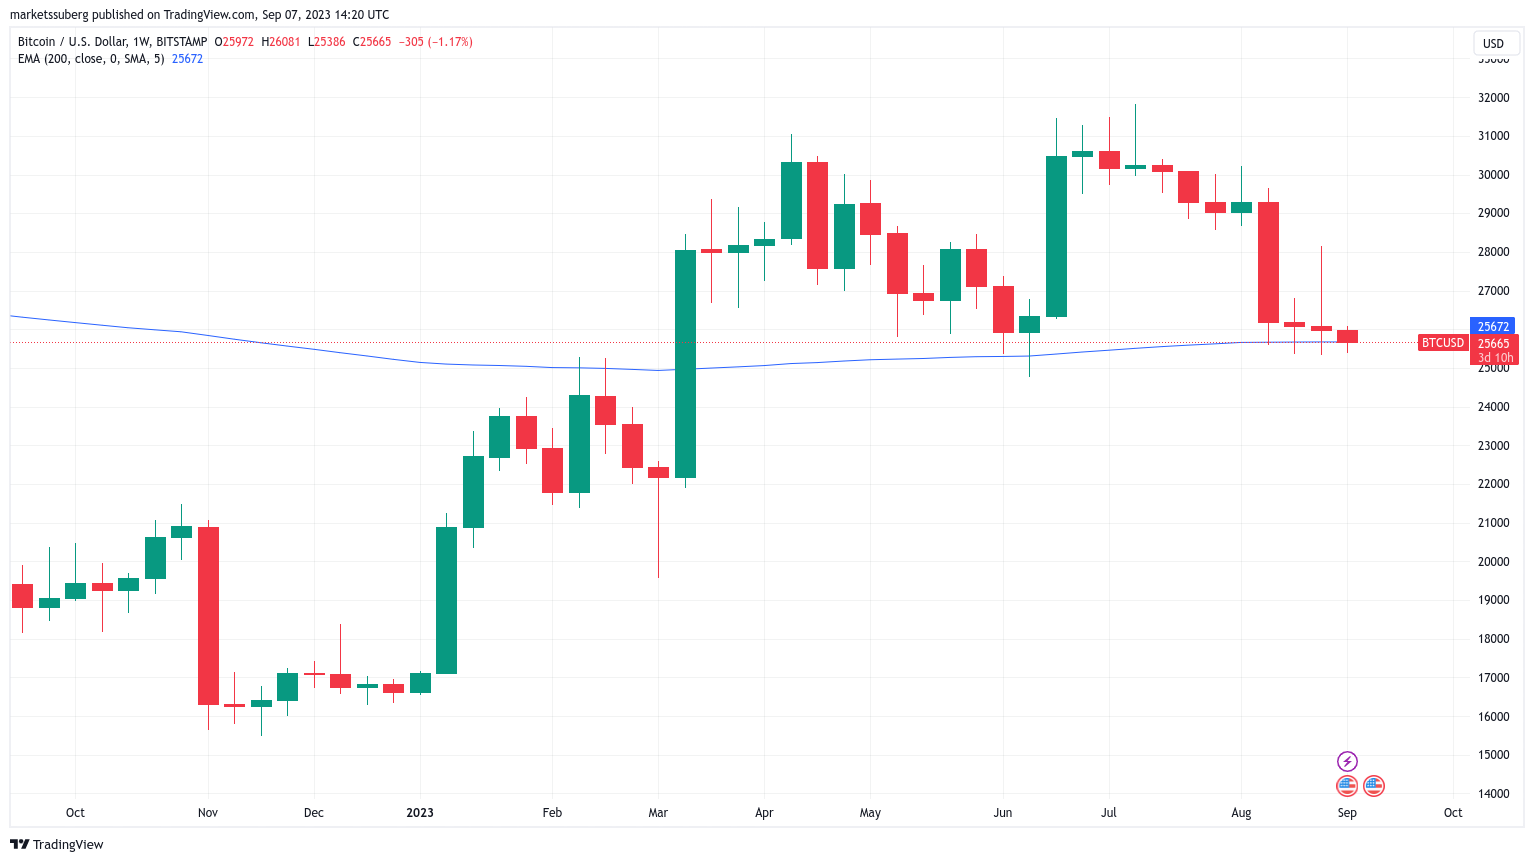 BTC/USD 1-week chart with 200EMA. Source: TradingView
Fellow trader and analyst Toni Ghinea was more definitive, predicting that Bitcoin would next target $25,000 and lower, with altcoins also expected to decline.
“I stated that 25k would occur. I mentioned that ALTS would reach new lows. I am now asserting that $BTC will drop to 19-23k,” he wrote in a post on X.
Related Posts
“This downward movement is far from finished. Disregard the ETF narrative. It is merely utilized to manipulate the market. Soon, it will be time to buy.”
Ghinea referred to the ongoing efforts to launch the first Bitcoin spot price exchange-traded fund (ETF) in the United States, which has been a significant source of low-timeframe volatility in recent weeks.
Dollar Strength Raises Concerns for Crypto and Risk Assets
Examining the broader market, the U.S. dollar presented a strong case for pressure on risk assets.
Related: Bitcoin price can hit $46K by 2024 halving — Interview with Filbfilb
The U.S. dollar index (DXY), having surpassed local highs from late May, reached 105.15 on that day — its highest level since March 10.
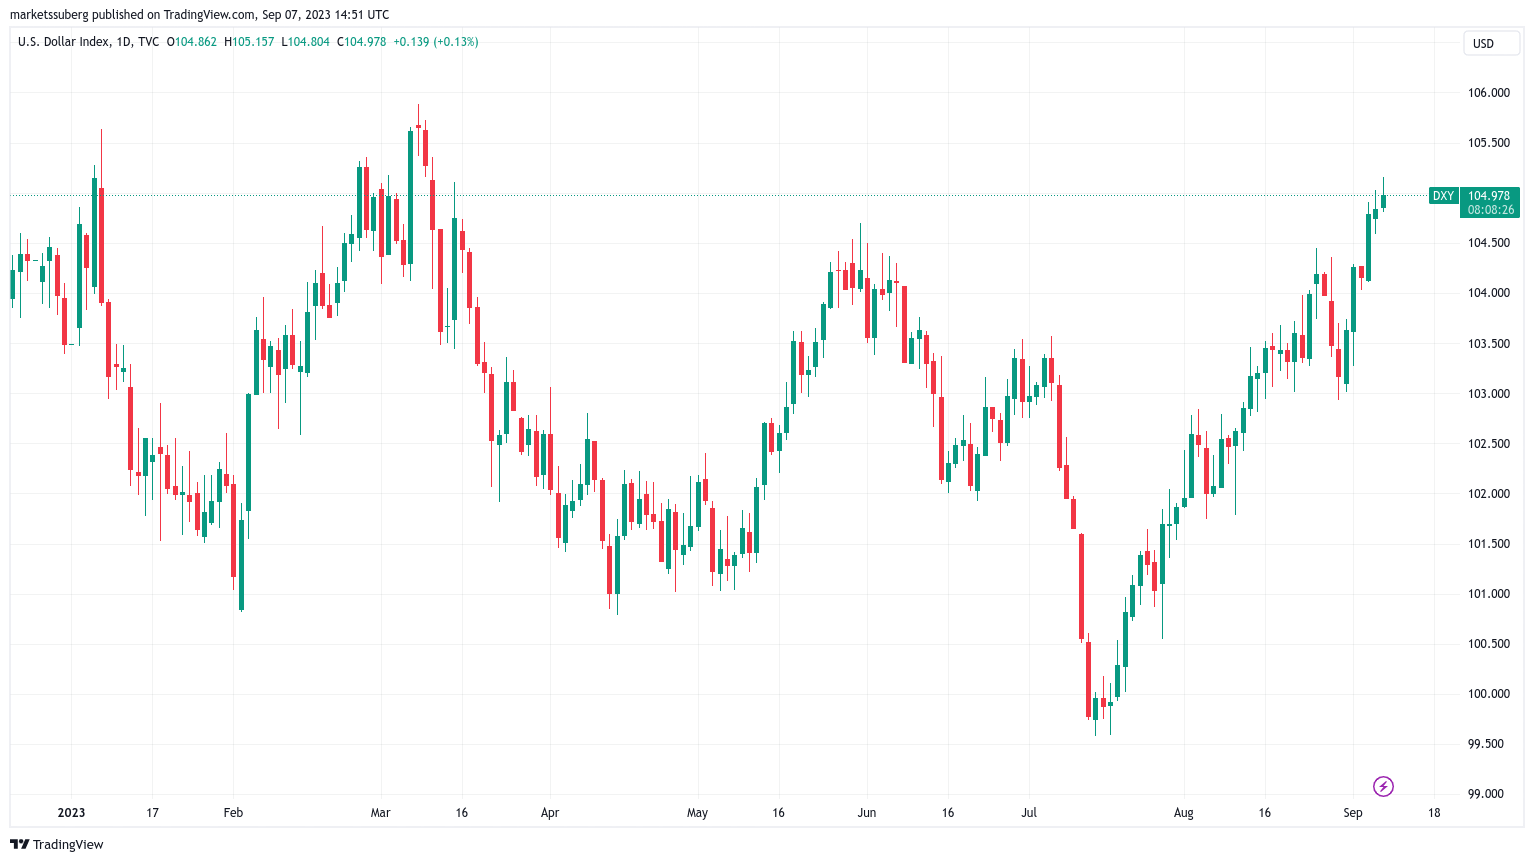 U.S. dollar index (DXY) 1-day chart. Source: TradingView
“This dollar rally will continue to exert pressure on risk assets, particularly those positioned higher on the risk spectrum (i.e., crypto),” analyst Benjamin Cowen noted in part of his analysis on X.
TraderSZ continued this narrative, predicting declines for U.S. equities due to the strength of the DXY.
$ES update. By combining the DXY outlook with the current positions of BTC and ETH, the analysis suggests further downside until proven otherwise https://t.co/oHYXhllzcp pic.twitter.com/87H7YhX98c
— TraderSZ (@trader1sz) September 7, 2023
“The price action for the U.S. Dollar Index DXY is extremely bullish (and thus bearish for financial assets),” added Caleb Franzen, senior analyst at Cubic Analytics.
“When it broke above the 200-day moving average cloud and the trendline from the 2022 highs, I indicated it was crucial to pay attention. Now we have converted them into support.”
An accompanying chart illustrated the DXY’s 200-day simple and exponential moving averages.
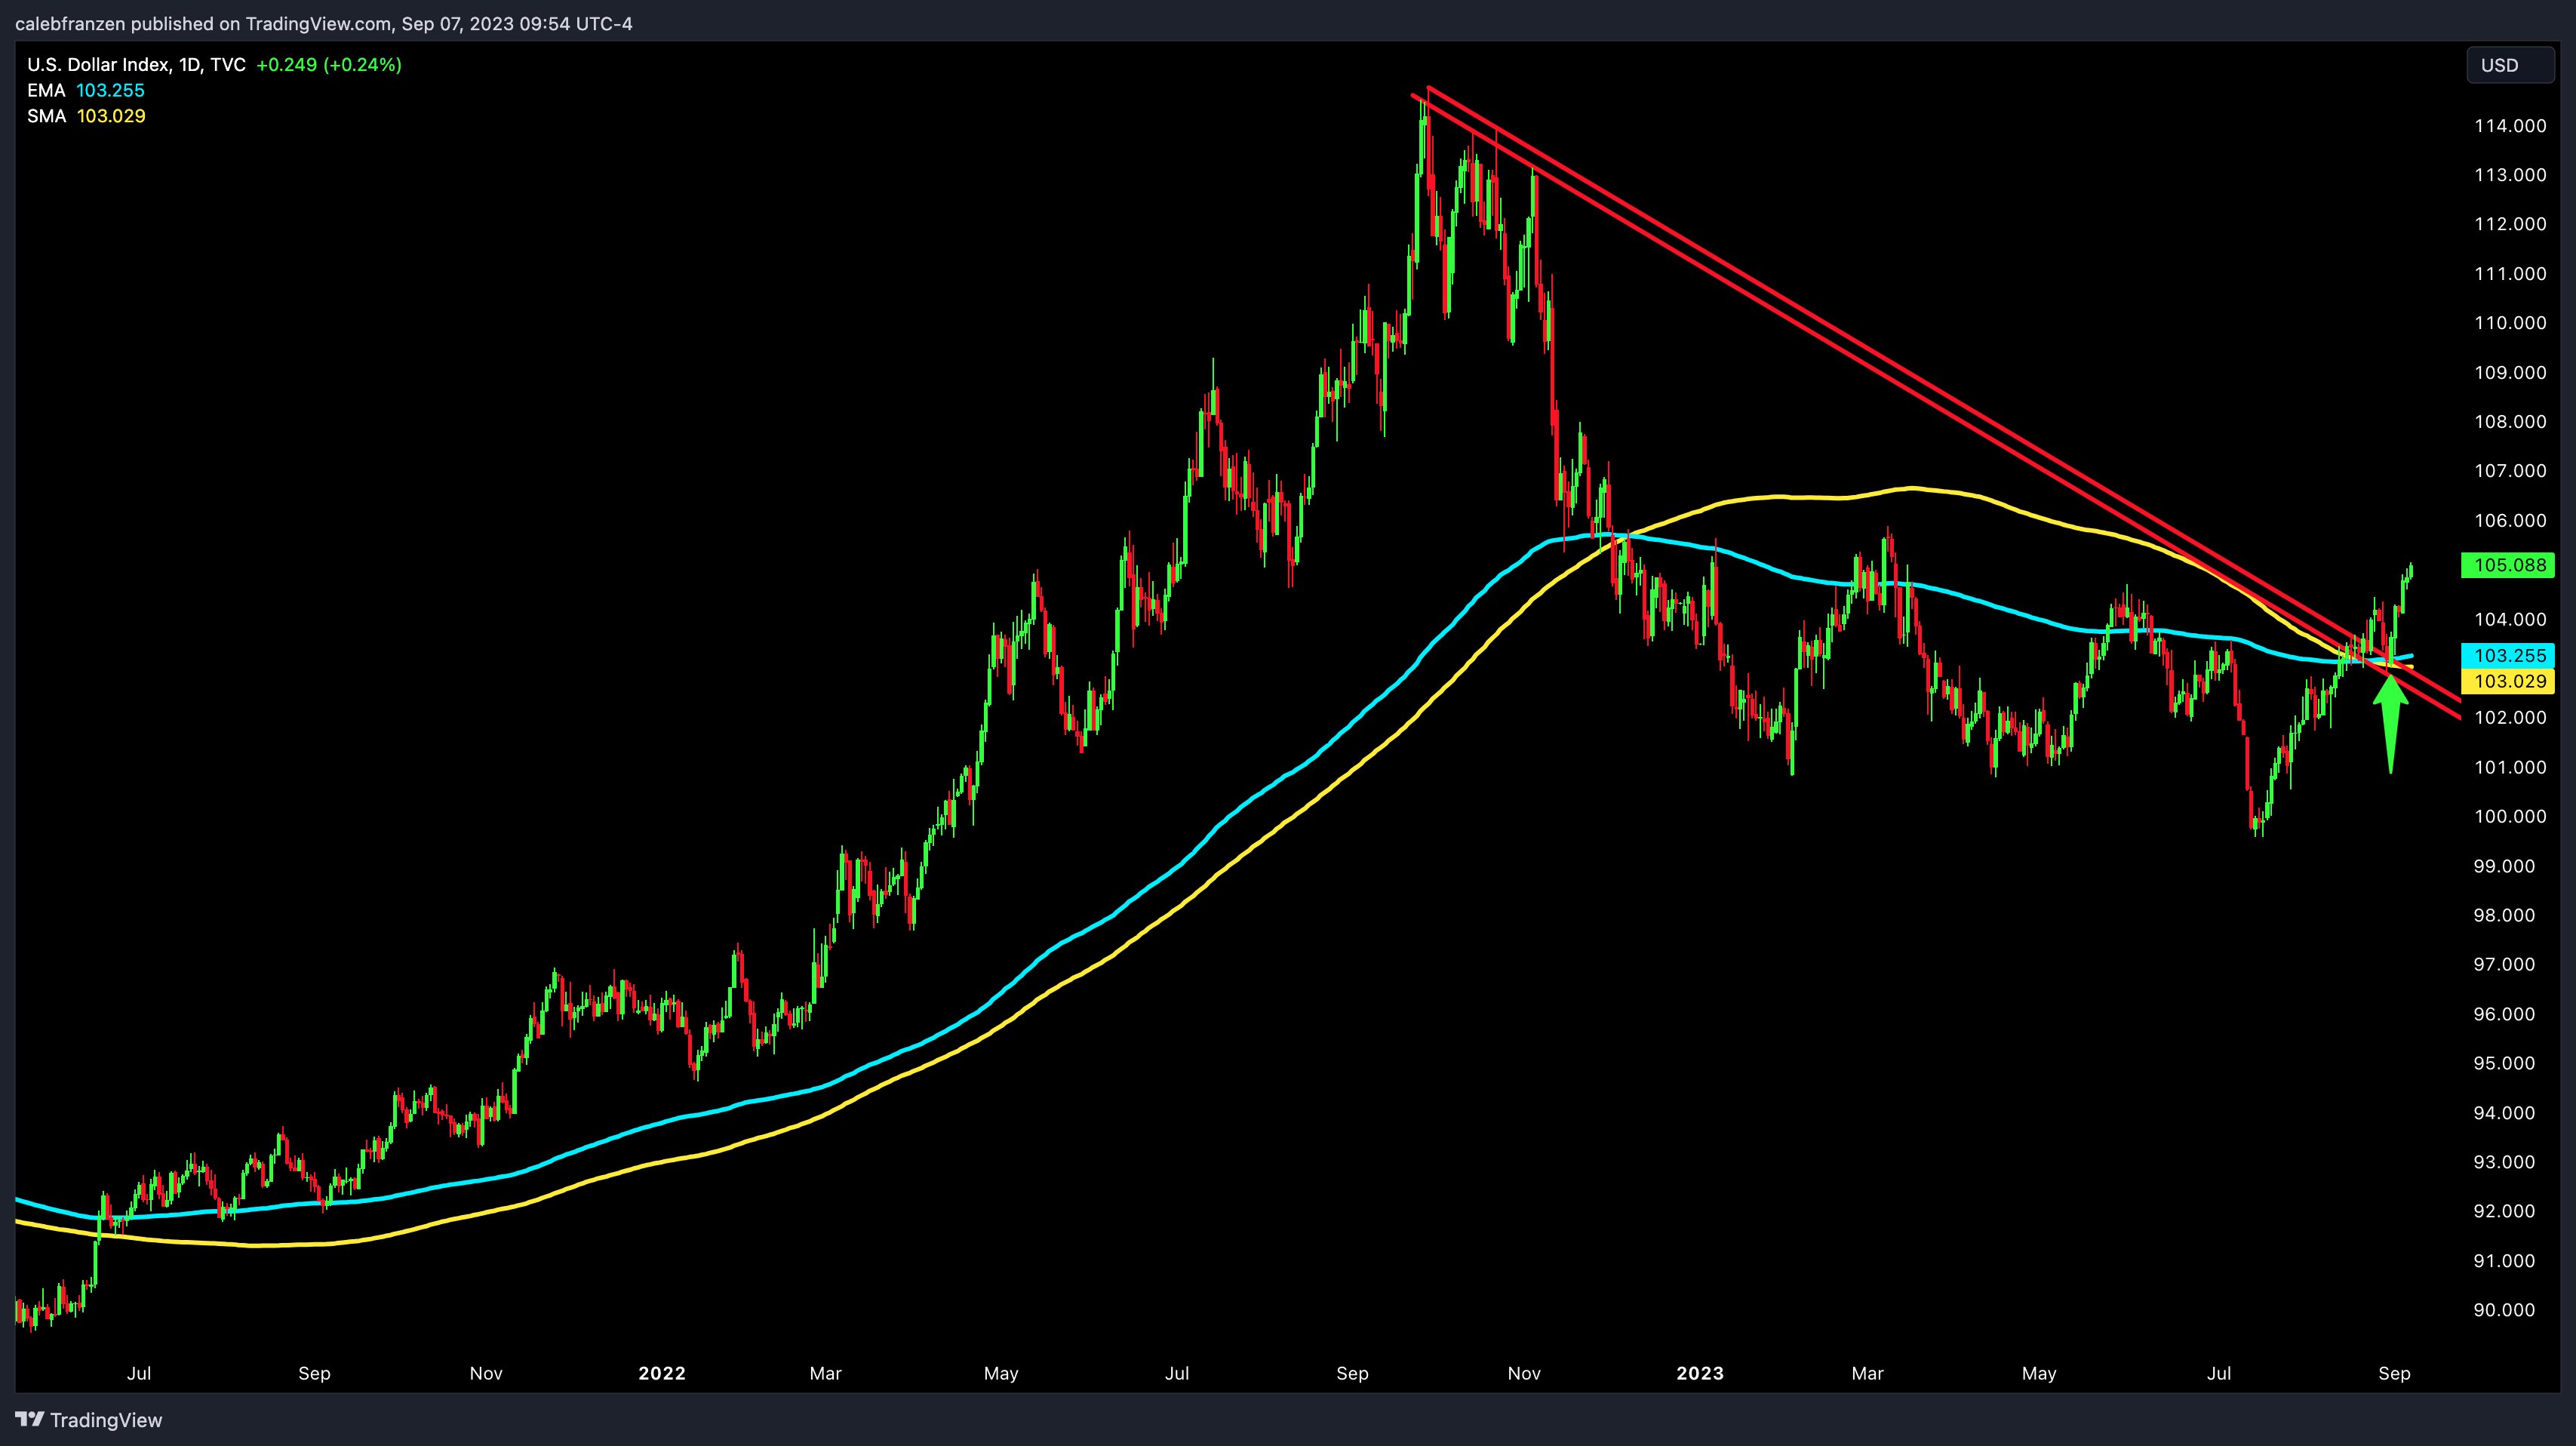 U.S. dollar index (DXY) chart with moving averages. Source: Caleb Franzen/X
This article does not provide investment advice or recommendations. Every investment and trading decision carries risk, and readers should perform their own research before making any choices.