Disclaimer: Information found on CryptoreNews is those of writers quoted. It does not represent the opinions of CryptoreNews on whether to sell, buy or hold any investments. You are advised to conduct your own research before making any investment decisions. Use provided information at your own risk.
CryptoreNews covers fintech, blockchain and Bitcoin bringing you the latest crypto news and analyses on the future of money.
Following the formation of consecutive Doji candlestick patterns on the weekly chart over the last three weeks, Bitcoin (BTC) is poised to conclude the week positively. This indicates an initial resolution of the uncertainty between bullish and bearish sentiments in favor of the bulls.
While the recovery remains in its nascent phase, the Federal Open Market Committee meeting scheduled for Sep. 20 may introduce increased volatility. Most market participants anticipate that the Federal Reserve will keep interest rates unchanged, but unexpected developments could emerge during Fed Chair Jerome Powell’s press conference after the rate announcement.
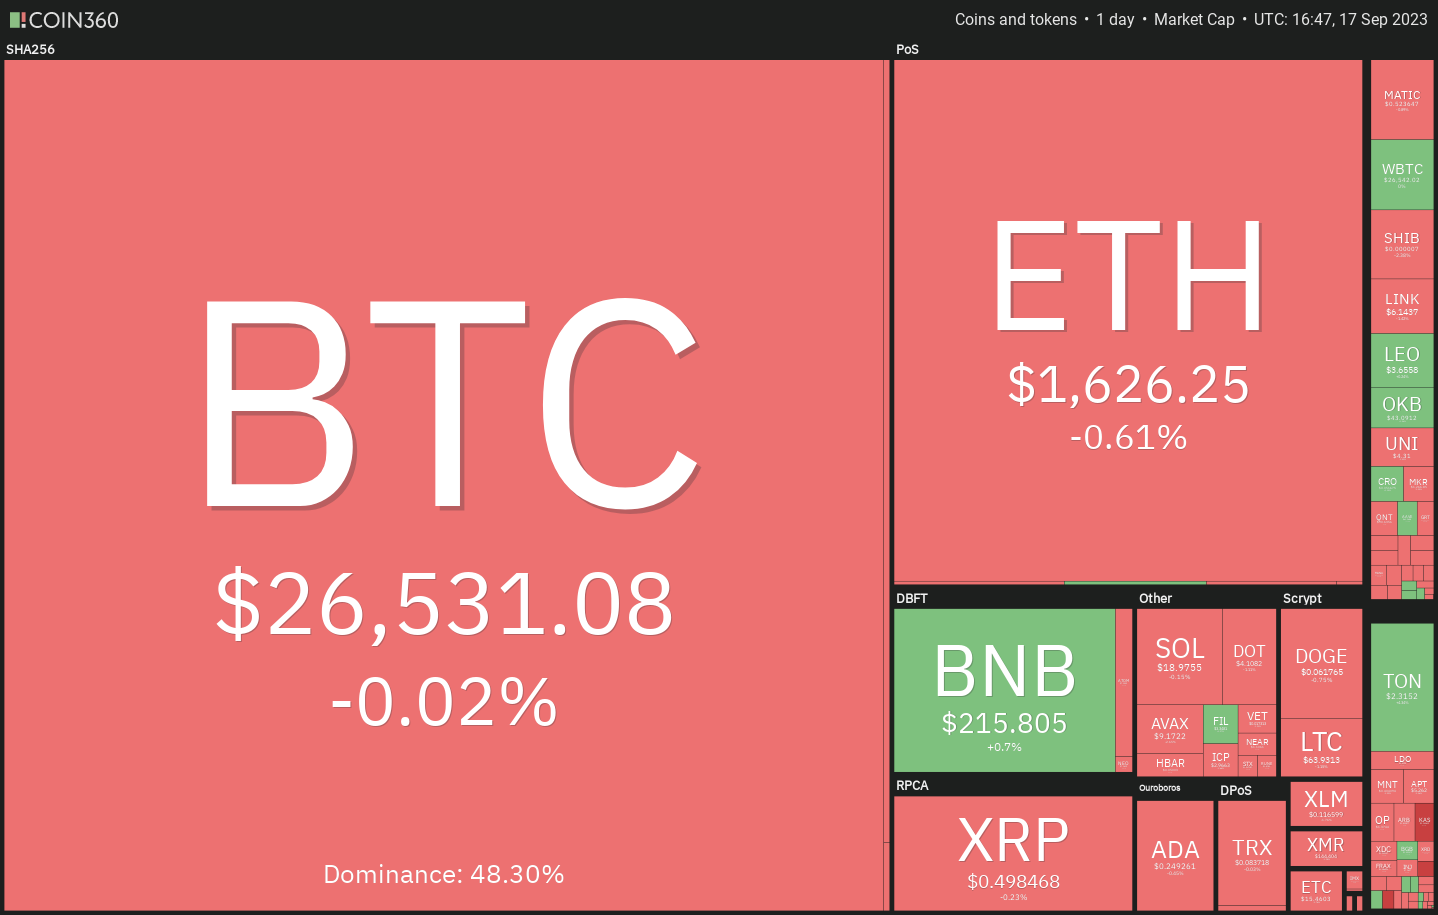 Crypto market data daily view. Source:Coin360
Bitcoin’s rebound from the robust support around $24,800 has sparked buying interest in certain altcoins, creating trading opportunities. For these altcoins to sustain their upward movement, Bitcoin must remain above $26,500.
Is it possible for Bitcoin’s relief rally to gain momentum, encouraging purchases in select altcoins? Let’s analyze the charts of the top five cryptocurrencies that are showing potential in the short term.
Bitcoin price analysis
On Sep. 14, Bitcoin surpassed the 20-day exponential moving average ($26,303), signaling a reduction in selling pressure. Since that time, the bulls have successfully countered multiple attempts by the bears to pull the price back below the 20-day EMA.
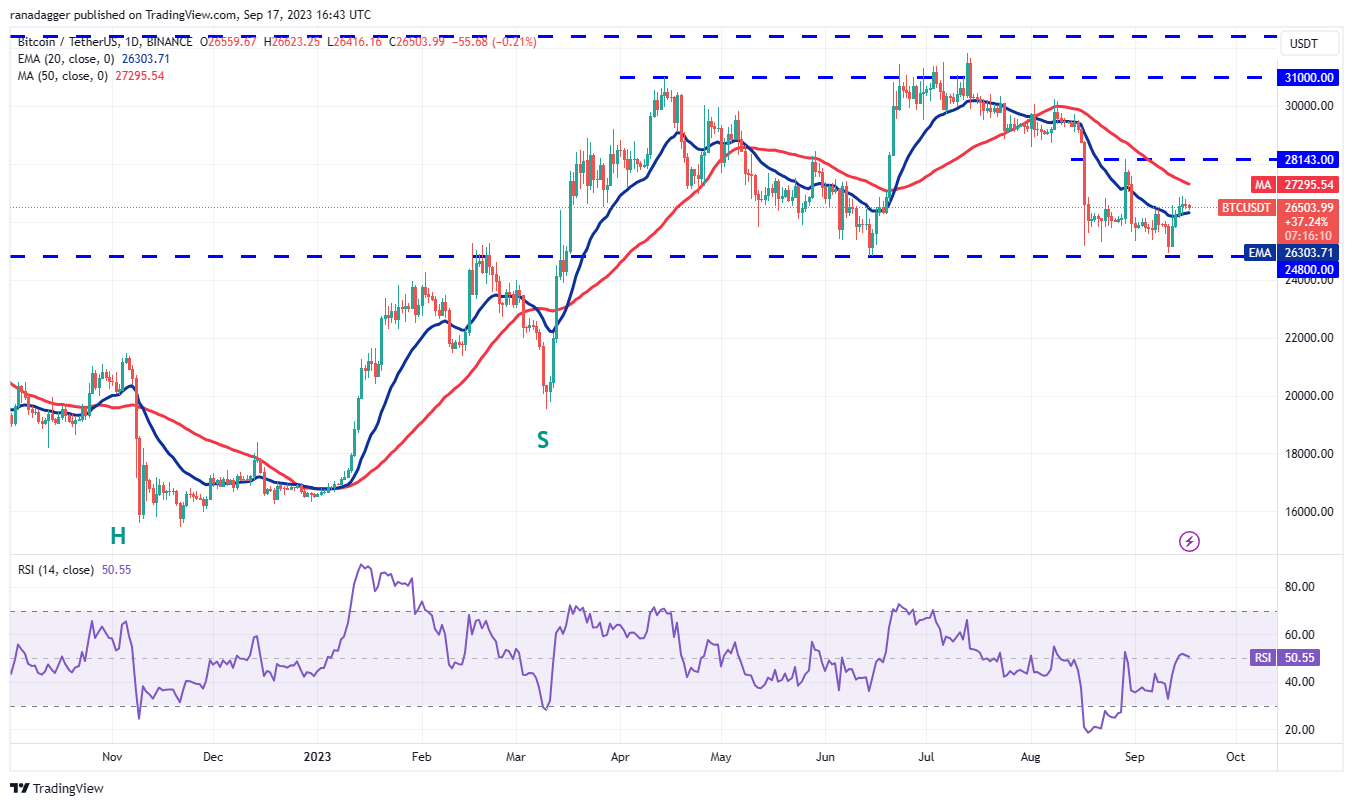 BTC/USDT daily chart. Source: TradingView
Buyers will aim to capitalize on their current advantage and push the BTC/USDT pair toward the 50-day simple moving average ($27,295). This level may present a minor obstacle, but if surpassed, the pair could reach $28,143. The bears are expected to defend this level vigorously.
For the bears to maintain their dominance, they must drive the price below the 20-day EMA. Such a move could trap aggressive bulls and potentially lead to a retest of the critical support at $24,800.
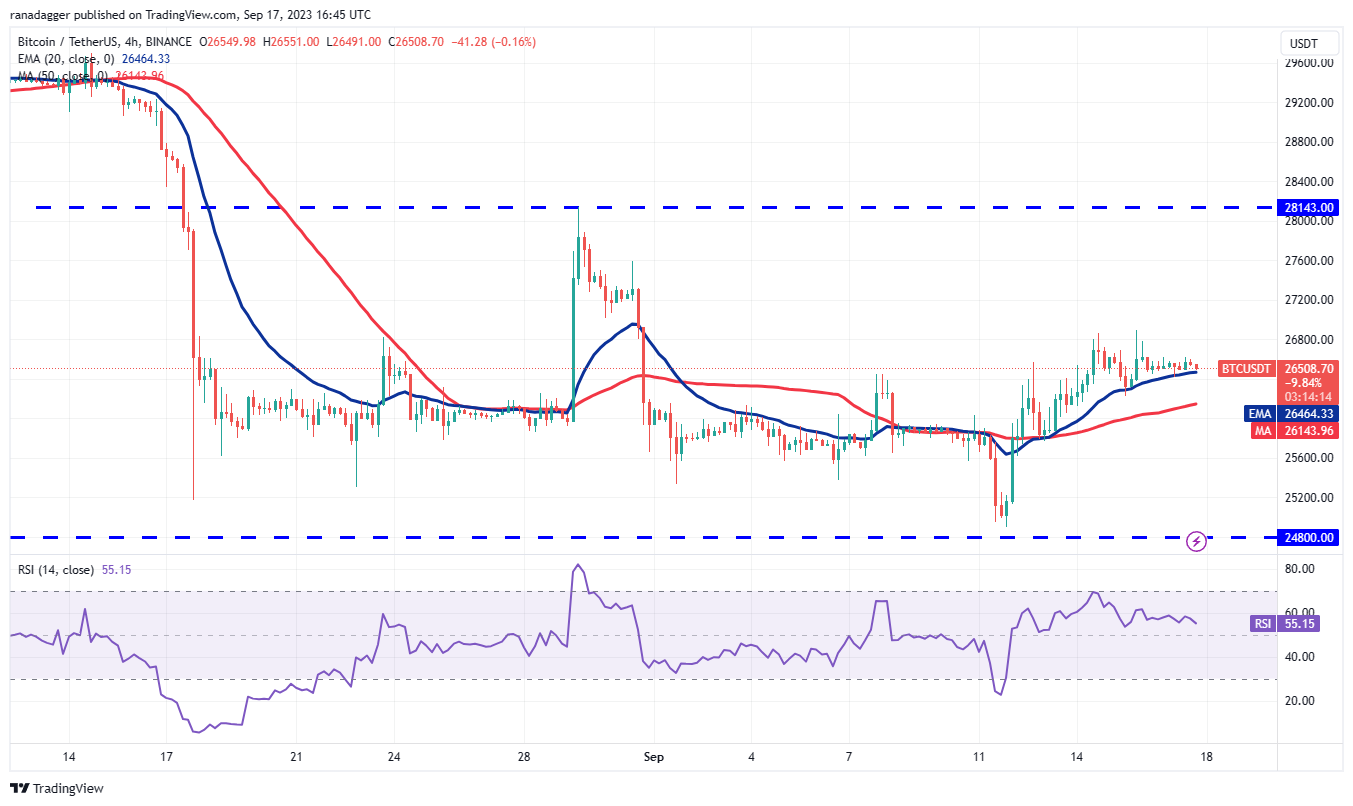 BTC/USDT 4-hour chart. Source: TradingView
The price has been trading above the 20-EMA on the 4-hour chart, indicating that bulls are buying during dips. This suggests that traders expect the recovery to persist. If buyers overcome the resistance at $26,900, the pair may rise to $27,600 and eventually to $28,143.
If bears intend to stage a comeback, they will need to push and maintain the price below the 20-EMA. Such a development would pave the way for a further decline to the 50-SMA and subsequently to the strong support zone between $25,600 and $25,300.
Maker price analysis
Buyers drove Maker (MKR) above the 50-day SMA ($1,162) on Sep. 15, indicating that bulls are attempting to take control.
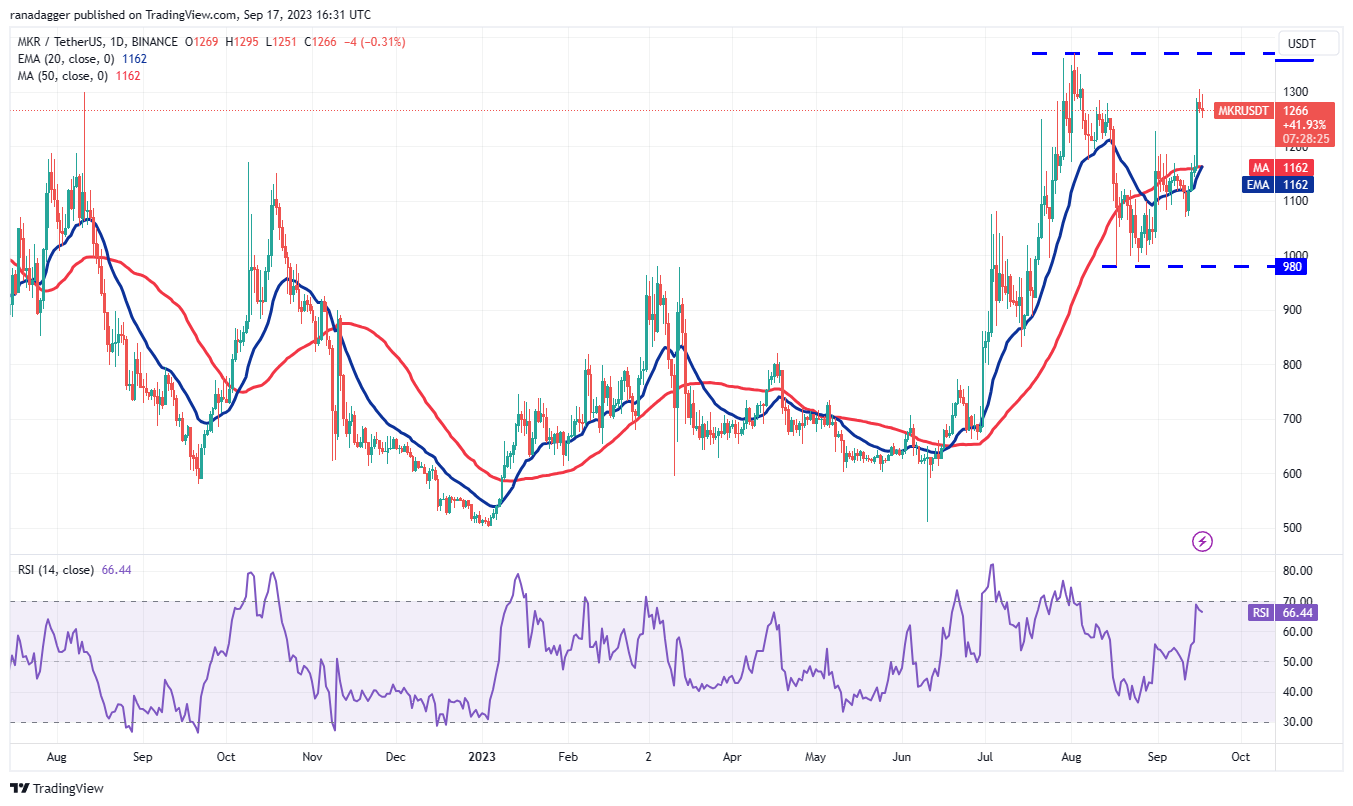 MKR/USDT daily chart. Source: TradingView
The MKR/USDT pair is targeting $1,370. This level is expected to see a fierce contest between bulls and bears. If the bulls maintain their position at this level, the chances of a breakout above it increase. Should this occur, the pair could gain momentum and surge toward $1,759.
The critical level to monitor on the downside is the 20-day EMA ($1,162). A breach of this level would indicate that the pair may oscillate within the broader range of $980 to $1,370 for a while.
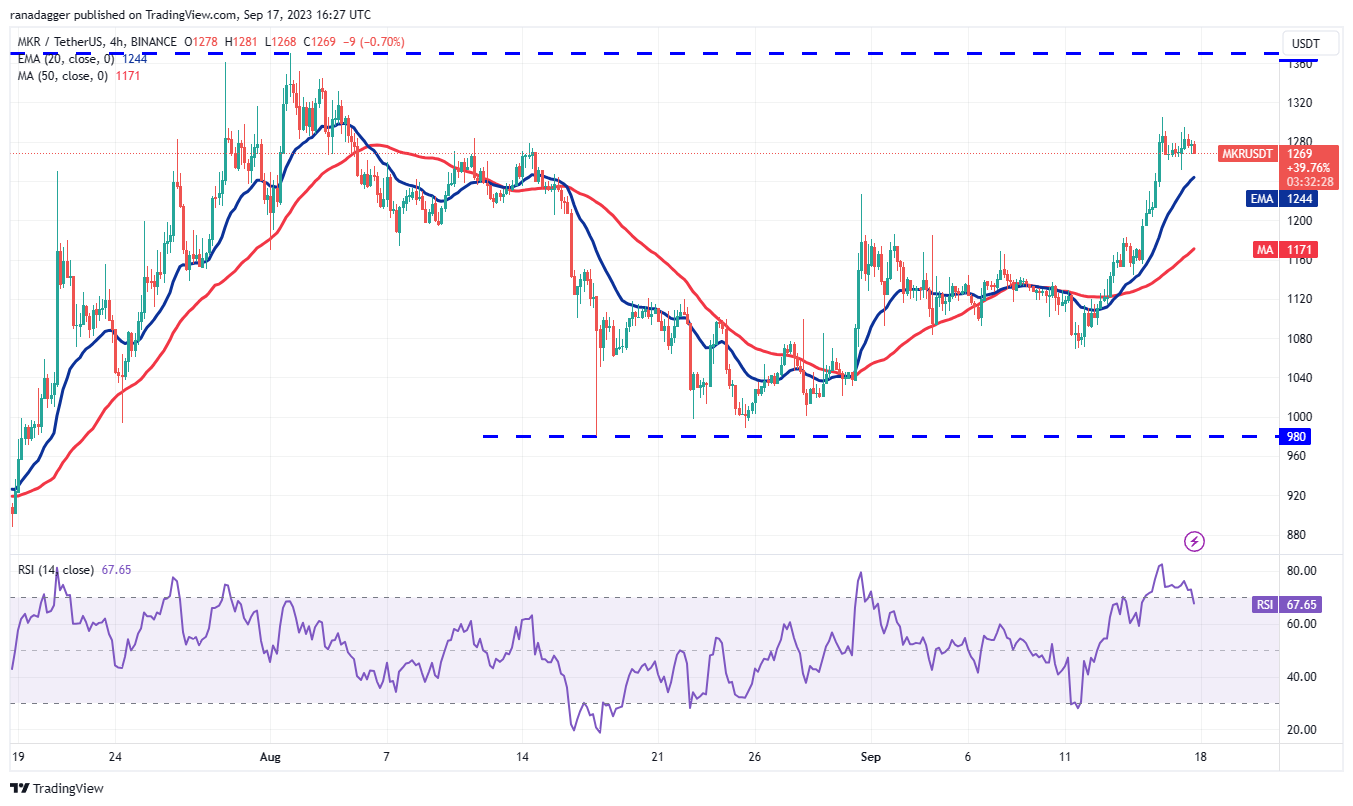 MKR/USDT 4-hour chart. Source: TradingView
The 4-hour chart indicates that bulls are still in control, but the RSI nearing overbought territory suggests a potential minor correction or consolidation soon. The 20-EMA is a key support level to watch on the downside. A break and close below it could signal the onset of a deeper correction toward the 50-SMA.
Conversely, if the price rebounds off the 20-EMA, it will indicate that bulls continue to buy during dips. This could initiate a rally toward the significant resistance at $1,370.
Aave price analysis
Aave (AAVE) surged past the moving averages on Sep. 16, signaling that bulls have made their move. However, the long wick on the day’s candlestick indicates selling pressure at higher levels.
Related Posts
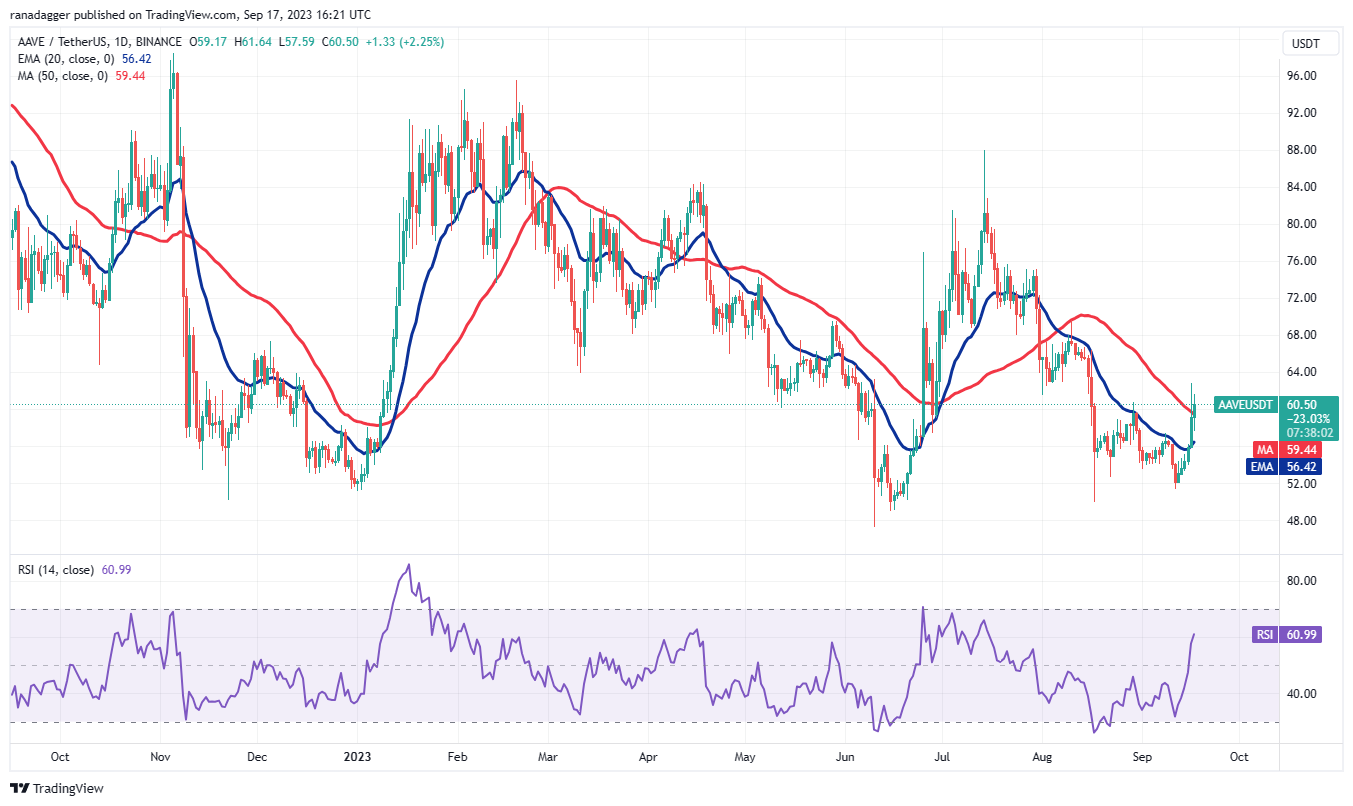 AAVE/USDT daily chart. Source: TradingView
A slight advantage for the bulls is that they have prevented the bears from regaining control and are again attempting to hold the price above the 50-day SMA ($59). If successful, the AAVE/USDT pair may accelerate toward $70 and later to $76.
The 20-day EMA ($56) is the crucial support to monitor in the near term. A drop below this level would suggest that bears are active at higher levels, potentially sinking the pair to the solid support at $48.
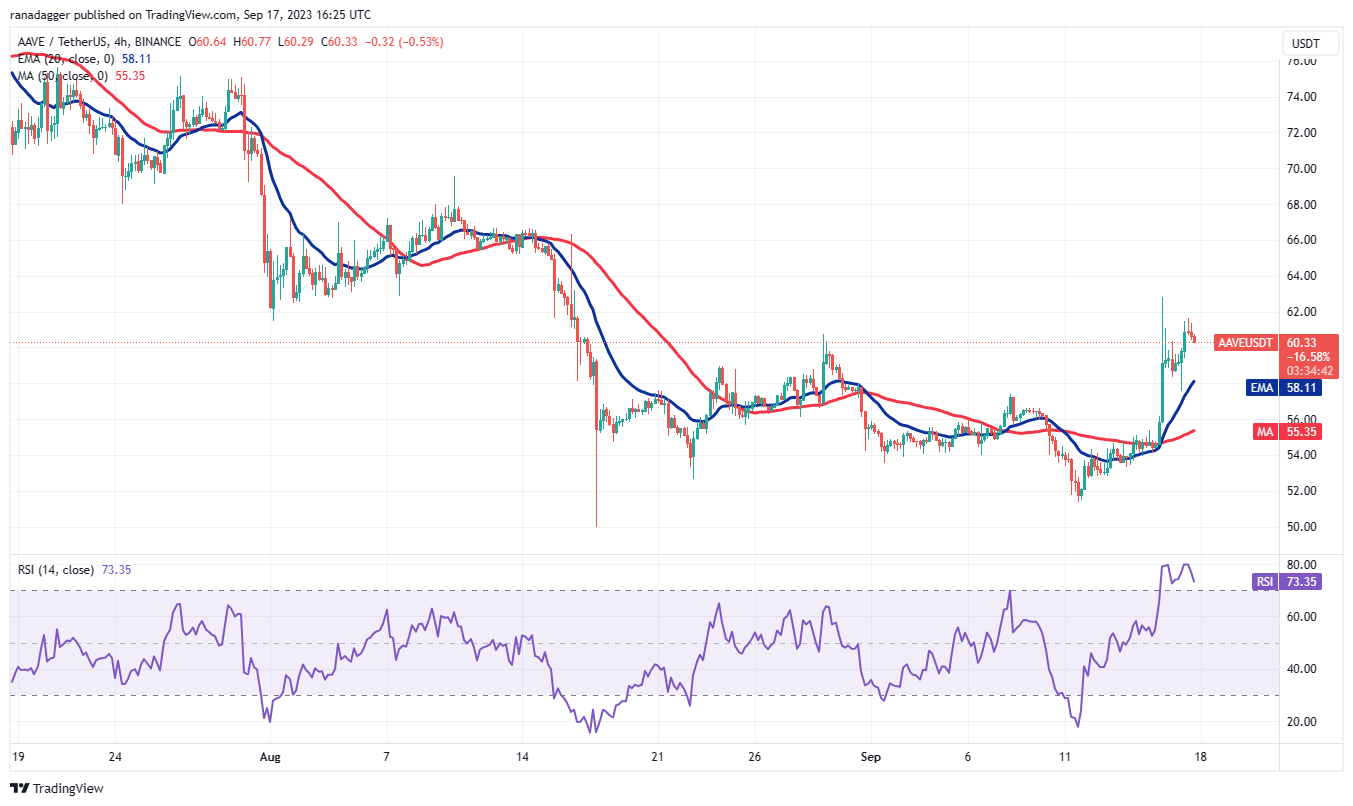 AAVE/USDT 4-hour chart. Source: TradingView
The 4-hour chart reveals that bulls recently bought the dip to the 20-EMA, indicating a shift in sentiment. Buyers will aim to push the price above the resistance at $63. If achieved, the pair could rise to $70.
In contrast, if the price declines and breaks below the 20-EMA, it would suggest that demand is waning at higher levels. The pair could then fall to the 50-SMA, which is a critical level for bulls to defend.
Related: How low can the Bitcoin price go?
THORChain price analysis
THORChain (RUNE) has demonstrated a notable recovery in recent days, indicating that buyers are attempting a resurgence.
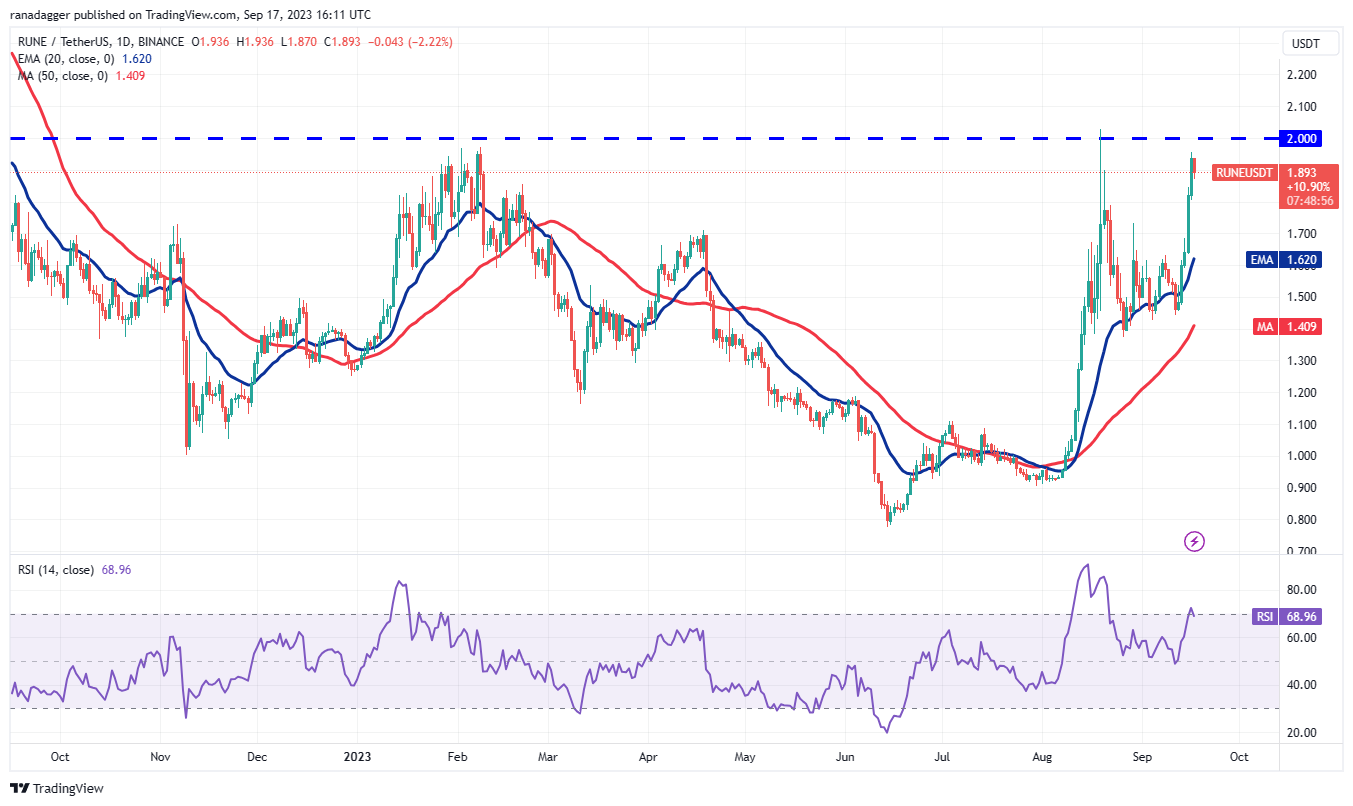 RUNE/USDT daily chart. Source: TradingView
The upward movement is approaching the solid resistance at $2, which is likely to serve as a significant barrier. A sharp decline from $2 would suggest that bulls are exiting their positions. This could pull the price down to the 20-day EMA ($1.62).
On the other hand, if the RUNE/USDT pair holds its ground at the current level, it will indicate that bulls are maintaining their positions in anticipation of further gains. If $2 is breached, the pair could initiate a new uptrend toward $2.30 and subsequently to $2.80.
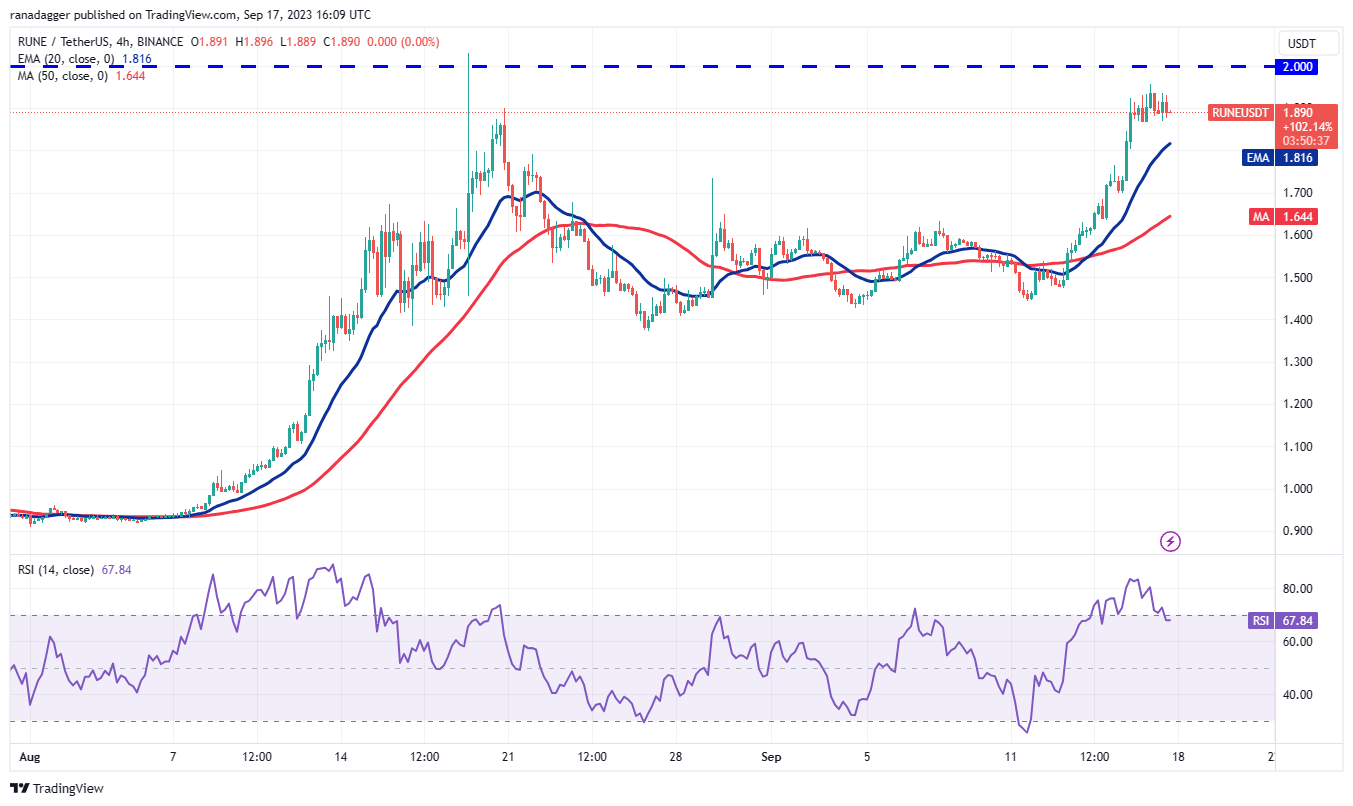 RUNE/USDT 4-hour chart. Source: TradingView
The 4-hour chart shows that the $2 level is acting as resistance. The price may retreat to the 20-EMA, which is expected to serve as strong support. If the price rebounds from this level with strength, bulls will once again attempt to surpass the barrier at $2. If successful, the pair may surge toward $2.30.
The first indication of weakness would be a break and close below the 20-EMA, which could prompt several short-term traders to take profits. The pair may then decline to the 50-SMA.
Render price analysis
Render (RNDR) broke out and closed above the 50-day SMA ($1.58) on Sep. 15, suggesting that selling pressure may be easing.
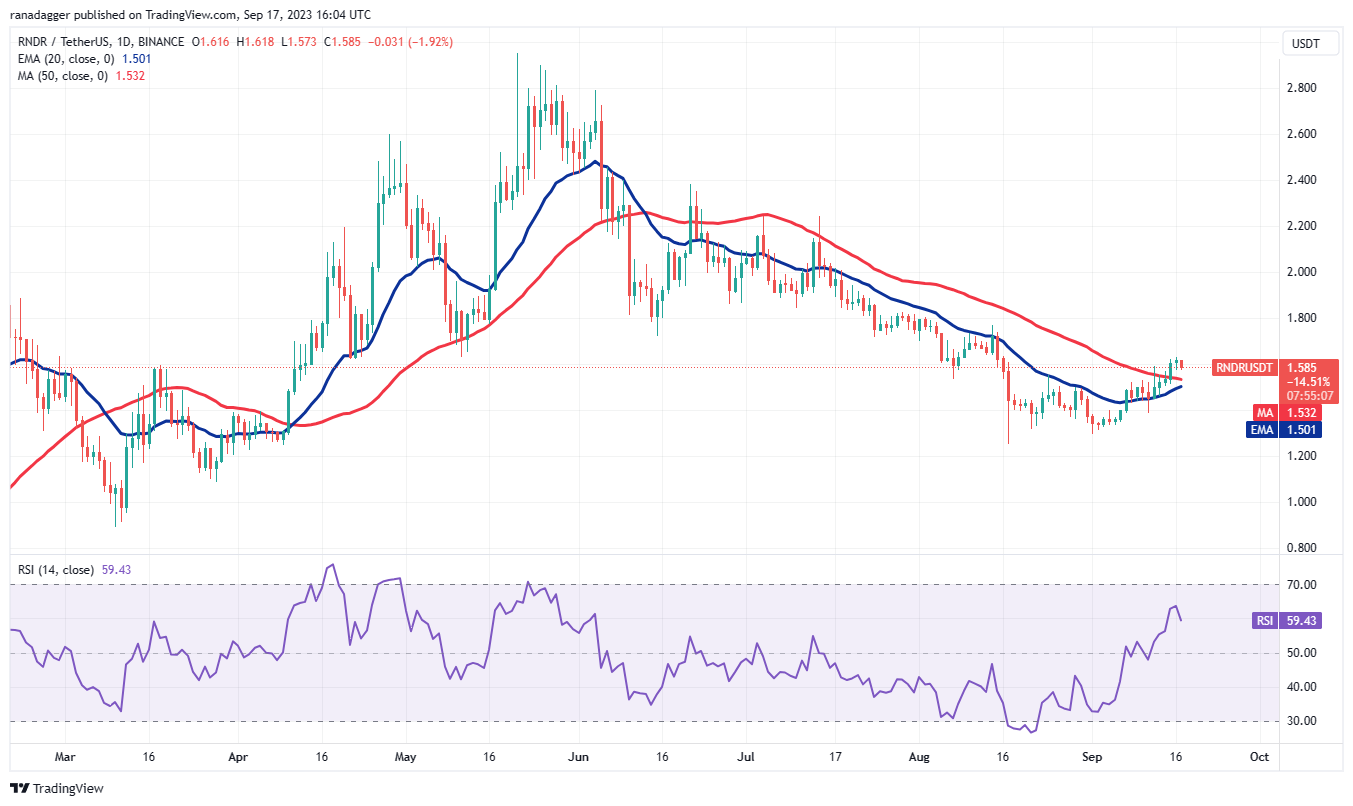 RNDR/USDT daily chart. Source: TradingView
The moving averages are nearing a bullish crossover, and the RSI is in positive territory, indicating that bulls have a slight advantage. If the price rises from the 20-day EMA ($1.50), it will suggest a shift in sentiment from selling on rallies to buying on dips. This could initiate a stronger recovery to $1.83 and then to $2.20.
This optimistic outlook could be invalidated in the short term if the price continues to decline and breaks below the moving averages. The RNDR/USDT pair could then drop to $1.38 and later to $1.29.
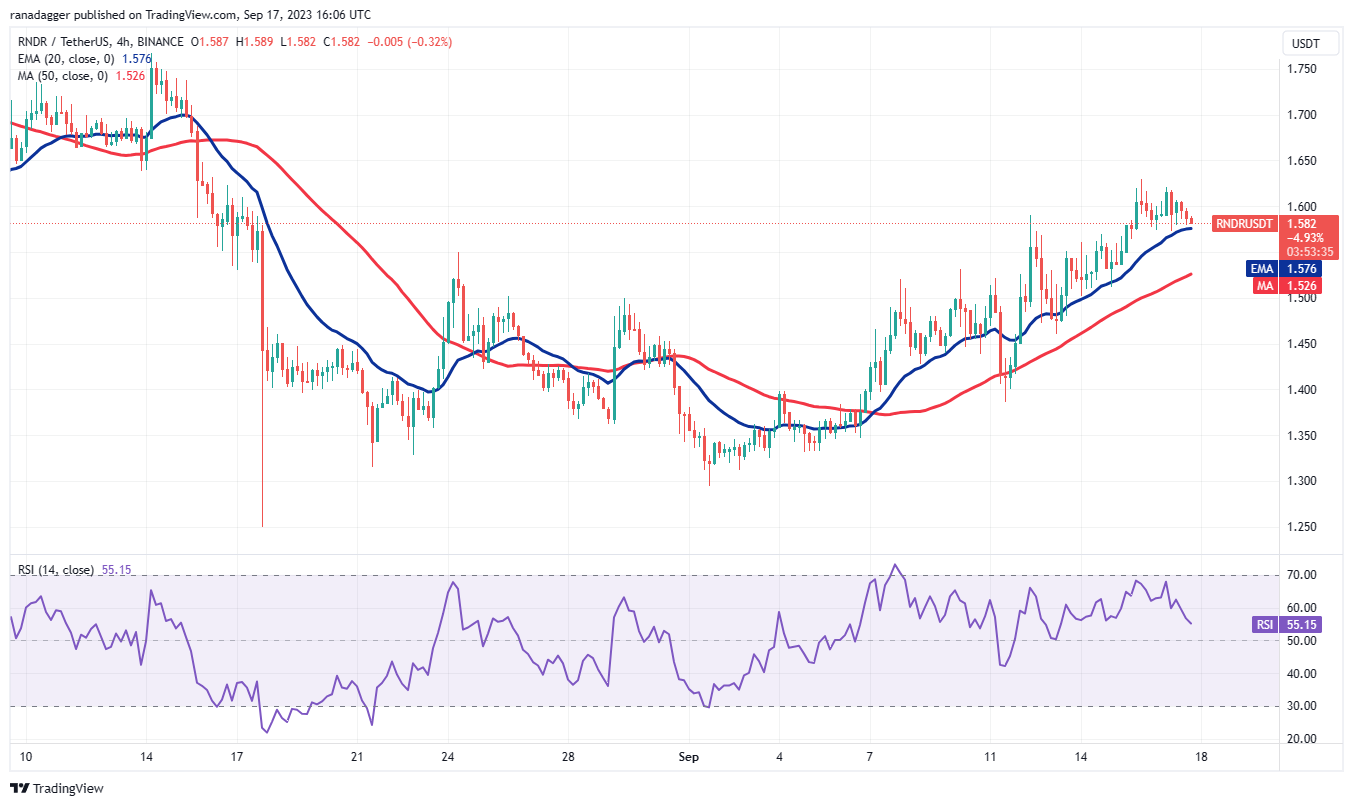 RNDR/USDT 4-hour chart. Source: TradingView
The moving averages on the 4-hour chart are trending upward, and the RSI is in positive territory, indicating an advantage for buyers. The first support to monitor on the downside is the 20-EMA. If the price rises from this level, it will signal that bulls continue to view dips as buying opportunities, increasing the likelihood of a rally to $1.77.
Conversely, if the 20-EMA fails, the pair could slide to the 50-SMA. This is a crucial level for bulls to protect, as a break below it may lead to a decline to $1.39.
This article does not contain investment advice or recommendations. Every investment and trading move involves risk, and readers should conduct their own research when making a decision.