Disclaimer: Information found on CryptoreNews is those of writers quoted. It does not represent the opinions of CryptoreNews on whether to sell, buy or hold any investments. You are advised to conduct your own research before making any investment decisions. Use provided information at your own risk.
CryptoreNews covers fintech, blockchain and Bitcoin bringing you the latest crypto news and analyses on the future of money.
Bitcoin has maintained a narrow trading range for almost 50 days – but this does not indicate a “bear flag.”
Prolonged range-bound price movement indicates structural consolidation instead of a classic bearish continuation, despite increasing downside risks.
 Matador waving flag to a bull. (Sternschnuppenreiter/Pixabay)
Key Points:
- Bitcoin has remained within a fluctuating trading range for nearly 50 days.
- Some analysts are labeling this price behavior as a “bear flag” — a bearish technical analysis formation that exacerbates sell-offs. However, this classification may be incorrect.
- The situation in 2026 differs from 2022, with robust support established between $50,000 and $70,000, and considerable accumulation supporting the current range.
Observers of bitcoin’s ‘s nearly 50-day erratic price movement through a bearish perspective may be misinterpreting the situation.
After reaching lows near $60,000 on February 6, bitcoin has largely fluctuated between $65,000 and $75,000, characterized more by stagnation than direction.
This period illustrates a scenario where investors face challenges not only from sharp declines but also from time, as extended sideways movement tests both bulls and bears with repeated false breakouts.
Not a Bear Flag
Related Posts
Some on social platforms are referring to this as a bear flag—a technical setup indicating a minor rebound within a broader downtrend. Bear flags typically rejuvenate bearish momentum, often resulting in a more significant sell-off.
Consequently, there is concern that this bear flag might deepen the bitcoin downtrend initiated in early October following price peaks exceeding $126,000.
However, this assessment could be inaccurate since bear flags, according to conventional technical analysis principles, are brief pauses lasting a few days that resolve bearishly, prolonging the downtrend.
The current consolidation has persisted for nearly 50 days, significantly longer than a standard bear flag. This duration implies that bears are no longer dominant, and the market is evenly poised, with neither side eager to push the price. This showcases a typical indecision pattern.
This does not eliminate the possibility of a more significant sell-off, as seen following the December-January consolidation, but it reframes the current market behavior as indecisive instead of structurally bearish.
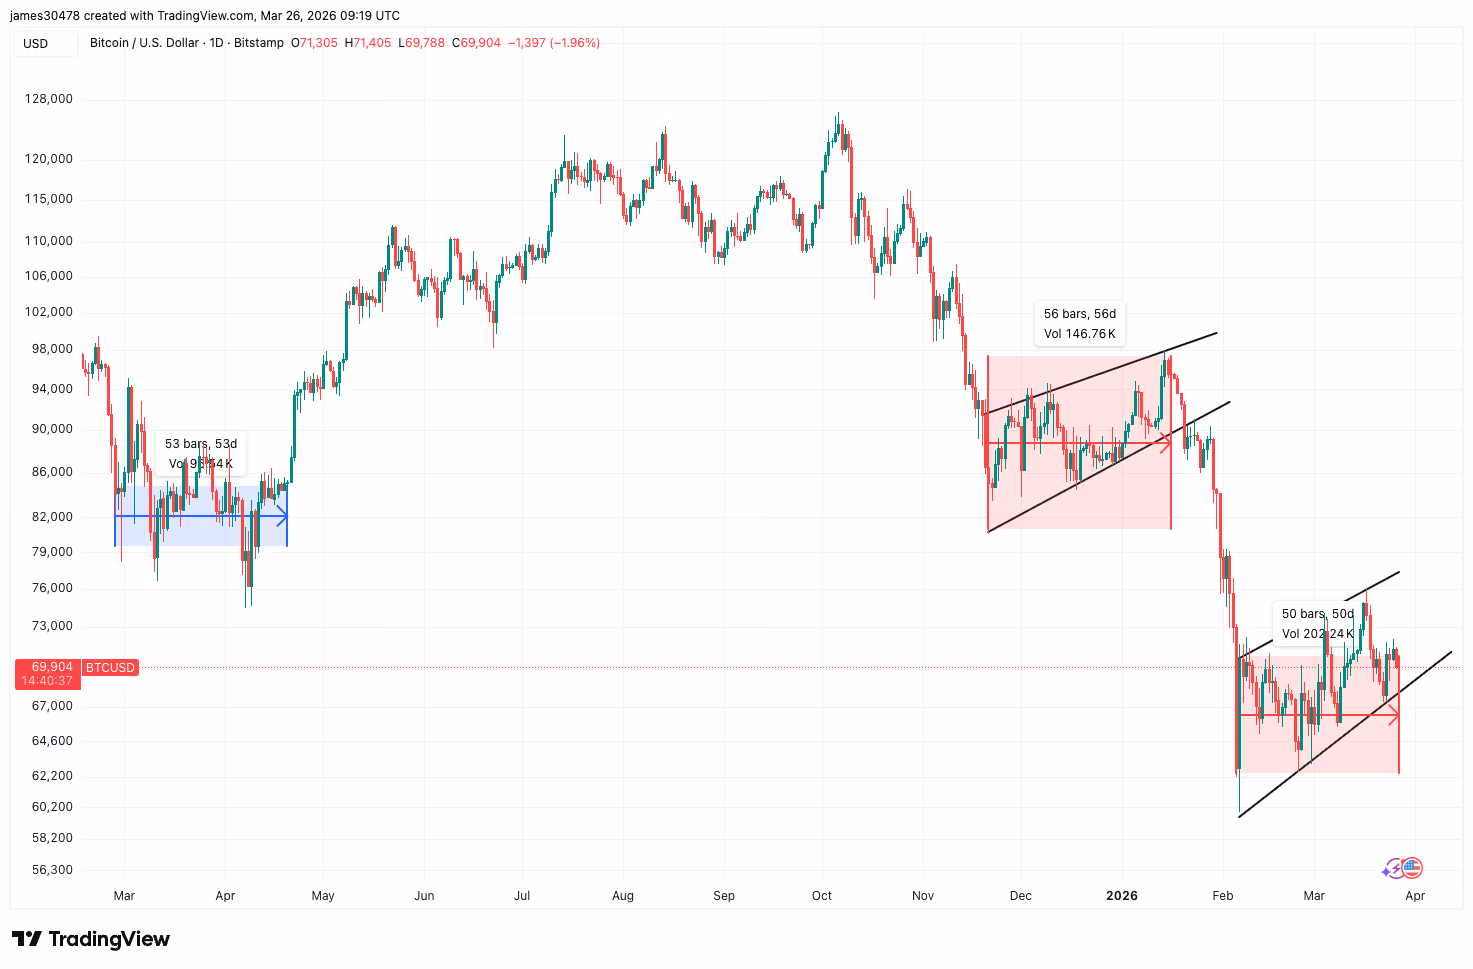 BTCUSD (TradingView)
Why 2026 Differs from 2022
The current bitcoin market cycle is also significantly different from the environment in 2022. Bitcoin experienced a rise from $10,000 to $60,000 from October 2020 to early 2021 in a steep trajectory, with minimal substantial support established during that ascent. When the market eventually corrected in 2022, it retraced much of that increase, resulting in the FTX-driven drop to $15,000 in November 2022.
Conversely, bitcoin has spent most of 2024 consolidating between $50,000 and $70,000, effectively creating a foundation within the current trading range.
Research from CoinDesk indicates strong interest in this area, with over 600,000 BTC amassed during the ongoing downturn. This indicates a structurally more robust base compared to earlier cycles.