Disclaimer: Information found on CryptoreNews is those of writers quoted. It does not represent the opinions of CryptoreNews on whether to sell, buy or hold any investments. You are advised to conduct your own research before making any investment decisions. Use provided information at your own risk.
CryptoreNews covers fintech, blockchain and Bitcoin bringing you the latest crypto news and analyses on the future of money.
Bitcoin (BTC) faced rejection at $28,000 following the Wall Street opening on October 5, as an attempt to return to six-week highs fell short.
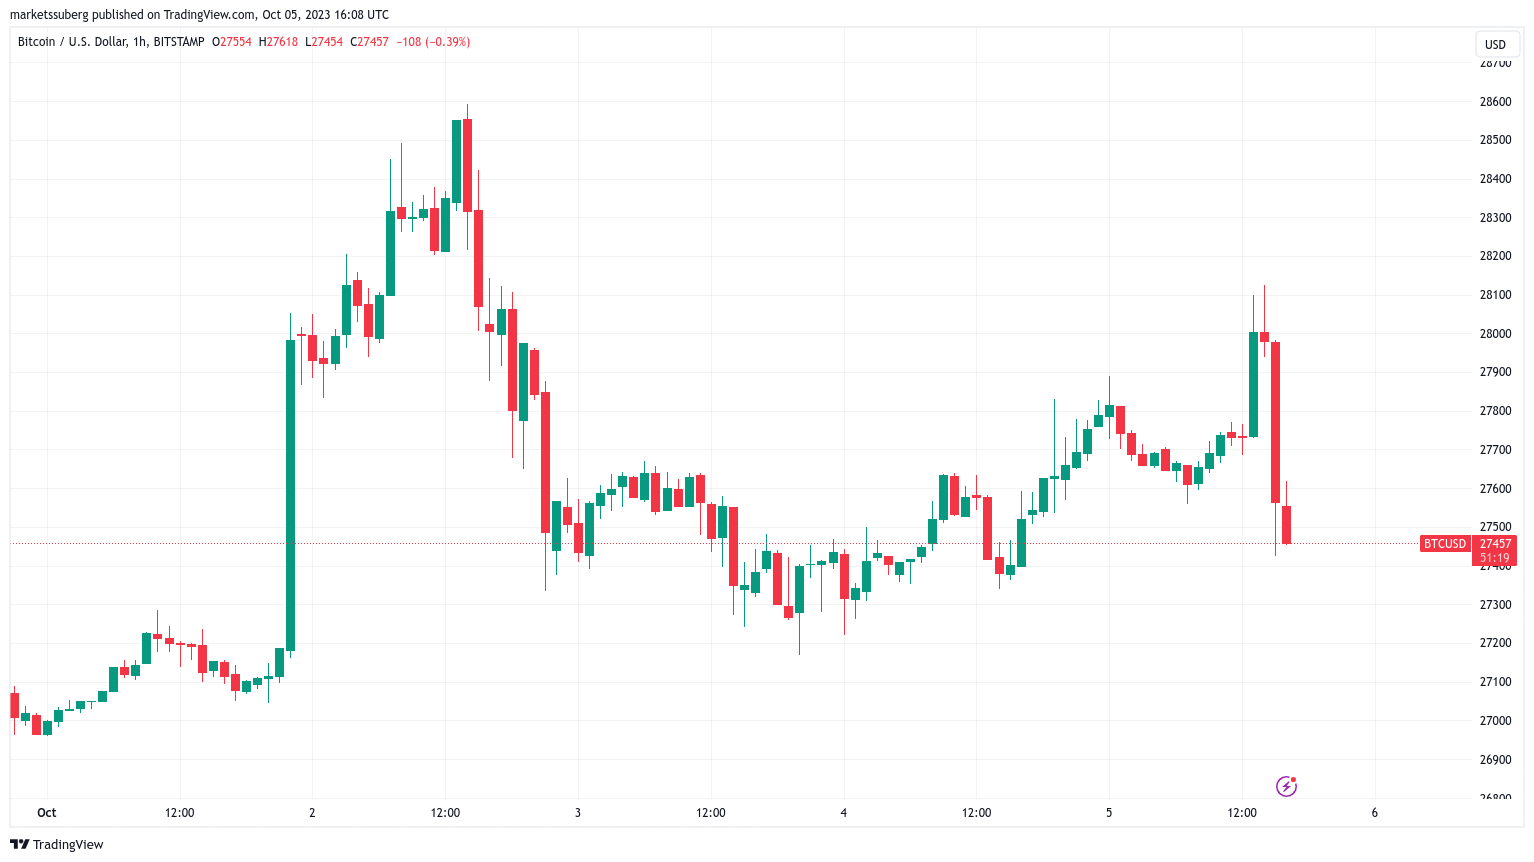 BTC/USD 1-hour chart. Source: TradingView
Bitcoin experiences rapid decline after reattempting $28,000
Data from Cointelegraph Markets Pro and TradingView tracked BTC’s price movements as bulls sought to regain levels seen earlier in the week.
However, this effort encountered challenges just above the $28,000 threshold, with the following hourly candle causing a market drop of up to $700, or 2.5%.
Commenting on the current situation, on-chain analytics platform Material Indicators expressed no surprise. Its proprietary trading tools had indicated a potential downturn, and the sequence of events could still unfold similarly.
“If you didn’t anticipate this rejection, it may be time to reassess your tools, as both TA and Trend Precognition suggested a high likelihood of a rejection,” a portion of an X post noted.
“That doesn’t imply we won’t see another attempt, as it is likely.”
Continuing, Material Indicators co-founder Keith Alan highlighted a potential trading range for BTC/USD moving forward, pointing out that the current price zone had previously served as a site for “key” support/resistance transitions in earlier bull markets.
“So far, Key Moving Averages are acting as significant technical resistance (and support). Breaking this range to the upside is a possibility this month. If it occurs, many traders may face losses along the way,” he informed X subscribers.
“A close above the 200-Week MA would generate bullish optimism. A close below the 21-Week MA would keep BTC fluctuating between $25k – $28k until a decisive move occurs.”
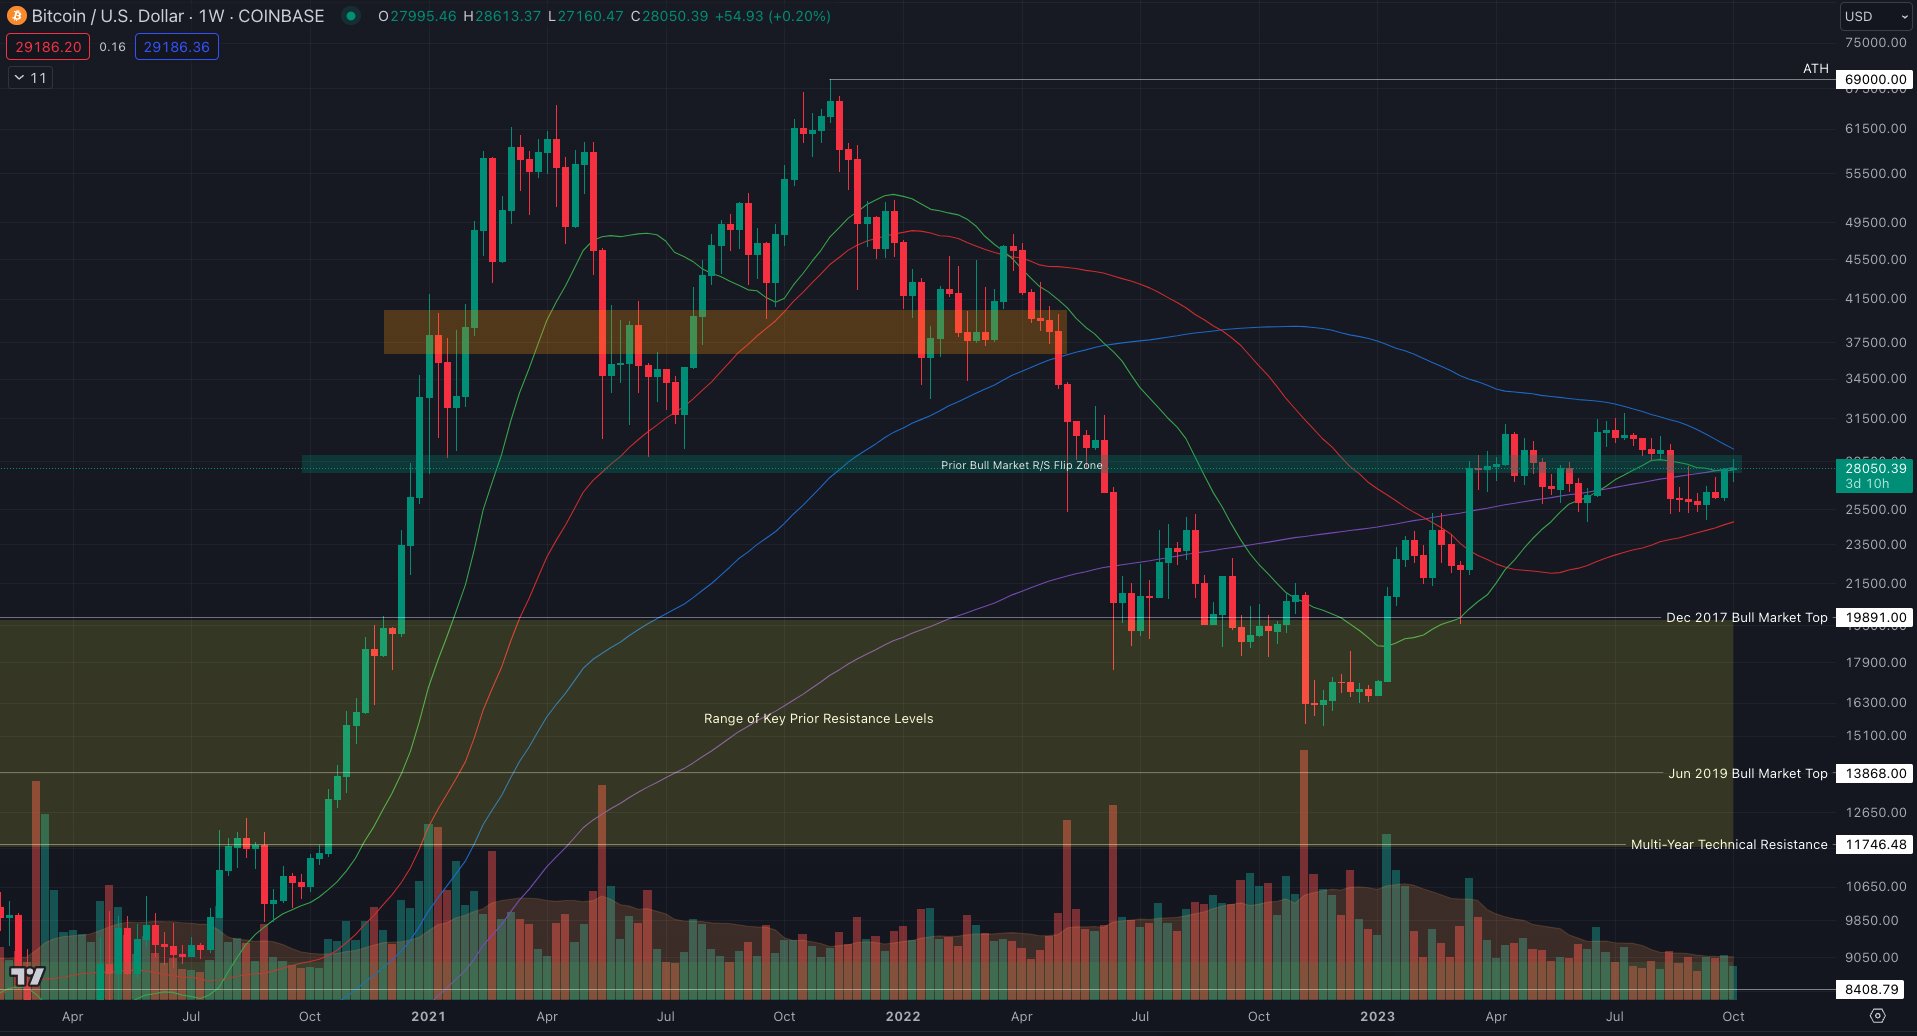 BTC/USD annotated chart. Source: Keith Alan/X
Related Posts
At the time of this report, the 200-week and 21-week MA were recorded at $27,970 and $27,868, respectively.
Others expressed a more positive outlook, with Michaël van de Poppe, founder and CEO of trading firm MN Trading, stating that Bitcoin appeared “very much ready” to challenge the $30,000 resistance level.
“There are several significant levels for Bitcoin here,” he mentioned in an X analysis the previous day.
“Maintaining above $27,200 would be crucial for upward momentum, but ideally, a retest at $26,700-26,900 would occur before we continue the rally to $30,000. Sentiment shifted quite rapidly.”
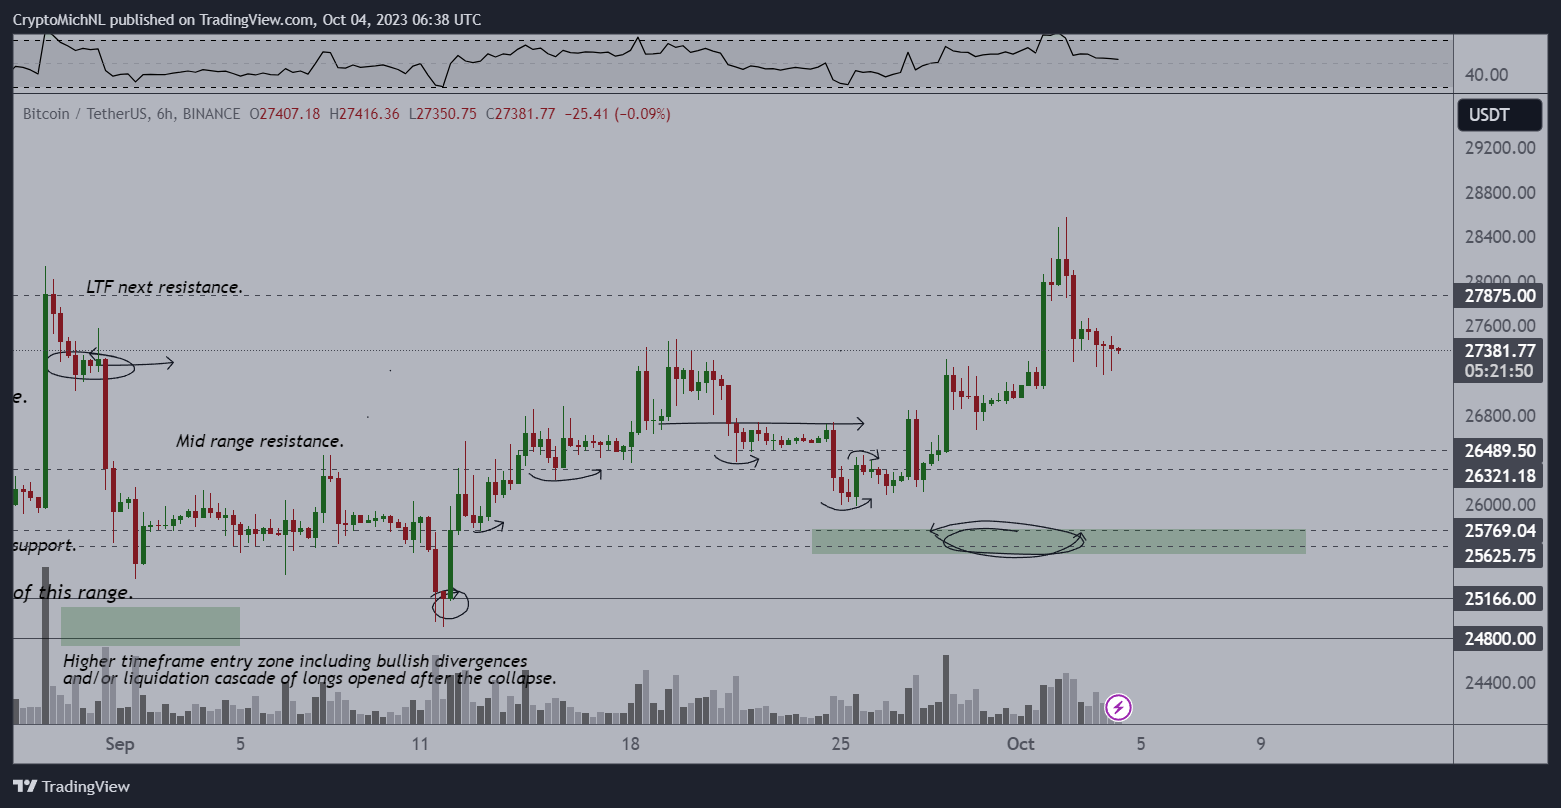 BTC/USD annotated chart. Source: Michaël van de Poppe/X
Trader utilizes RSI for BTC price bottom
In another development, well-known trader and X commentator Ali shared a BTC trading strategy that he claimed had effectively tracked recent local peaks and troughs.
Related: Bitcoin still outperforming US dollar amid ‘eggflation’ — Fed data
This strategy centered around the relative strength index (RSI), which on four-hour charts had varied between roughly 30 and 75 since late August.
“Currently, the RSI is at 51. Patience is essential! It may be best to wait for the RSI to dip below 30.35 to buy the dip!,” part of the accompanying commentary suggested.
Ali shared a chart indicating a classic “sell” signal emerging at the beginning of October, suggesting that a new “buy” signal could follow — coinciding with a local low in BTC price.
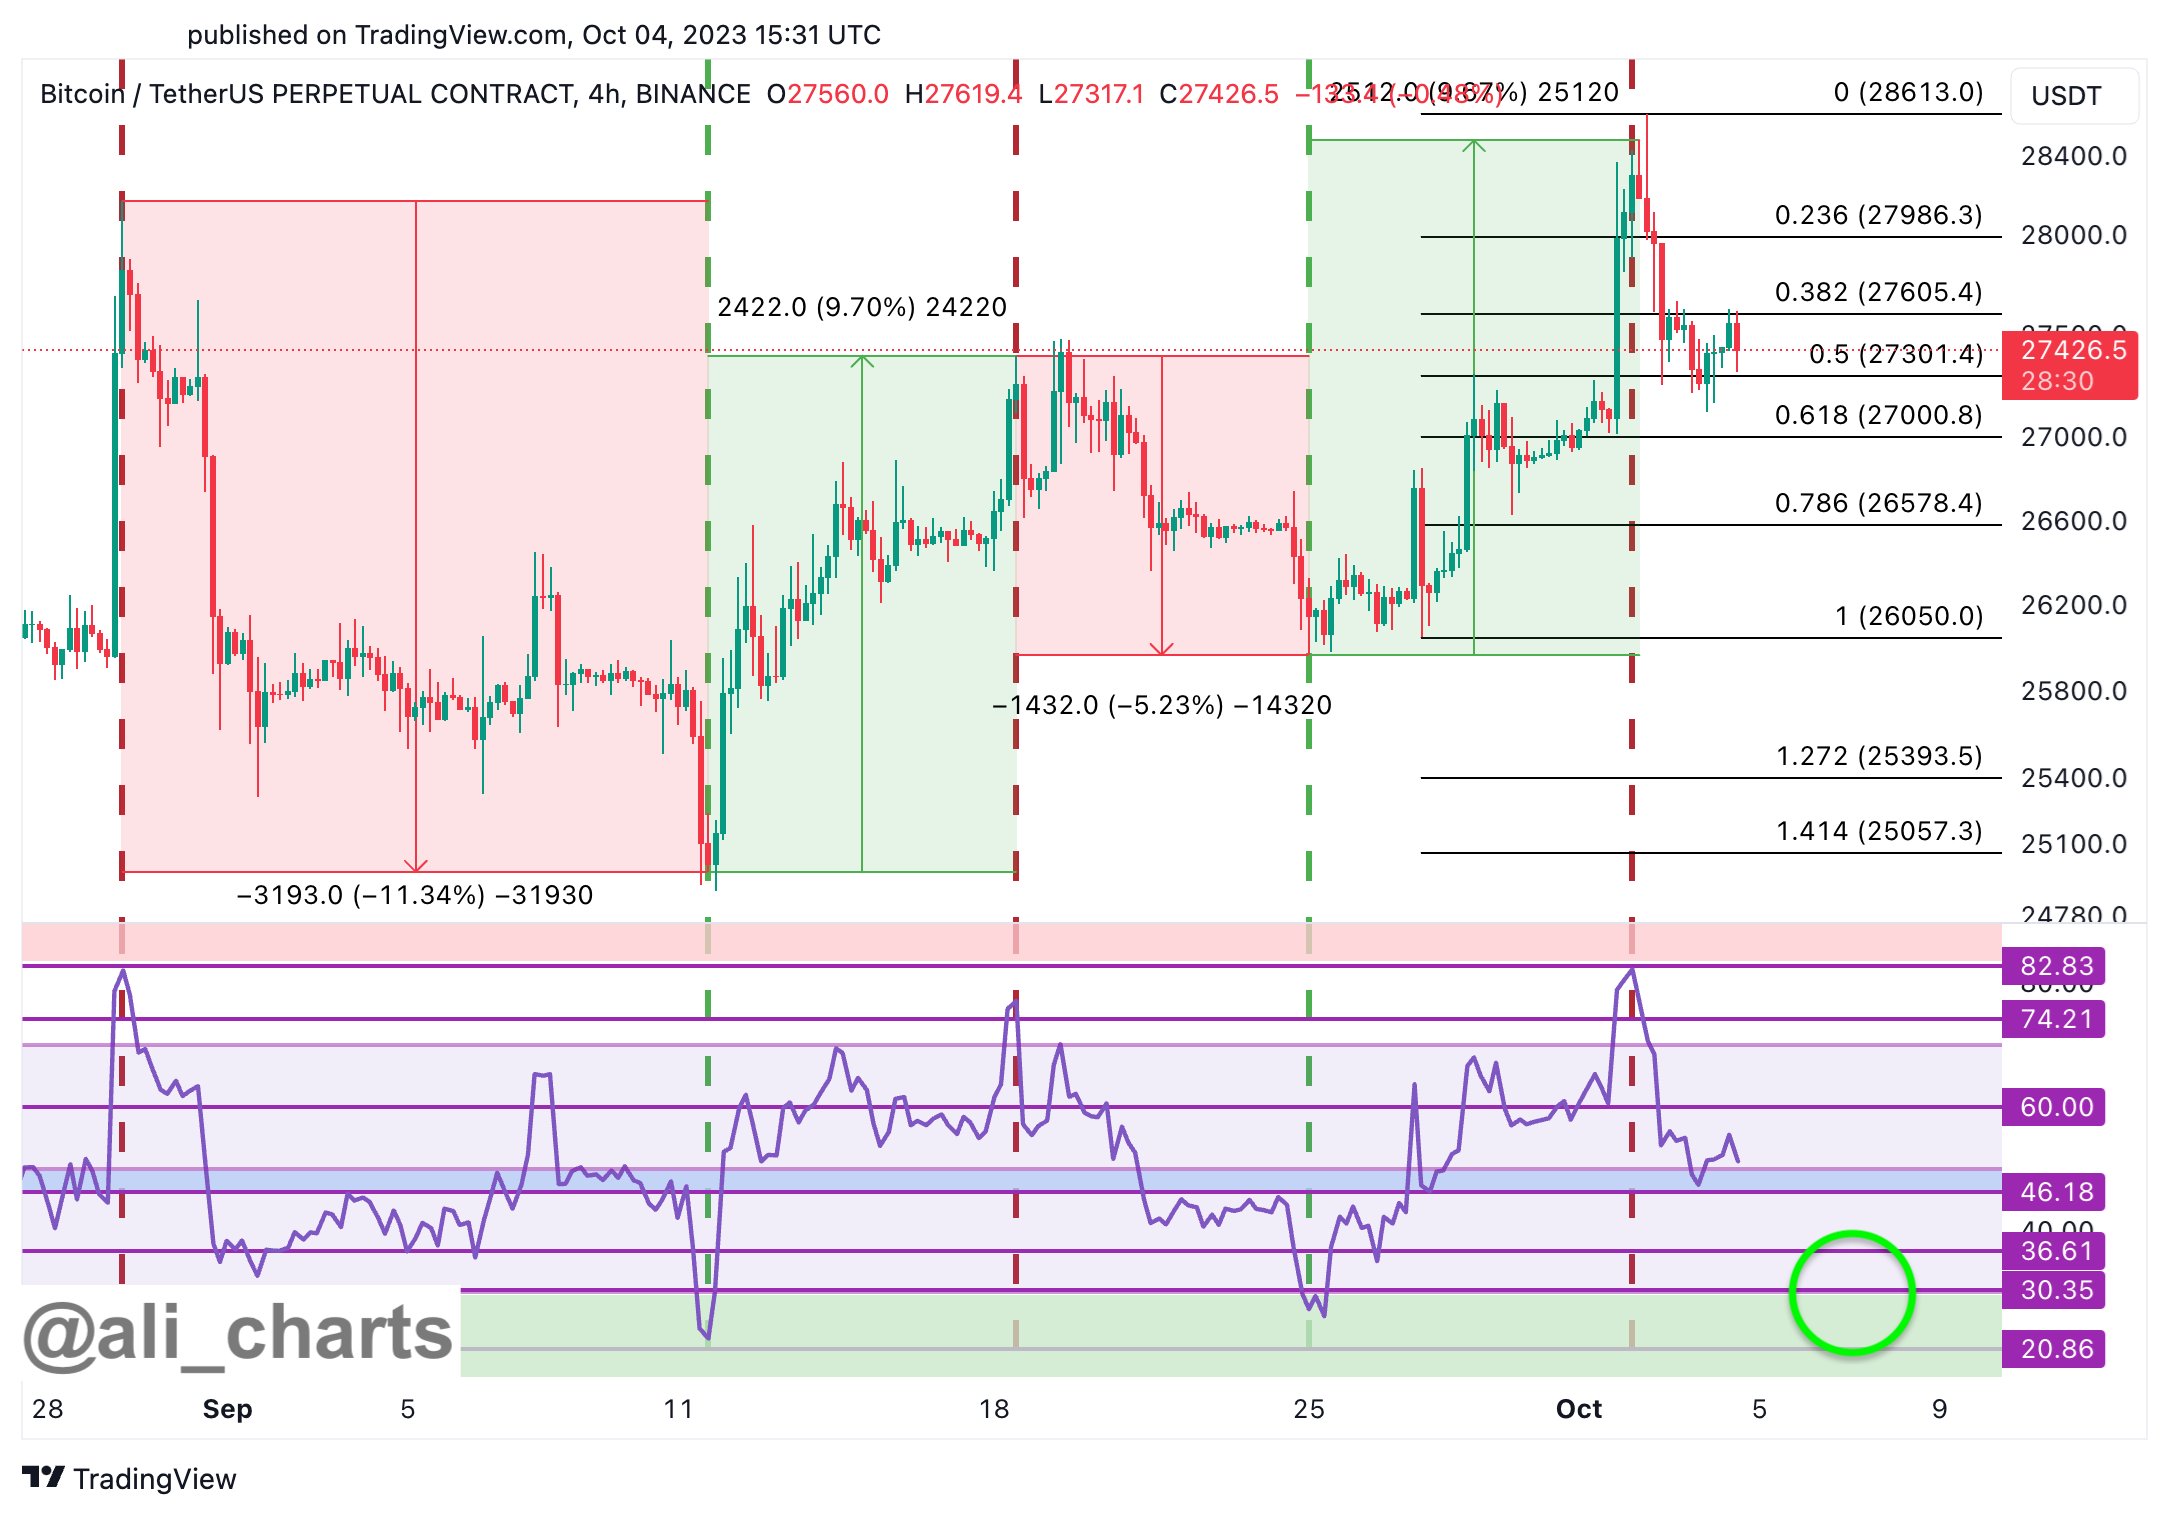 BTC/USD chart with 4-hour RSI data. Source: Ali/X
This article does not provide investment advice or recommendations. All investment and trading activities carry risk, and readers should perform their own research before making decisions.