Disclaimer: Information found on CryptoreNews is those of writers quoted. It does not represent the opinions of CryptoreNews on whether to sell, buy or hold any investments. You are advised to conduct your own research before making any investment decisions. Use provided information at your own risk.
CryptoreNews covers fintech, blockchain and Bitcoin bringing you the latest crypto news and analyses on the future of money.



Bitcoin failed to extend its gains above the $44,300 resistance level on Christmas Day. BTC is now moving lower and may find buying interest near the $42,400 support zone.
Bitcoin initiated a downward correction from the $44,300 resistance zone, falling below $43,000 before recovering slightly to its current price of $43,141.
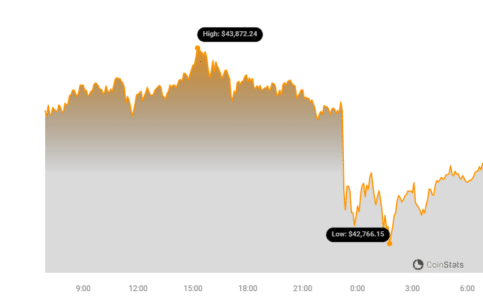 BTC Price Chart | Source: Coinstats
A key declining channel is forming on the hourly chart of the BTC/USD pair (data feed from Kraken), with support near $42,850.
The pair could initiate a new upward move from the $42,400 support zone.
Bitcoin Price Tops Again
Bitcoin attempted a fresh increase above the $43,500 resistance zone. BTC climbed above the $44,000 level, but sellers became active near the $44,300 zone.
A peak was formed near $44,300, and the price began a fresh decline. The price dropped below the $44,000 and $43,500 levels.
The price moved below the 23.6% Fibonacci retracement level of the upward move from the $40,515 swing low to the $44,300 high.
Bitcoin is now trading below $43,500 and the 100-hourly Simple Moving Average. There is also a key declining channel forming with support near $42,850 on the hourly chart of the BTC/USD pair.
Related Posts
See Also: Michael Novogratz Reveals The Reason Behind The Skyrocketing Price Of Bitcoin
The pair is currently testing the channel support. Below this level, it might accelerate lower toward $42,400 or the 50% Fibonacci retracement level of the upward move from the $40,515 swing low to the $44,300 high. If bulls defend the channel support, a fresh increase may occur.
On the upside, immediate resistance is near the $43,500 level. The first major resistance is forming near $44,000 and $44,300.
A close above the $44,300 resistance could trigger a strong rally, with the price potentially clearing the $45,000 resistance.
The next key resistance could be near $46,500, above which BTC could rise toward the $47,200 level. Further gains might send the price toward $48,000.
More Losses In BTC?
If Bitcoin fails to rise above the $43,500 resistance zone, it could continue to move down. Immediate downside support is near the $42,800 level.
The next major support is near $42,400. A move below $42,400 carries the risk of further losses. In that scenario, the price could drop toward the $41,200 support level in the near term.
Technical Indicators:
- Hourly MACD – The MACD is gaining momentum in the bearish zone.
- Hourly RSI (Relative Strength Index) – The RSI for BTC/USD is currently below the 50 level.
- Major Support Levels – $42,400, followed by $41,200.
- Major Resistance Levels – $43,500, $44,300, and $45,000.
Disclaimer: The information provided is not trading advice. Bitcoinworld.co.in holds no liability for any investments made based on the information provided on this page. We strongly recommend independent research and/or consultation with a qualified professional before making any investment decisions.
The post Bitcoin Dips On Christmas Day But This Is Not The Christmas Gift We Want appeared first on BitcoinWorld.
