Disclaimer: Information found on CryptoreNews is those of writers quoted. It does not represent the opinions of CryptoreNews on whether to sell, buy or hold any investments. You are advised to conduct your own research before making any investment decisions. Use provided information at your own risk.
CryptoreNews covers fintech, blockchain and Bitcoin bringing you the latest crypto news and analyses on the future of money.
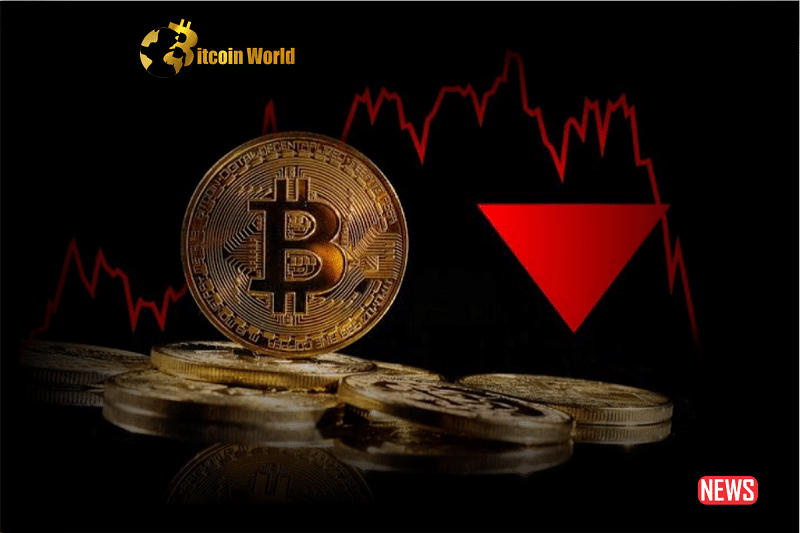
Examining Chart Patterns and Historical Trends
In the unpredictable realm of cryptocurrency, the evaluation of candlestick formations on the 4-hour chart indicates that Bitcoin (BTC) is presently in a significantly oversold state. Drawing comparisons with previous instances, a Chartered Market Analyst points out that the last occasion BTC entered this “oversold” condition on the 4-hour chart, the asset subsequently saw an impressive 63% increase.
With Bitcoin currently priced at approximately $27,800, this pattern implies the possibility of a rise to $45,000 if historical trends hold true. Such an upward movement would exceed immediate resistance levels and pave the way for new highs in 2023. The current resistance stands at $31,800, which was last observed in late July of the same year.
Shifting focus to the daily chart, a breakdown is apparent as BTC penetrates the base of the bull flag. This downward trend indicates the prevailing influence of bears in the market. Indicators reveal that selling pressure is substantial, with bars closely aligned with the lower Bollinger Bands, suggesting increased selling activity and potential anxiety among holders.
Related Posts
Influence of Stablecoins and Future Catalysts
In times of extreme volatility, traders with lower risk tolerance may liquidate their BTC assets in favor of stablecoins. Data from CoinMarketCap shows a 45% increase in USDT trading volumes over the last 24 hours, reaching $31.7 billion. While Tether’s choice to suspend coin issuance on certain blockchains, including Kusama and Bitcoin Cash, may affect this trend, it highlights USDT’s function as a refuge during uncertain times.
In the event of a bearish breakout, BTC’s price could decline to retest the immediate support levels indicated by the Fibonacci retracement of the June to July 2023 range. Should selling pressure continue, the asset might further decrease to $26,300, which corresponds to the 78.6% Fibonacci retracement level of the recent swing high and low on the daily chart.
Although technical indicators suggest a potential recovery from the current “oversold” conditions, BTC needs catalysts to foster bullish sentiment and counteract the ongoing presence of sellers. The approval of the first spot Bitcoin exchange-traded fund (ETF) in the United States could serve as a crucial trigger, potentially altering market sentiment and enhancing demand.
Prominent entities in the financial sector, such as BlackRock and Fidelity, have filed ETF applications. Investors are keenly observing the United States Securities and Exchange Commission (SEC) for any indications of approval, which could have significant repercussions for the cryptocurrency market.
The post Bitcoin Drops, Is It A Pullback For A Sling To $45,000? appeared first on BitcoinWorld.