Disclaimer: Information found on CryptoreNews is those of writers quoted. It does not represent the opinions of CryptoreNews on whether to sell, buy or hold any investments. You are advised to conduct your own research before making any investment decisions. Use provided information at your own risk.
CryptoreNews covers fintech, blockchain and Bitcoin bringing you the latest crypto news and analyses on the future of money.

The price of Bitcoin (BTC) was unable to maintain its position above the $68,500 support level and has now declined below $68,000. BTC has continued to experience losses and is currently exhibiting bearish trends beneath the $68,800 mark.
- Bitcoin has initiated another drop from the $70,150 resistance area.
- The price is trading below $68,800 and the 100 hourly Simple Moving Average.
- A significant bearish trend line is developing with resistance at $69,500 on the hourly chart for the BTC/USD pair (data feed from Kraken).
- The pair may decline further if there is a decisive move below the $68,000 threshold.
Bitcoin Price Dips Again
The price of Bitcoin made an attempt to rise above the $69,500 resistance area. BTC even surpassed the $70,000 resistance level but was unable to sustain the upward momentum.
A peak was reached at $70,142 before a new decline occurred.
The price fell below the support levels of $69,500 and $68,500.
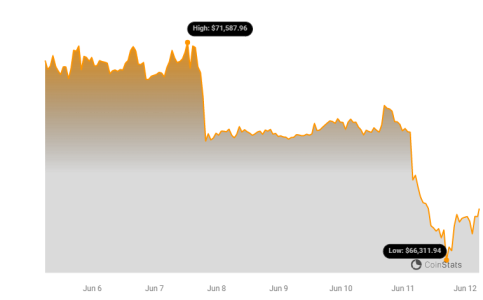 BTC Price Chart | Source: Coinstats
A low of $67,920 was established, and the price is currently consolidating losses near the 23.6% Fibonacci retracement level of the downward movement from the $70,142 swing high to the $67,920 low.
Related Posts
Bitcoin is presently trading below $69,500 and the 100 hourly Simple Moving Average. On the upside, the price encounters resistance around the $68,800 level.
The initial significant resistance may be at $69,000, coinciding with the 50% Fibonacci retracement level of the decline from the $70,142 swing high to the $67,920 low.
The next crucial resistance could be at $69,500. Additionally, a key bearish trend line is forming with resistance at $69,500 on the hourly chart of the BTC/USD pair.
A clear breakthrough above the $69,500 resistance could propel the price higher. In such a scenario, the price may rise and test the $70,000 resistance. Further gains could push BTC towards the $71,200 resistance.
More Losses In BTC?
If Bitcoin does not manage to rise above the $69,500 resistance zone, it may initiate another decline. Immediate support on the downside is located near the $68,000 level.
The first major support is at $67,650. The next support is forming near $67,500. Additional losses could lead the price towards the $66,400 support zone in the near term.
Technical Indicators:
- Hourly MACD – The MACD is currently gaining momentum in the bearish zone.
- Hourly RSI (Relative Strength Index) – The RSI for BTC/USD is now below the 50 mark.
- Major Support Levels – $68,000, followed by $67,500.
- Major Resistance Levels – $69,000, and $69,500.
Disclaimer: The information provided is not trading advice. Bitcoinworld.co.in holds no liability for any investments made based on the information provided on this page. We strongly recommend independent research and/or consultation with a qualified professional before making any investment decisions.