Disclaimer: Information found on CryptoreNews is those of writers quoted. It does not represent the opinions of CryptoreNews on whether to sell, buy or hold any investments. You are advised to conduct your own research before making any investment decisions. Use provided information at your own risk.
CryptoreNews covers fintech, blockchain and Bitcoin bringing you the latest crypto news and analyses on the future of money.

The price of Bitcoin (BTC) has begun another downturn from the $70,000 resistance area to $66,000 as bearish sentiment has increased. BTC has decreased by more than 5%, moving below the $67,000 support level.
Bitcoin Price Declines
Bitcoin’s price faced challenges in maintaining a position above the $70,000 resistance area. BTC reacted negatively after breaking through the $69,200 support level.
A significant drop occurred below the $68,500 mark.
The price even fell beneath the $67,000 threshold, ultimately testing the $66,000 level with a bearish trend.
A low was established around $65,992, and the price is currently attempting a recovery phase. It has moved above the $66,800 level.
The price has surpassed the 23.6% Fibonacci retracement level of the decline from the $69,884 swing high to the $65,992 low.
However, Bitcoin is presently trading below $68,500 and the 100-hour Simple Moving Average. Additionally, a significant bearish trend line is forming with resistance near $68,400 on the hourly chart for BTC/USD.
See Also: Bitcoin (BTC) Becomes More Volatile Than Ether As Halving Approaches
Immediate resistance is located near the $68,000 level, which is close to the 50% Fibonacci retracement level of the decline from the $69,884 swing high to the $65,992 low.
Related Posts
The first significant resistance could be at $68,500 and the trend line. Should there be a clear movement above the $68,500 resistance area, the price may initiate a new upward trend.
In this scenario, the price could advance toward the $70,000 resistance area in the near future. The next major resistance is situated around the $71,500 zone.
Further Declines for BTC?
If Bitcoin is unable to rise above the $67,000 resistance area, it may continue to decline. Immediate support on the downside is near the $66,000 level.
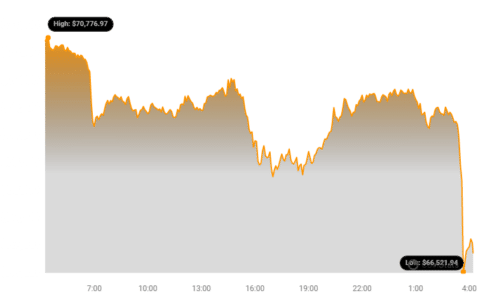 BTC Price Chart | Source: Coinstats
The first major support level is at $65,000, followed by $64,000. If the price closes below $64,000, it could begin to drop toward the $62,500 level. Additional losses may push the price toward the $60,500 support area in the near term.
Technical Indicators:
- Hourly MACD – The MACD is currently gaining momentum in the bearish zone.
- Hourly RSI (Relative Strength Index) – The RSI for BTC/USD is now below the 50 mark.
- Major Support Levels – $66,000, followed by $65,000.
- Major Resistance Levels – $68,000, $68,500, and $70,000.
Disclaimer: The information provided is not trading advice. Bitcoinworld.co.in holds no liability for any investments made based on the information provided on this page. We strongly recommend independent research and/or consultation with a qualified professional before making any investment decisions.
#Binance #WRITE2EARN
The post What! Bitcoin (BTC) Price Dumped To $66K As Bears Gained Strength, $64K Next? appeared first on BitcoinWorld.