Disclaimer: Information found on CryptoreNews is those of writers quoted. It does not represent the opinions of CryptoreNews on whether to sell, buy or hold any investments. You are advised to conduct your own research before making any investment decisions. Use provided information at your own risk.
CryptoreNews covers fintech, blockchain and Bitcoin bringing you the latest crypto news and analyses on the future of money.
The consumer price index for March experienced a slight rise of 0.1%, falling short of economists’ projections of a 0.2% increase and February’s rise of 0.4%. While inflation appears to be decelerating, the year-over-year CPI has risen by 5%, significantly surpassing the Federal Reserve’s target of 2%.
The FedWatch Tool indicates a 67% likelihood of a 25 basis point interest rate increase at the Fed’s May meeting; however, by year-end, most market participants anticipate that rates will be lower than the present level.
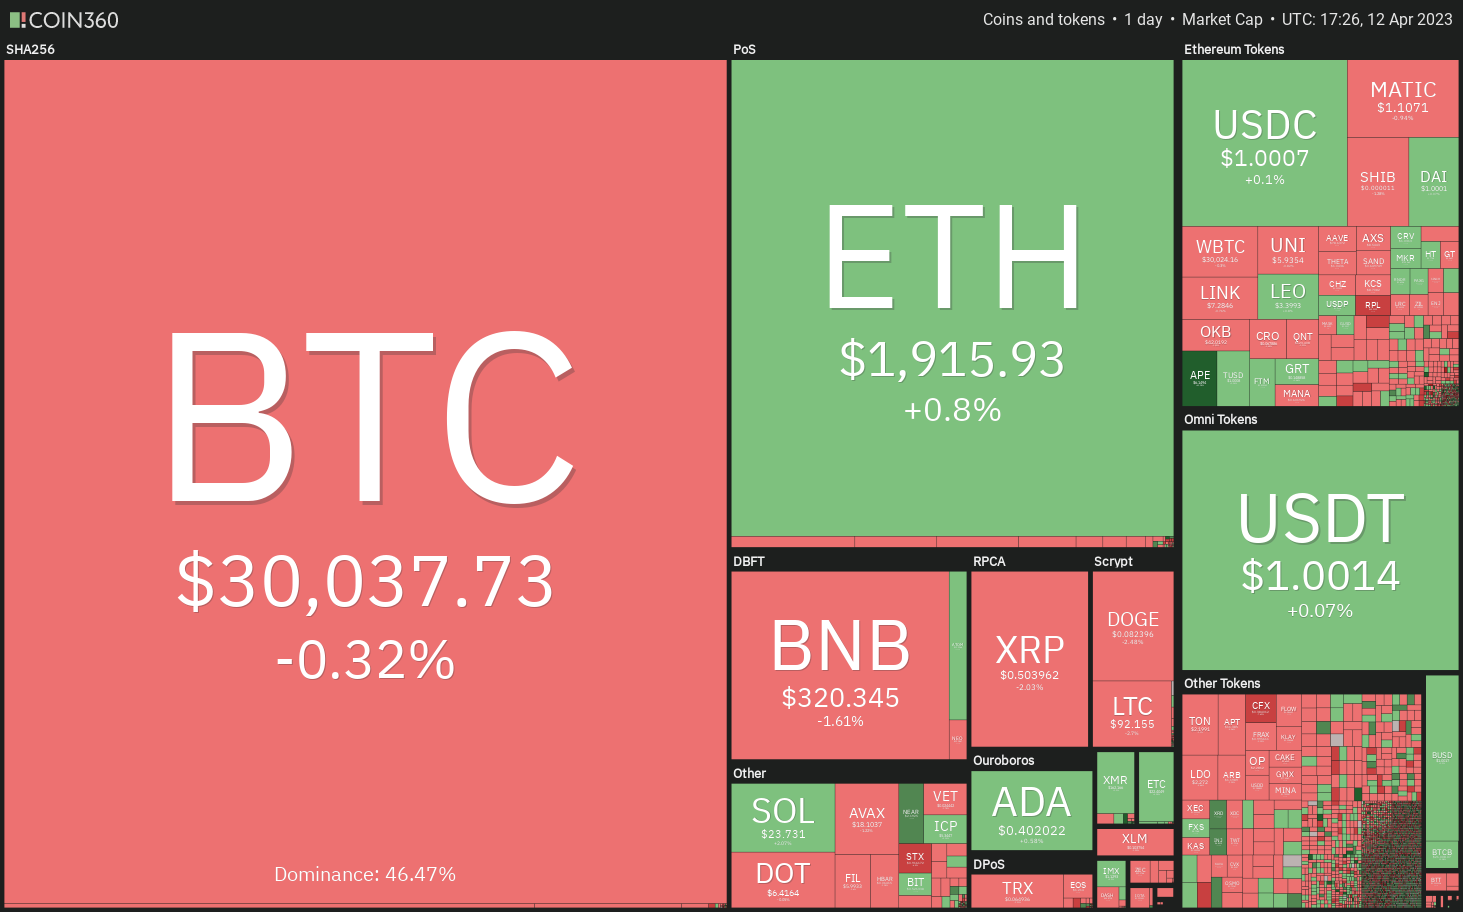 Daily cryptocurrency market performance. Source: Coin360
A looser monetary policy typically benefits high-risk assets. Furthermore, cryptocurrency traders will be paying close attention to Bitcoin’s (BTC) halving event scheduled for next year, which is expected to positively influence cryptocurrency valuations. Although the short-term outlook is ambiguous, the long-term perspective remains optimistic.
Will traders take profits soon, leading to a decline in Bitcoin and altcoins, or will the upward trend continue?
Let’s analyze the charts of the top-10 cryptocurrencies to gain insights.
Bitcoin price analysis
Bitcoin is facing resistance around $30,550, but a favorable indication is that the bulls have not surrendered much ground. This implies that buyers are not hastily exiting.
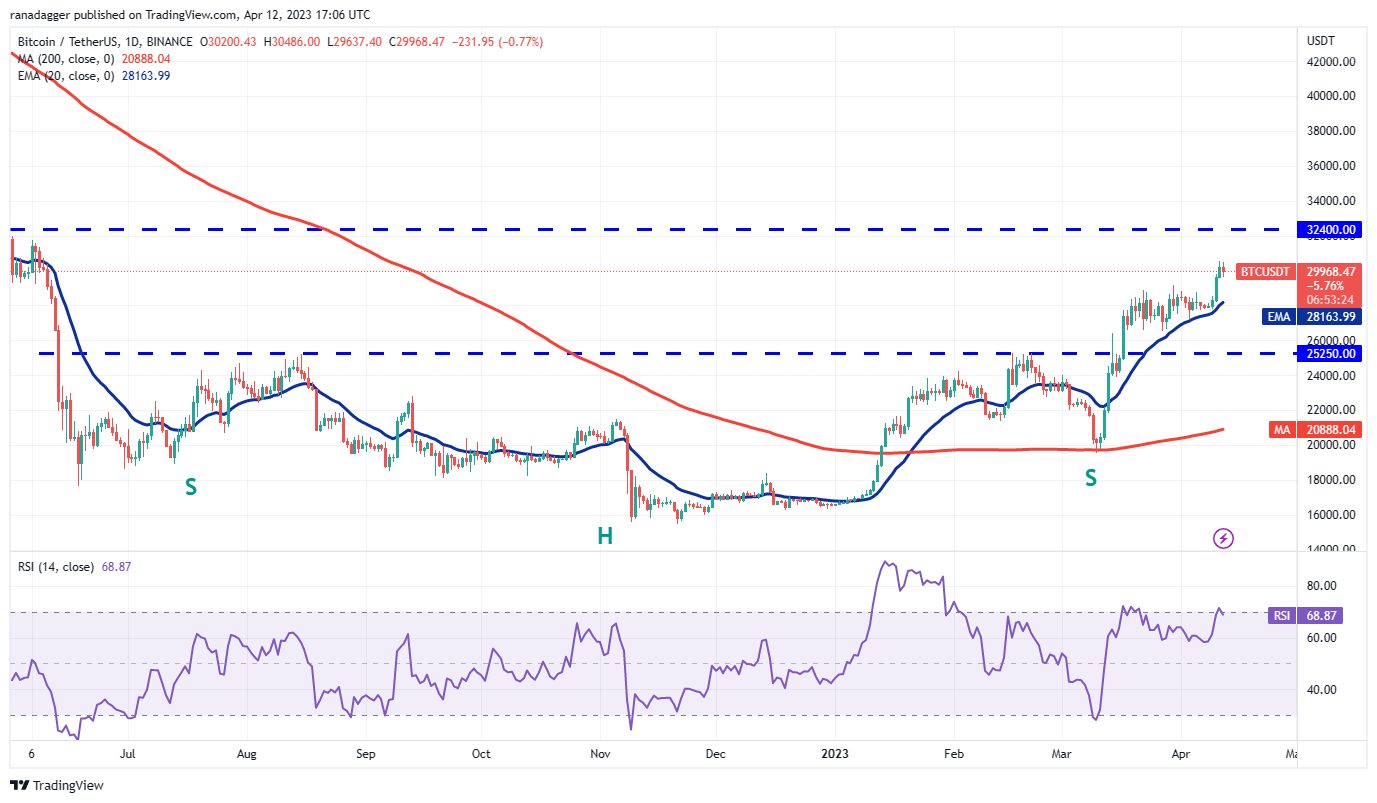 BTC/USDT daily chart. Source: TradingView
The bears are unlikely to concede without a struggle. They will attempt to pull the price below the 20-day exponential moving average ($28,163), which is a crucial support level to watch. If they succeed, selling pressure may increase, and the BTC/USDT pair could decline to the support level at $25,250.
On the other hand, if the price continues to rise from the current level or rebounds from the 20-day EMA, it will indicate strong demand at lower prices. This would enhance the chances of a rally to $32,400, likely presenting significant resistance.
Ether price analysis
Ether (ETH) rebounded from the 20-day EMA ($1,831) on April 9, but the bulls were unable to push the price above the immediate resistance at $1,943.
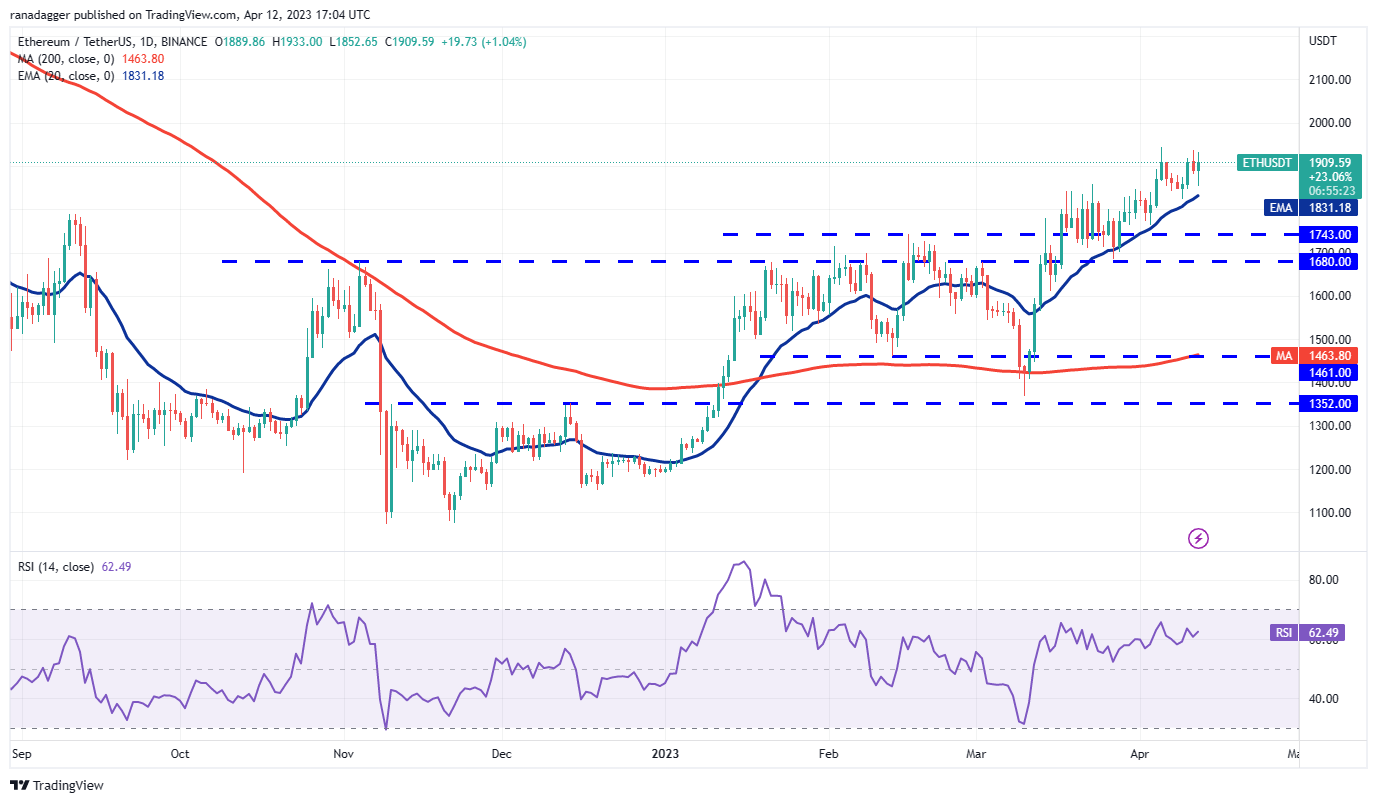 ETH/USDT daily chart. Source: TradingView
If the price declines from the current level and breaks below $1,824, the ETH/USDT pair will form a double top in the short term, potentially dragging the price down to the strong support at $1,680.
If the bears wish to maintain the uptrend, they must defend the 20-day EMA and push the pair above the resistance at $1,943. If they can accomplish this, the pair may resume its upward movement. The $2,000 level may pose resistance but is likely to be surpassed, potentially allowing the pair to rally to $2,200.
BNB price analysis
BNB (BNB) climbed above the $318 resistance on April 11, but the long wick on the candlestick indicates that the bears are selling near $338.
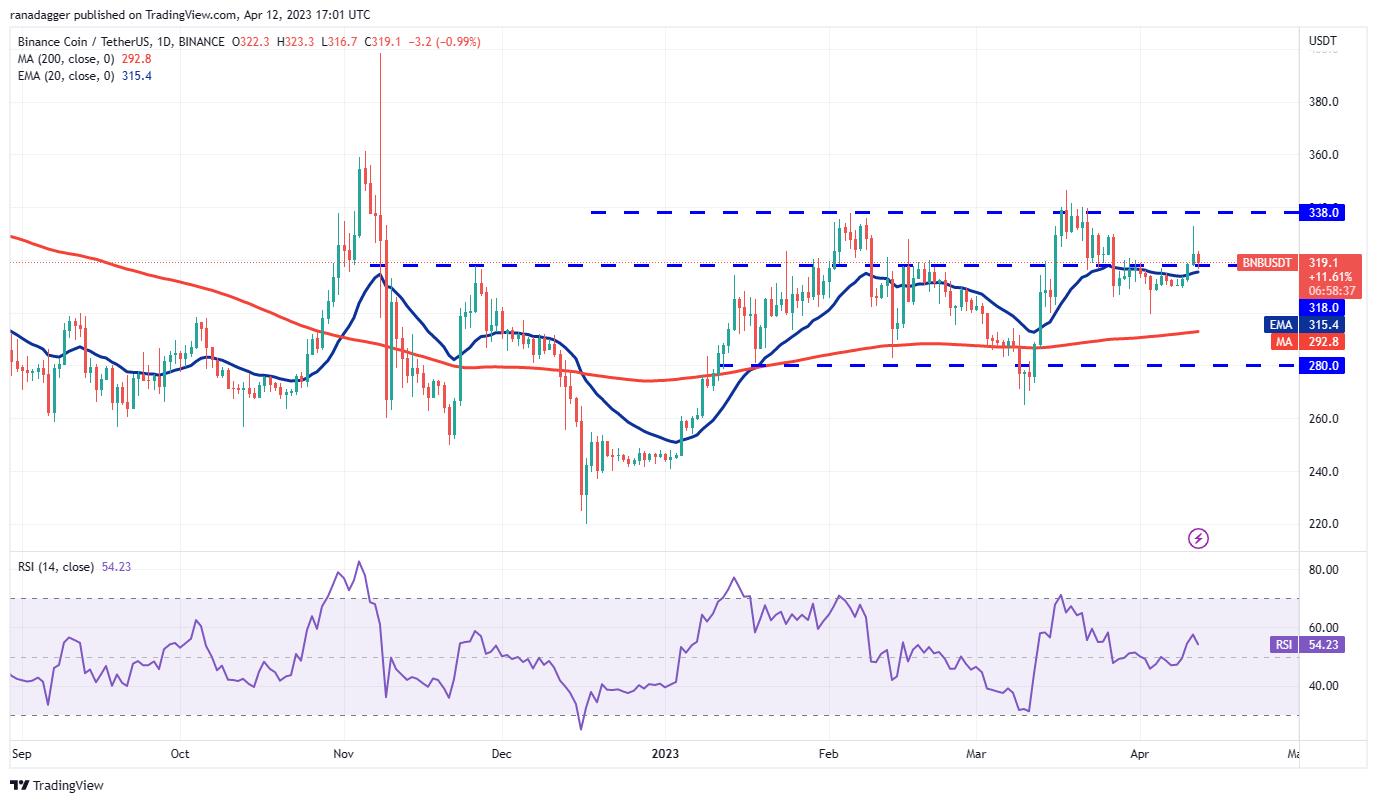 BNB/USDT daily chart. Source: TradingView
The 20-day EMA ($315) is relatively flat, and the RSI is trending downward toward the midpoint. This suggests a potential range-bound movement in the near term. If the price falls below the 20-day EMA, the BNB/USDT pair may fluctuate between $338 and the 200-day SMA ($292) for several days.
Alternatively, if the price rebounds off the 20-day EMA with strength, it will indicate buying on dips. The bulls will then attempt to push the pair above the resistance zone between $338 and $346.
XRP price analysis
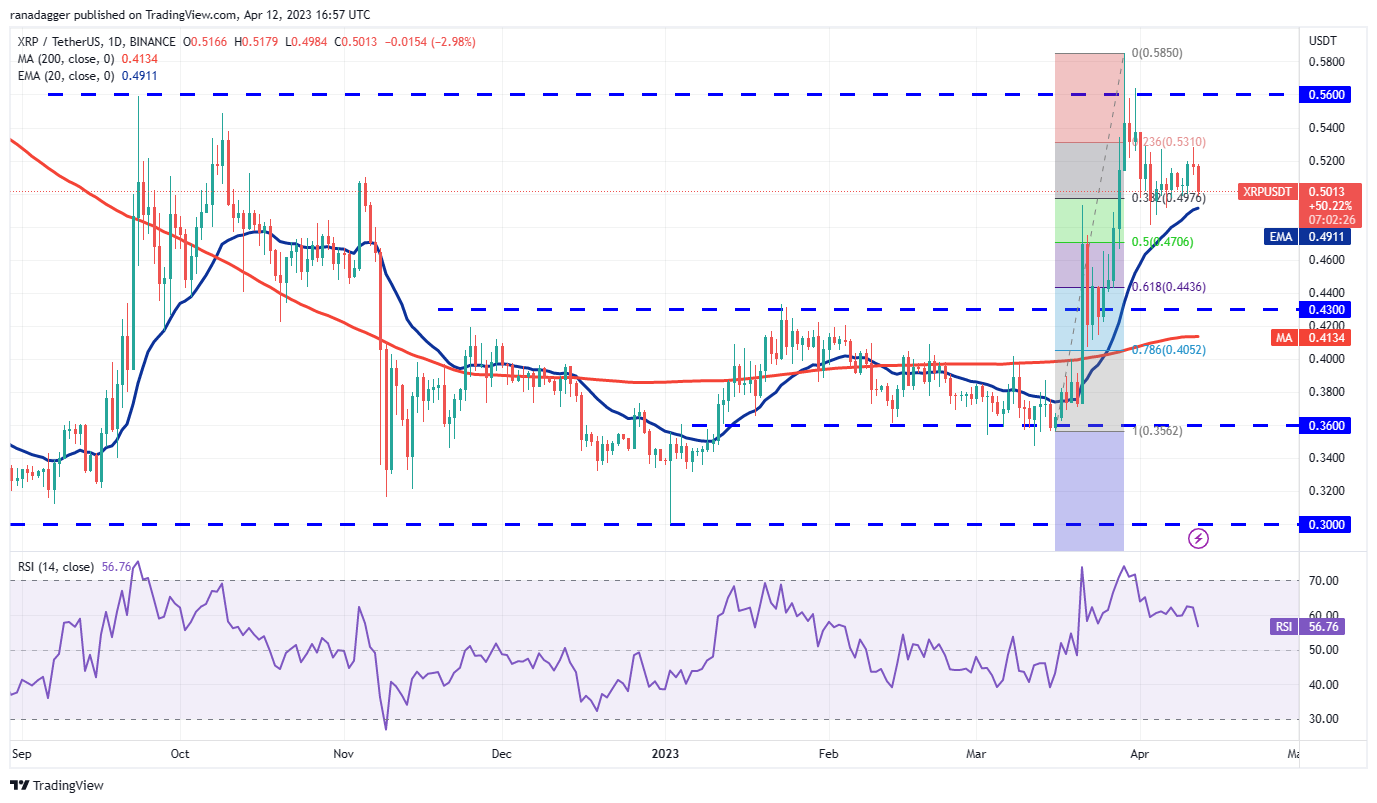
The long wick on XRP’s (XRP) April 11 candlestick indicates that the bears are attempting to halt the recovery at $0.53.
 XRP/USDT daily chart. Source: TradingView
Sellers will aim to strengthen their position by pulling the price below the 20-day EMA ($0.49). If they succeed, many short-term bulls may be compelled to close their positions, causing the XRP/USDT pair to drop towards the next support at $0.43.
Conversely, if the price rebounds off the 20-day EMA, it will suggest that bulls continue to see dips as buying opportunities. The bulls will need to overcome the significant resistance at $0.53 to regain control.
Cardano price analysis
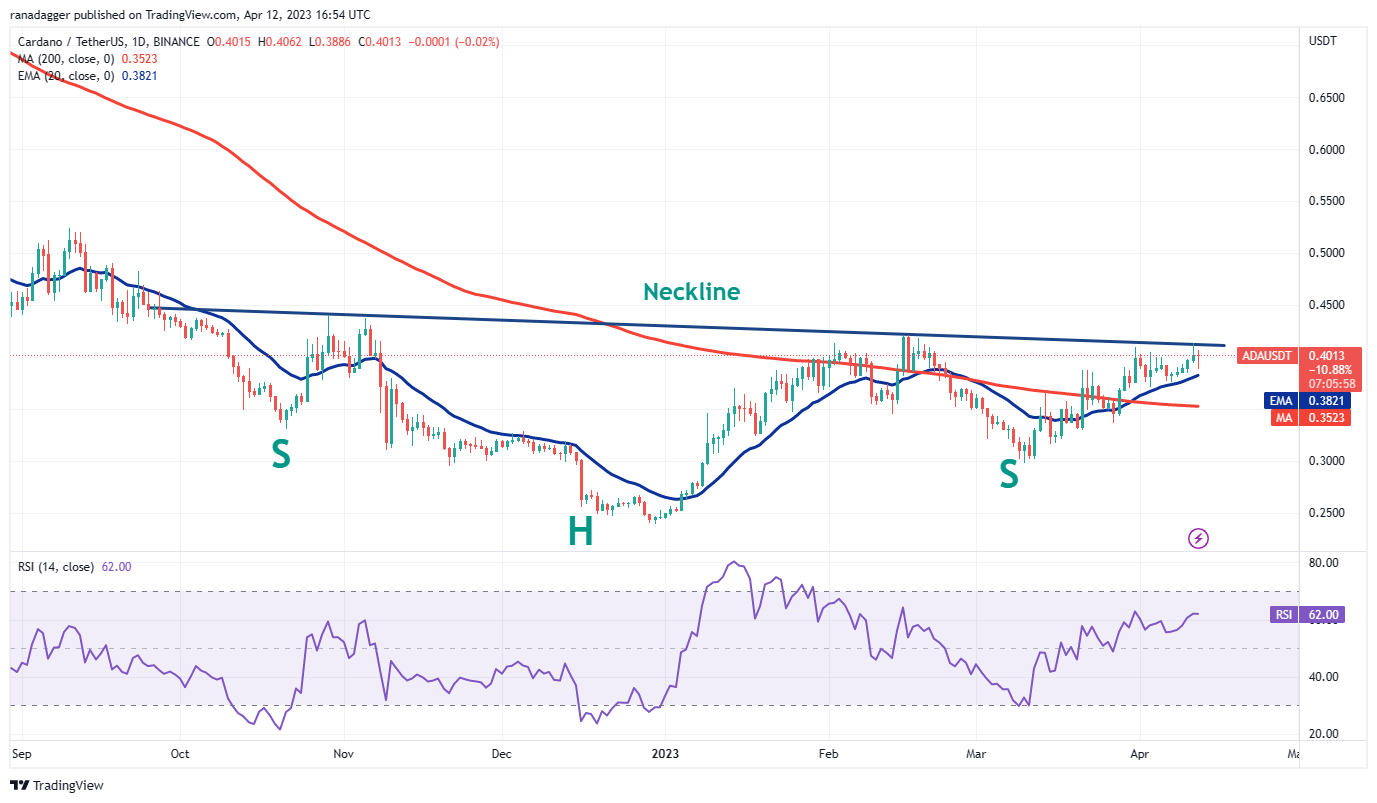
Cardano (ADA) retraced from the neckline of the inverse head and shoulders (H&S) pattern, signaling that the bears are attempting to stop the recovery at this point.
 ADA/USDT daily chart. Source: TradingView
The 20-day EMA ($0.38) is a key level to monitor on the downside. If the price bounces from this level, it will indicate that sentiment remains positive and traders are buying on dips.
Related Posts
This would increase the likelihood of breaking above the neckline. If this occurs, the reversal pattern will be completed, and the ADA/USDT pair may initiate a new uptrend toward $0.60.
In contrast, if the pair falls below the 20-day EMA, it will suggest that short-term traders are taking profits, which may push the pair down to the 200-day SMA ($0.35).
Dogecoin price analysis
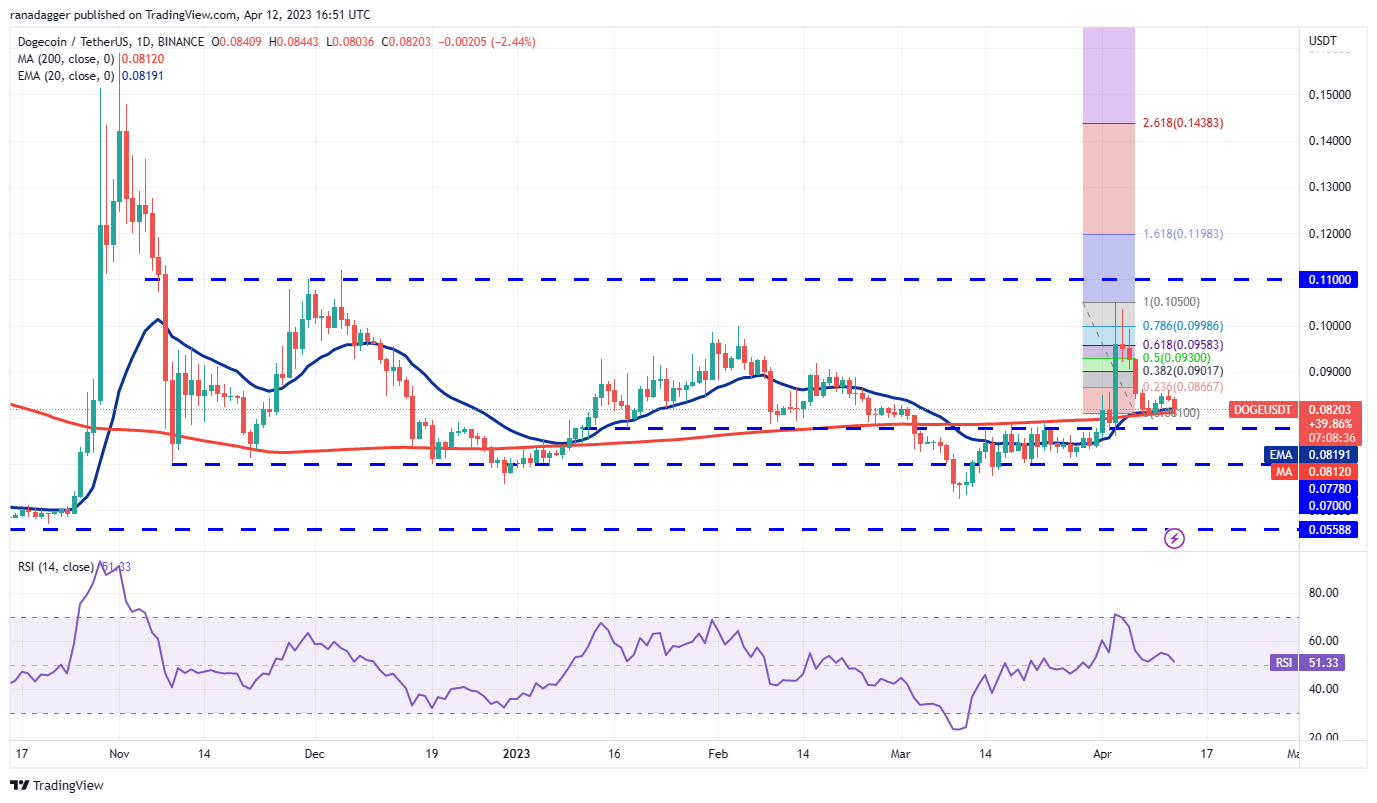
Dogecoin’s (DOGE) rebound off the moving averages failed to reach even the 38.2% Fibonacci retracement level of $0.09. This indicates that bears are selling at every minor uptick.
 DOGE/USDT daily chart. Source: TradingView
The DOGE/USDT pair has fallen back to the moving averages, indicating that bears are trying to solidify their position. If they pull the price below the moving averages, the pair could drop to the critical support at $0.07.
Conversely, if the price rebounds from the moving averages again, it will suggest that bulls are aggressively defending the level. Buyers will then make another attempt to push the price towards the $0.11 level.
Polygon price analysis
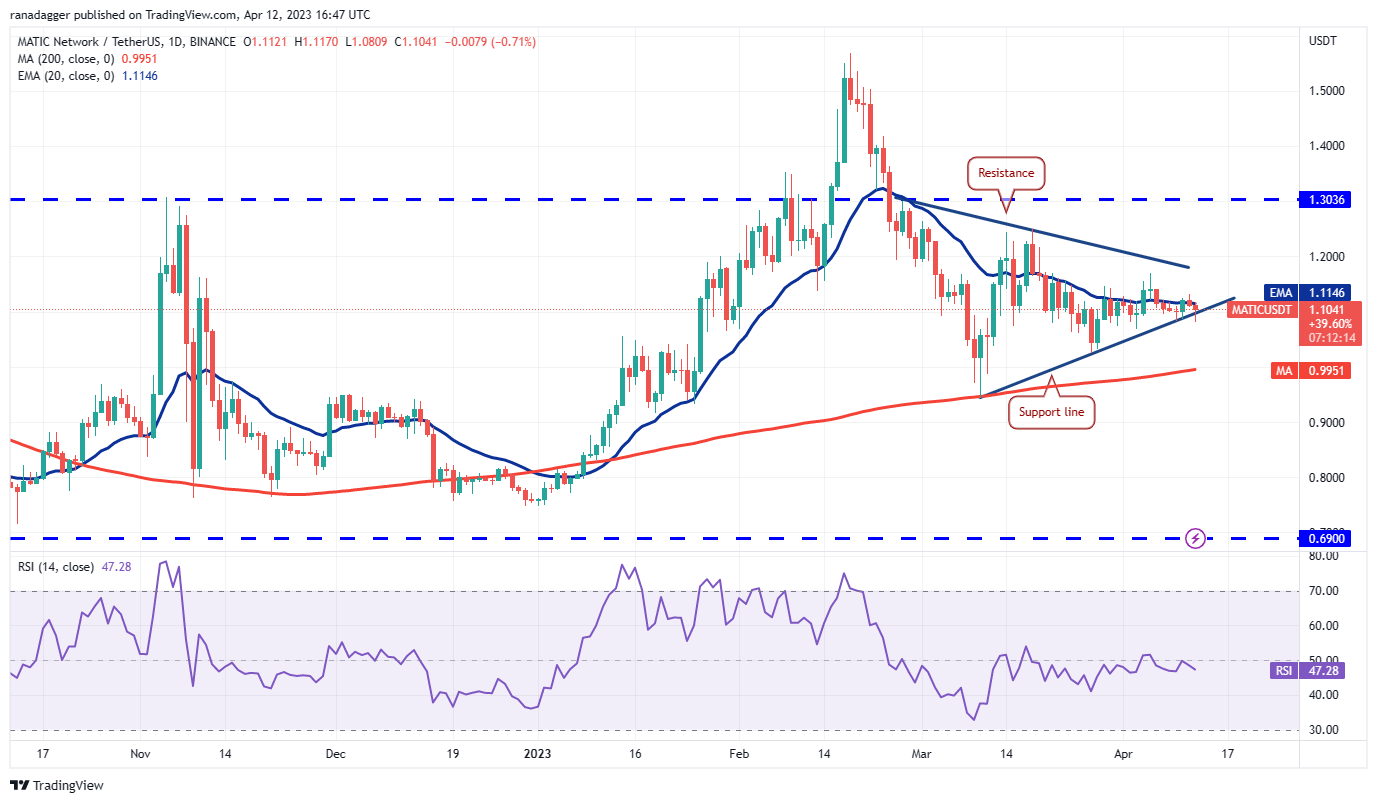
The bears are attempting to push Polygon (MATIC) below the support line of the symmetrical triangle pattern.
 MATIC/USDT daily chart. Source: TradingView
If they are successful, it will indicate that supply outstrips demand. The MATIC/USDT pair may then decline towards the 200-day SMA ($0.99), which is an important level to monitor. If this level fails, the pair could start a downtrend.
On the other hand, if the price rises from the current level and breaks above the 20-day EMA ($1.11), it will suggest that the breakdown may have been a bear trap. The pair may then attempt to climb above the resistance line of the triangle.
Related: Why is Dogecoin (DOGE) price down today?
Solana price analysis
After several days of hesitation, Solana (SOL) finally broke above the downtrend line on April 11. This marks the first sign that the downtrend might be concluding.
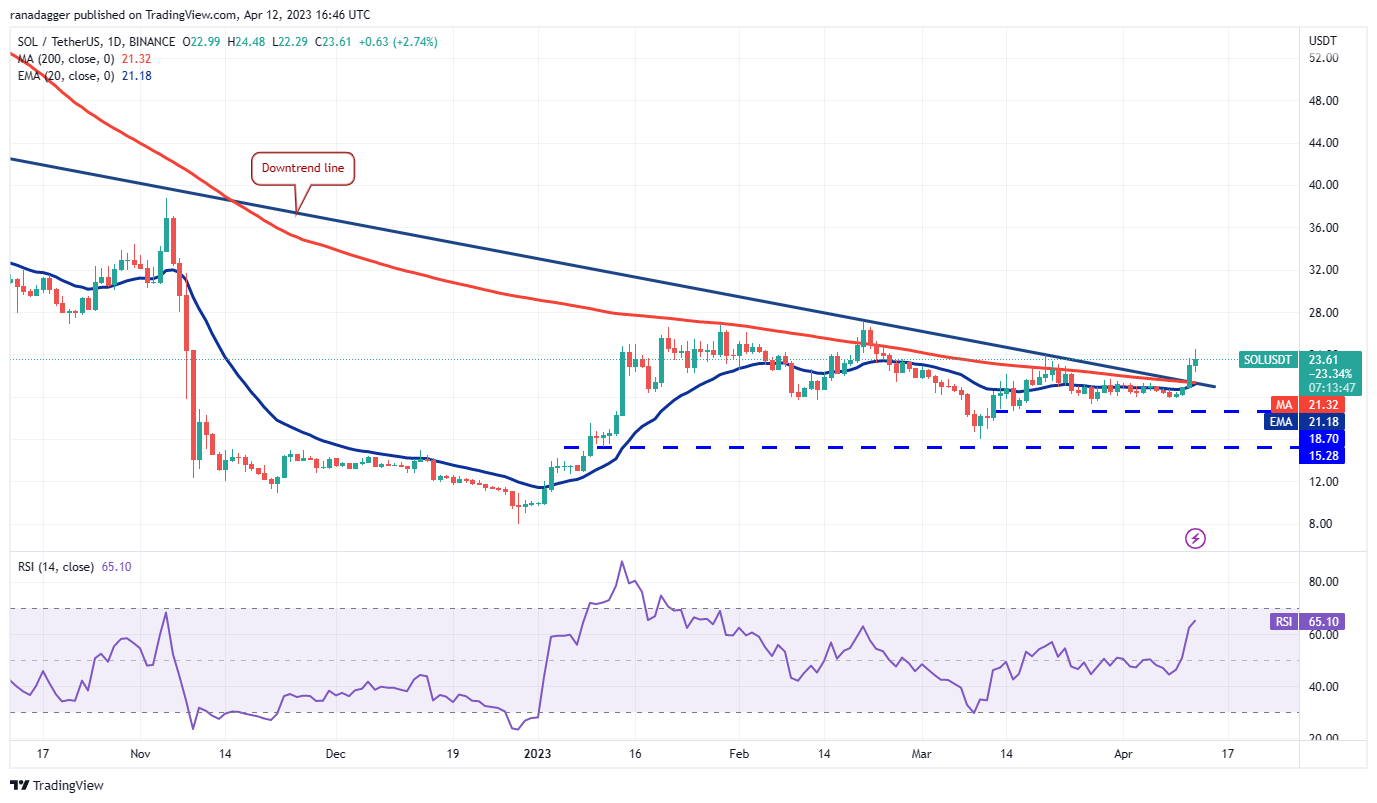 SOL/USDT daily chart. Source: TradingView
Typically, after a significant resistance breakout, the price will dip back to retest the level. In this instance, the price may fall to the breakout point. If the price rebounds from the downtrend line, it will suggest that bulls have converted the level into support. This will improve the prospects for a potential rally to $27.12 and then to $39.
This optimistic view will be invalidated if the price declines and breaks below the downtrend line, suggesting that the breakout may have been a bull trap. The SOL/USDT pair may then fall to $15.28.
Polkadot price analysis
Polkadot (DOT) declined from the downtrend line on April 12, indicating that the bears are vigorously defending this level.
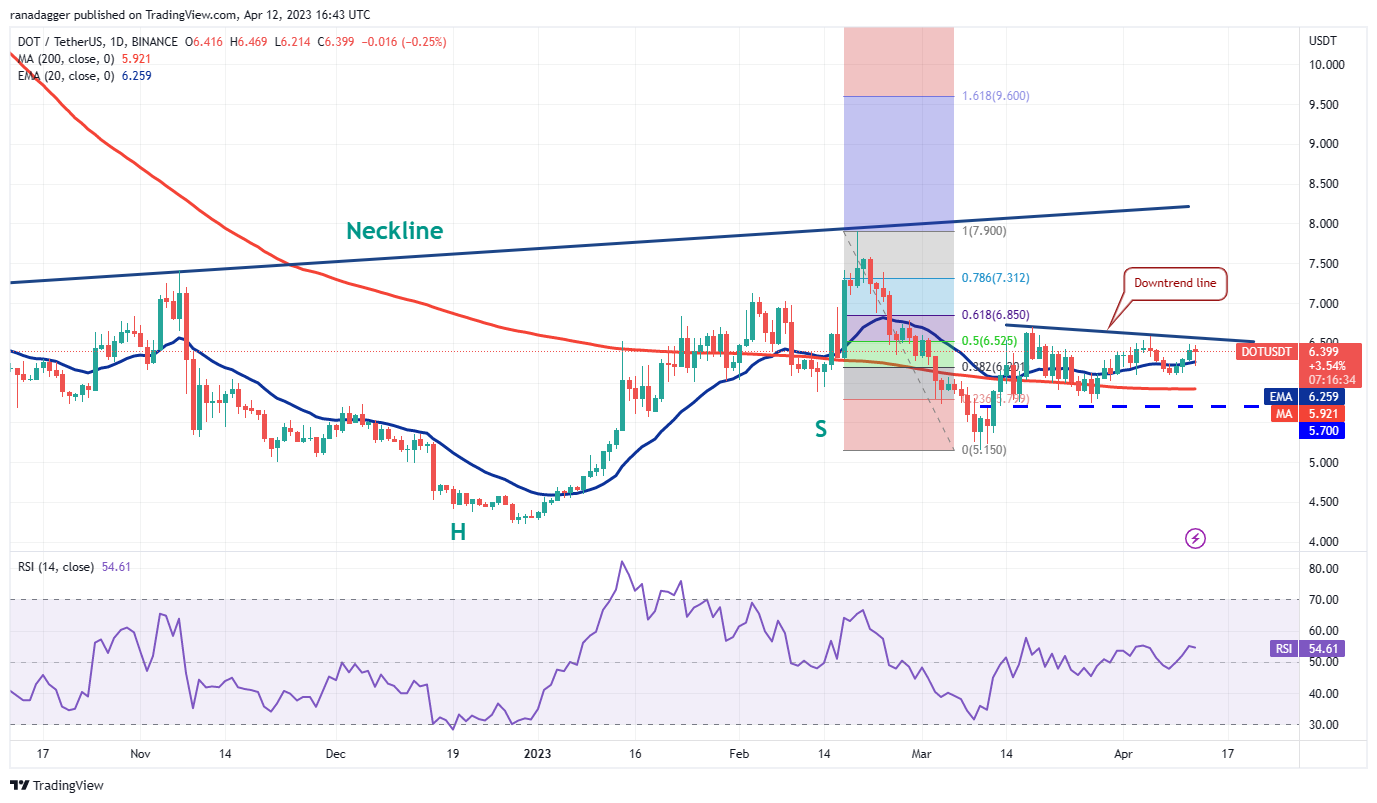 DOT/USDT daily chart. Source: TradingView
If the price dips and holds below the 20-day EMA ($6.24), the DOT/USDT pair may slide to the robust support at $5.70.
Conversely, if the price bounces from the 20-day EMA, it will suggest that traders are buying the minor dips. The bulls will then again attempt to push the price above the downtrend line. If they succeed, the pair is likely to gain momentum and soar towards the neckline of the H&S pattern.
Litecoin price analysis
Buyers managed to push Litecoin (LTC) above the resistance level of $96 on April 11, but they were unable to maintain those higher levels, as indicated by the long wick on the daily candlestick.
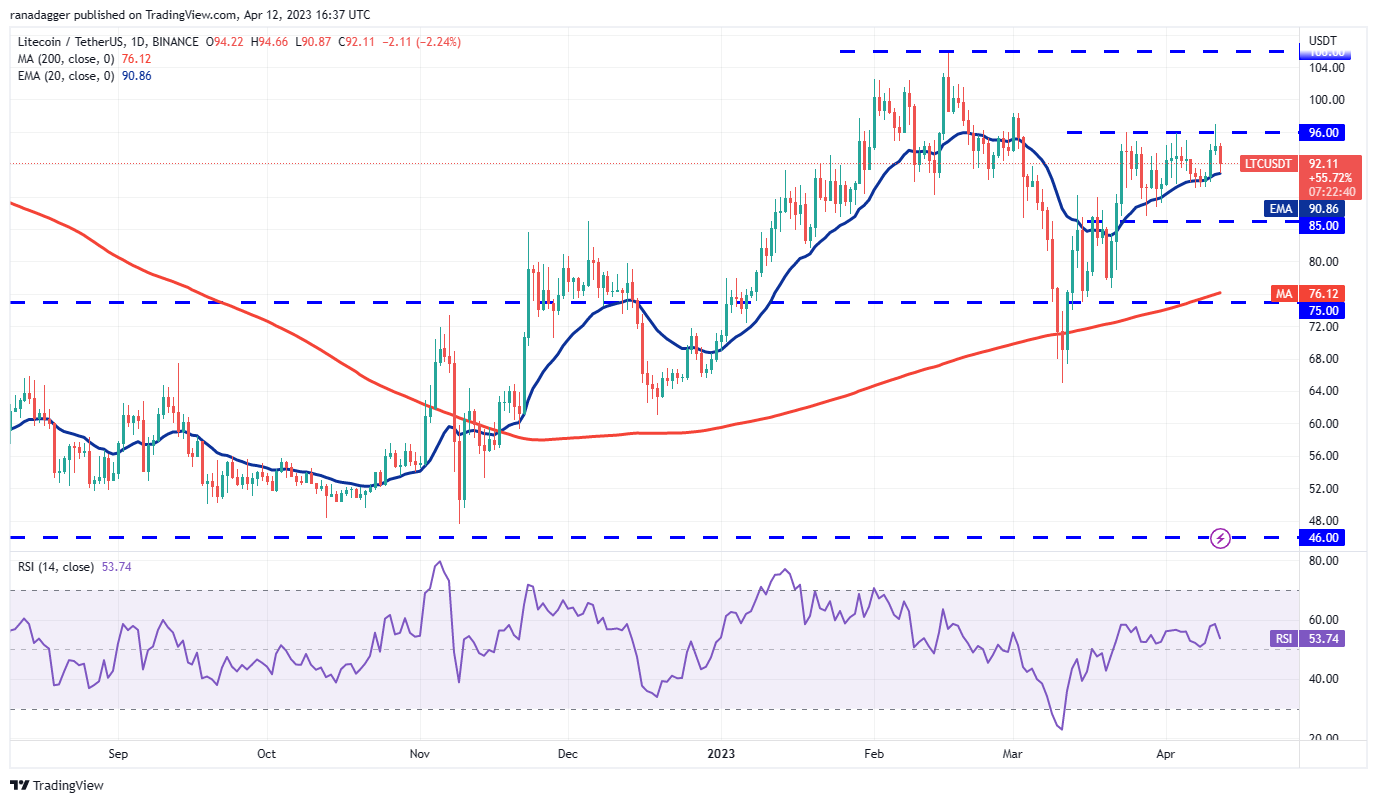 LTC/USDT daily chart. Source: TradingView
The bears took advantage of this to pull the price back to the 20-day EMA ($90). This is a crucial level to monitor, as a break and close below it could push the LTC/USDT pair down to the support at $85. A bounce from this level may keep the pair trapped within the $96 to $85 range for several days.
If the bulls wish to maintain their advantage, they need to push the price above $96. This would pave the way for a potential rise to $106. Conversely, a drop below $85 could drag the pair down to $75.
The opinions, thoughts, and views expressed here are solely those of the authors and do not necessarily reflect or represent the views and opinions of Cointelegraph.
This article does not provide investment advice or recommendations. Every investment and trading decision carries risks, and readers should conduct their own research before making a decision.