Disclaimer: Information found on CryptoreNews is those of writers quoted. It does not represent the opinions of CryptoreNews on whether to sell, buy or hold any investments. You are advised to conduct your own research before making any investment decisions. Use provided information at your own risk.
CryptoreNews covers fintech, blockchain and Bitcoin bringing you the latest crypto news and analyses on the future of money.
Bitcoin (BTC) is entering a new “speculation cycle” characteristic of a bull market, according to recent analysis.
In a tweet dated May 16, Philip Swift, the creator of the data resource LookIntoBitcoin and co-founder of the trading platform Decentrader, indicated that historical patterns are repeating themselves as per the RHODL Ratio metric.
RHODL Ratio creator on BTC price: “Zoom out”
The RHODL Ratio is a technique for monitoring BTC price trends based on the realized price of the supply — the price at which coins last changed hands.
Developed by Swift in 2020, it assesses the relative ages of coins that moved one week ago compared to those that moved 1-2 years ago.
This ratio provides insight into the relative activity of short-term holders (STHs) and long-term holders (LTHs), and consequently, the degree of speculation present in the market.
At present, the RHODL is rising, having reached its green accumulation zone at the close of 2022.
At that time, Swift informed Cointelegraph that Bitcoin was “at the point of maximum opportunity” — a statement that has since been validated, with BTC/USD increasing by 70% in Q1 2023.
Before this, its decline toward that point had aligned with Bitcoin’s own drop to macro lows.
Now, with speculative activity appearing to rise, he posits that a new bull cycle is already in progress.
“When I developed the bitcoin RHODL Ratio indicator in 2020, one observation that struck me was how it indicated a new bull run forming…when the ratio value of younger coins began to rise. This is where we find ourselves currently,” he remarked.
“Don’t panic about minor price pullbacks. Zoom out.”
Related Posts
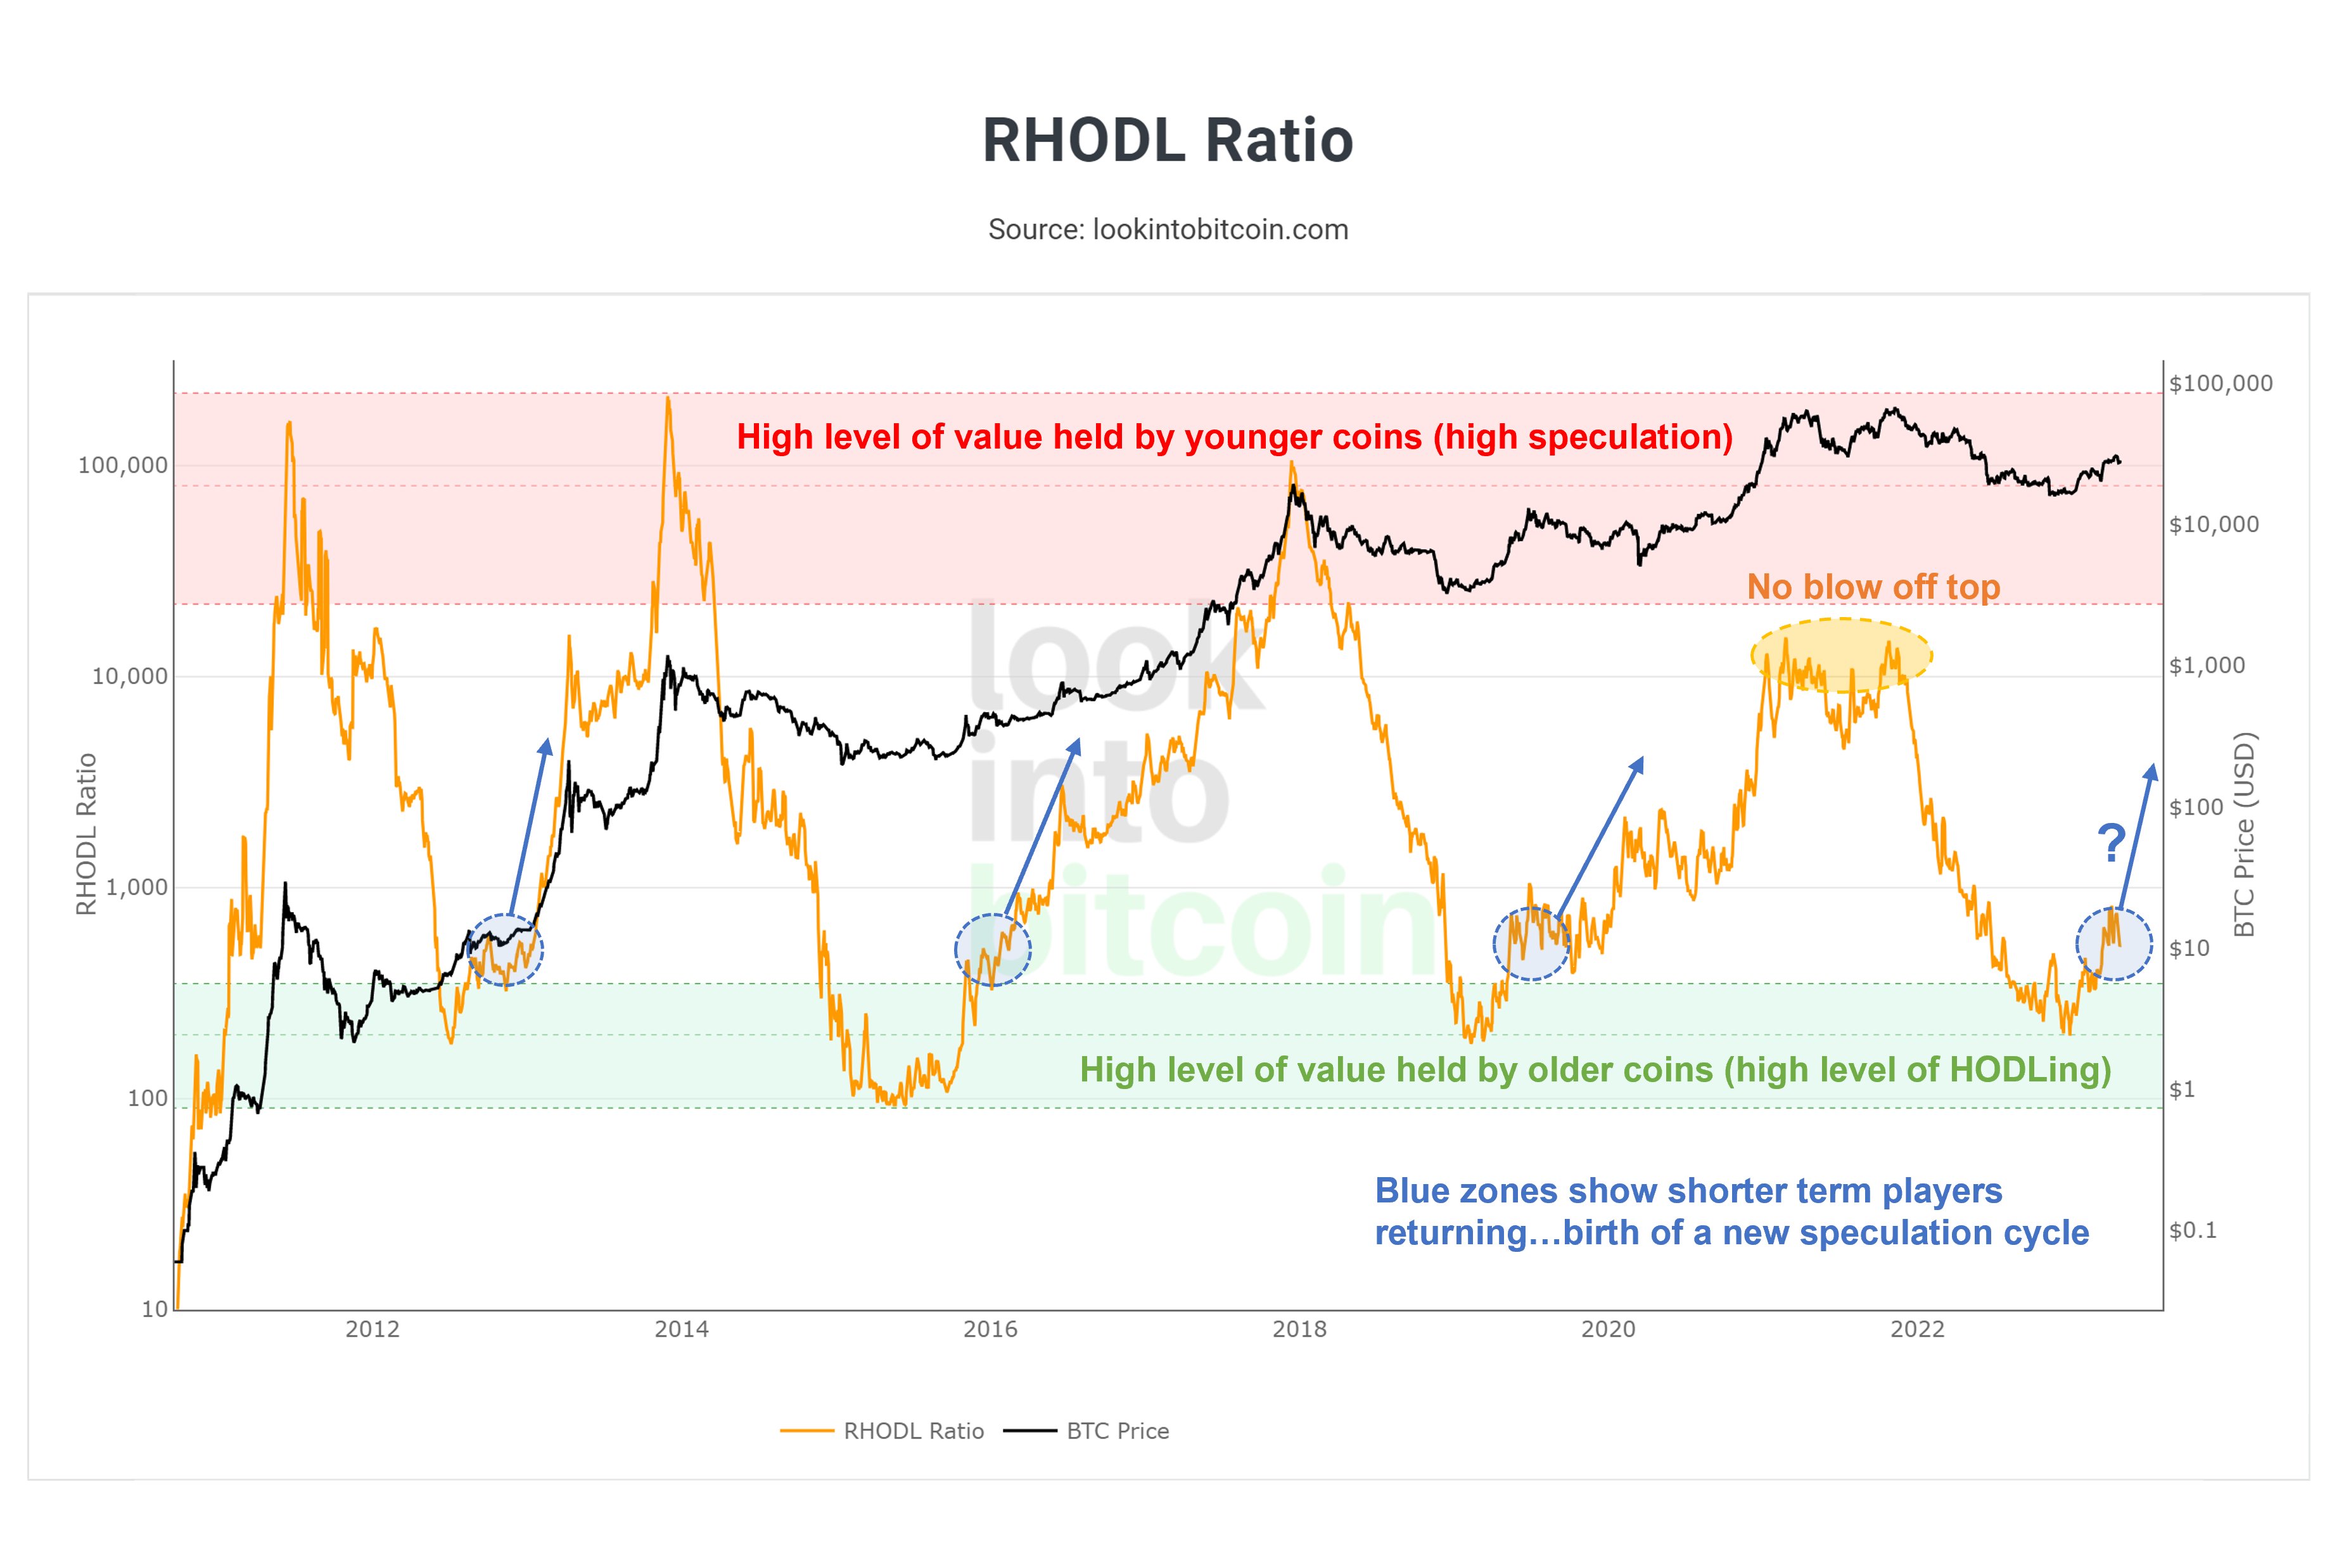 Bitcoin RHODL Ratio annotated chart. Source: Philip Swift/ Twitter
Swift’s perspective is shared by others. In response, Checkmate, the lead on-chain analyst at Glassnode, referred to the RHODL Ratio as “one of the greatest on-chain finds.”
An accompanying chart noted that the 2021 bull market, despite resulting in a blow-off top for BTC/USD, did not replicate a similar move for RHODL. The last instance when the metric reached its red “high speculation” zone was during Bitcoin’s previous all-time high in late 2017.
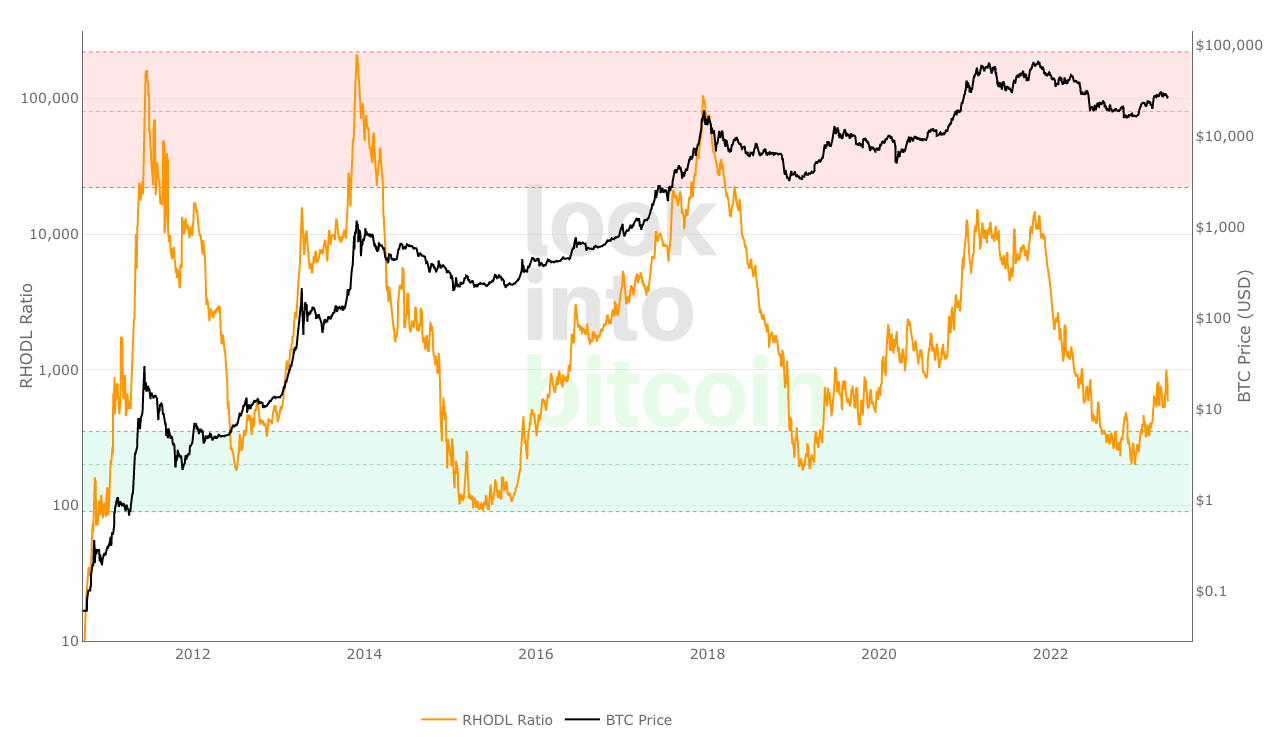 Bitcoin RHODL Ratio chart (screenshot). Source: LookIntoBitcoin
Fear, depression and lack of interest
Continuing, Swift asserted that on shorter timeframes, market participants are maintaining a risk-averse stance in the crypto markets.
Related: Watch these BTC price levels as Bitcoin threatens to lose $27K support
This conclusion followed an analysis of funding rates on exchanges, which revealed a series of “bearish” ratings for Bitcoin generated by Decentrader. These ratings were based on open interest, long/short ratios, and the funding rates themselves.
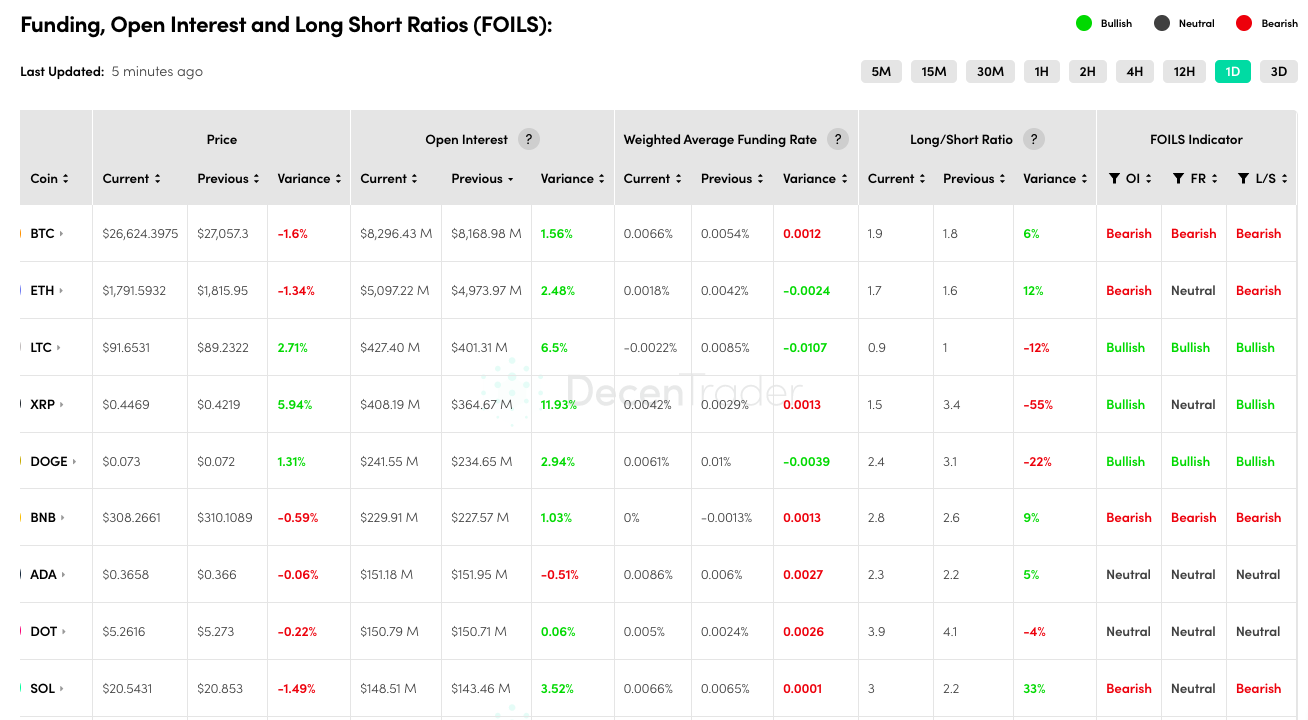 Market data for various major cryptocurrencies (screenshot). Source: Decentrader
“The market is still fearful/depressed/uninterested…” he summarized on that day.
Earlier this month, Swift provided Cointelegraph with an updated outlook on potential developments for Bitcoin in the final year leading up to its next block subsidy halving. Among other possibilities, a return to $20,000 is not out of the realm of possibility.
Magazine: Alameda’s $38B IRS bill, Do Kwon kicked in the assets, Milady frenzy: Asia Express
This article does not offer investment advice or recommendations. Every investment and trading decision carries risk, and readers should perform their own research before making a choice.