Disclaimer: Information found on CryptoreNews is those of writers quoted. It does not represent the opinions of CryptoreNews on whether to sell, buy or hold any investments. You are advised to conduct your own research before making any investment decisions. Use provided information at your own risk.
CryptoreNews covers fintech, blockchain and Bitcoin bringing you the latest crypto news and analyses on the future of money.
This week, Bitcoin’s (BTC) volatility has diminished further, and it appears poised to create an inside-bar pattern on the weekly chart. While bulls are struggling to overcome the resistance in the $30,000 to $31,000 range, a favorable indication is that they have not yielded territory to the bears.
Not only cryptocurrencies, but the S&P 500 Index has also been fluctuating within a range for several days. This suggests that the markets are anticipating a catalyst to initiate the next directional movement.
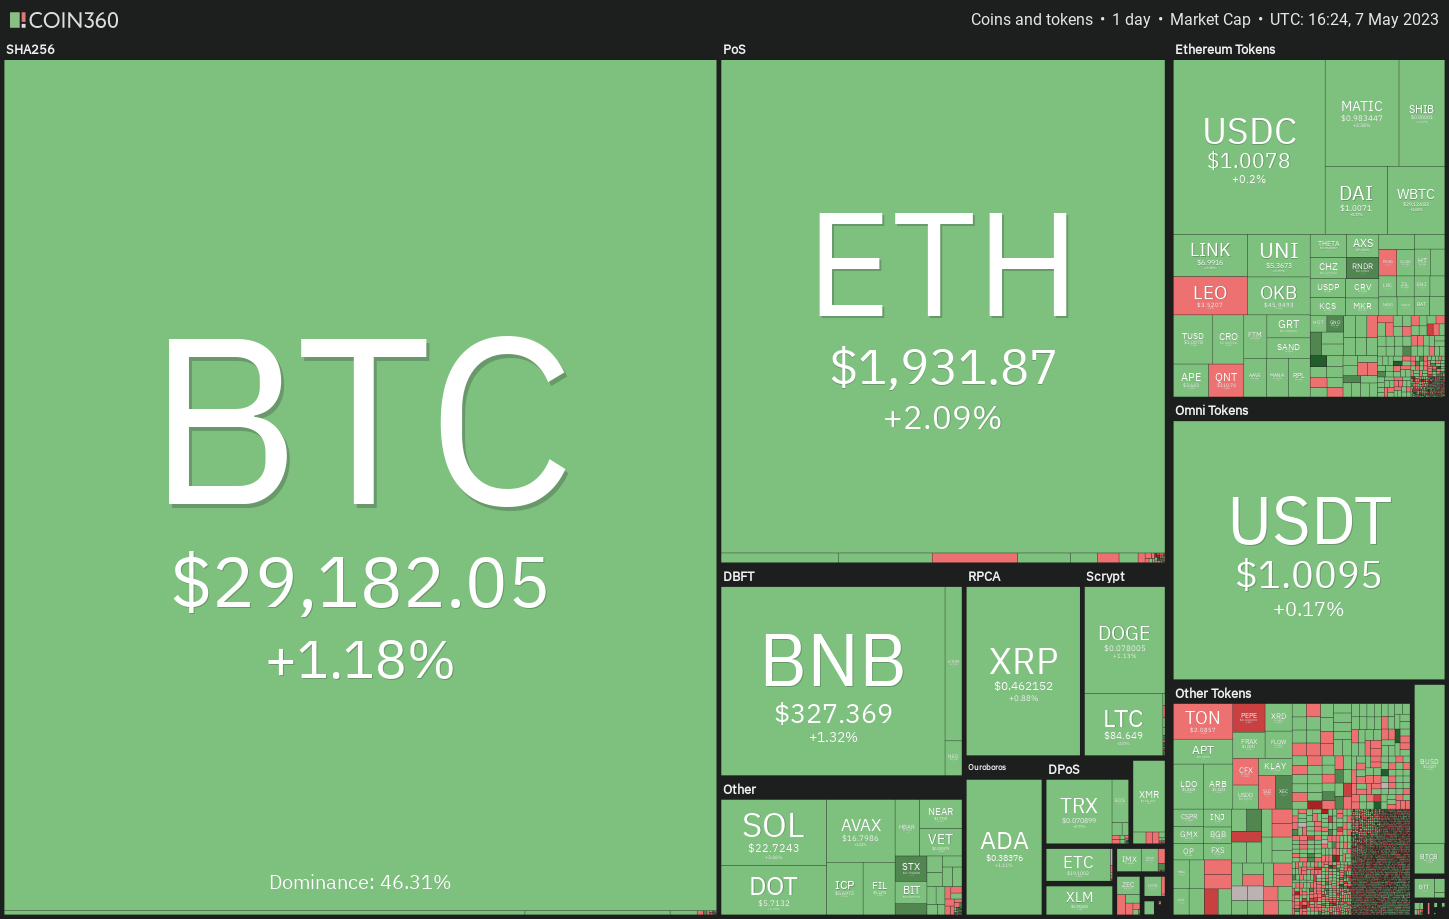 Crypto market data daily view. Source:Coin360
Despite the uncertainty in short-term price movements, analysts are becoming optimistic about the long-term outlook. Trader Titan of Crypto pointed out a potential signal on the monthly Bollinger Bands chart, which forecasts a rise to $63,500 within approximately a year.
While most leading cryptocurrencies have lost some value over the past week, there are still areas of resilience. Let’s examine the charts of five cryptocurrencies that may experience upward movement in the near term.
Bitcoin price analysis
Bitcoin sharply declined from the resistance line of the symmetrical triangle pattern on May 6, indicating that bears are unwilling to allow bulls to advance. A slight positive is that bulls have been purchasing dips to the triangle’s support line, as evidenced by the long tail on the day’s candlestick.
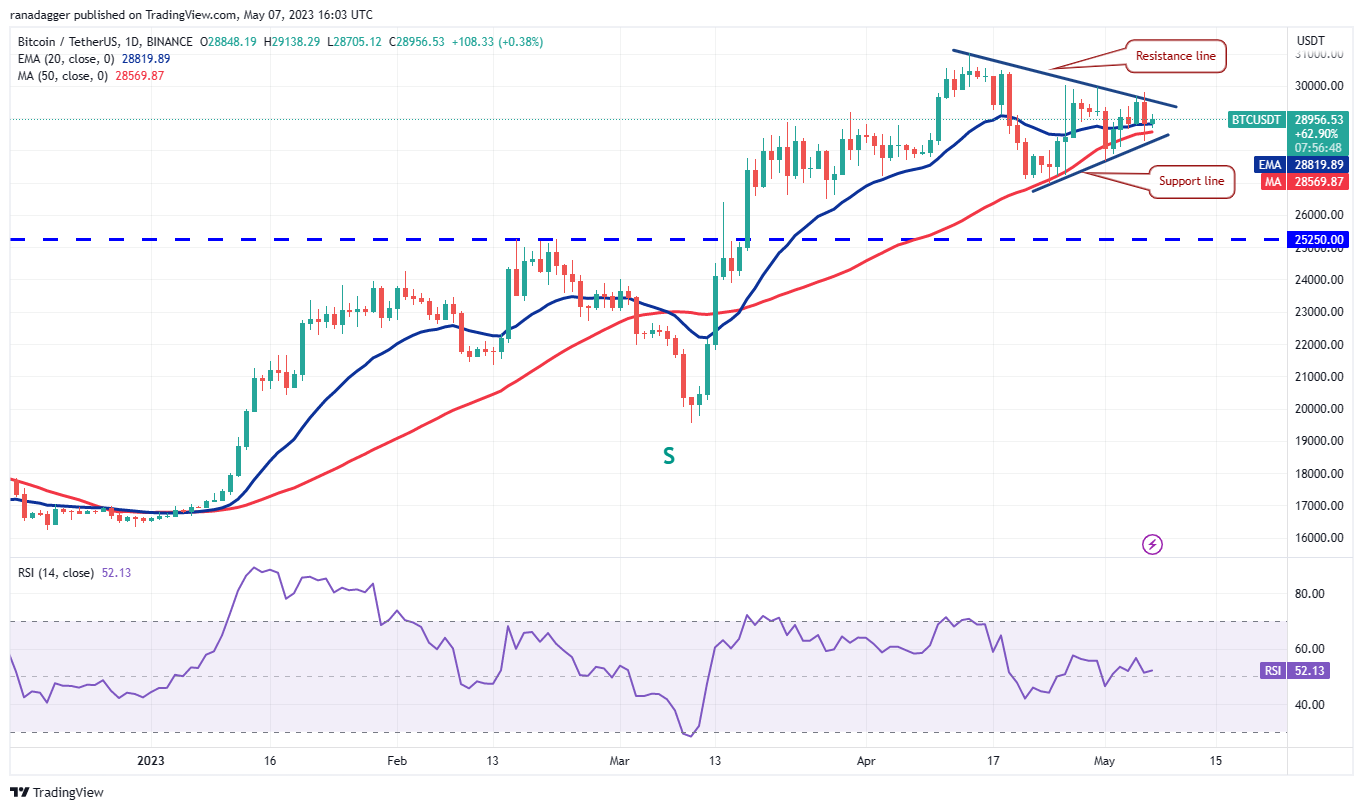 BTC/USDT daily chart. Source: TradingView
The flat 20-day exponential moving average ($28,819) and the relative strength index (RSI) near the midpoint do not indicate a definitive advantage for either bulls or bears.
If the price falls below the triangle, it will imply that bears are attempting to take control. The BTC/USDT pair may initially drop to $26,942 and subsequently to $25,250.
Conversely, a breakout and close above the triangle will indicate that bulls have absorbed the supply. This could trigger a rally to $32,400, where bears are expected to mount a strong defense once again.
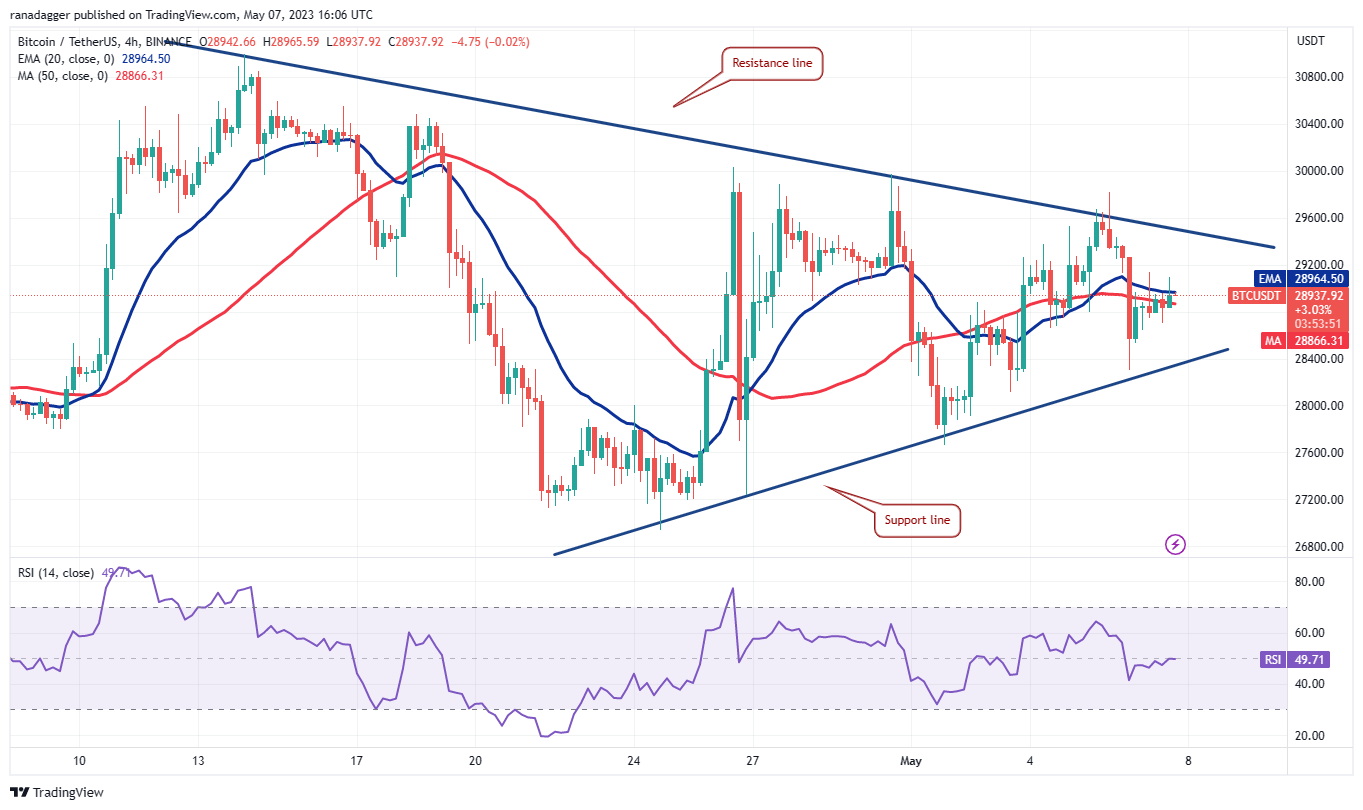 BTC/USDT 4-hour chart. Source: TradingView
Buyers pushed the price above the triangle, but the long wick on the candlestick indicates that the breakout was a bull trap in the short term. The BTC price sharply declined and fell to the triangle’s support line.
The rebound from this level has reached the moving averages, which is a crucial short-term level to monitor. If Bitcoin’s price declines from the current level, it will increase the likelihood of a break below the support line.
On the other hand, if buyers manage to push the price above the moving averages, the pair may rise to the resistance line. Bulls will need to drive and maintain the price above this level to initiate an upward movement.
Ether price analysis
Ether (ETH) encountered significant resistance above the psychological barrier at $2,000 on May 7. This indicates that bears are still active and continue to defend the overhead resistance levels.
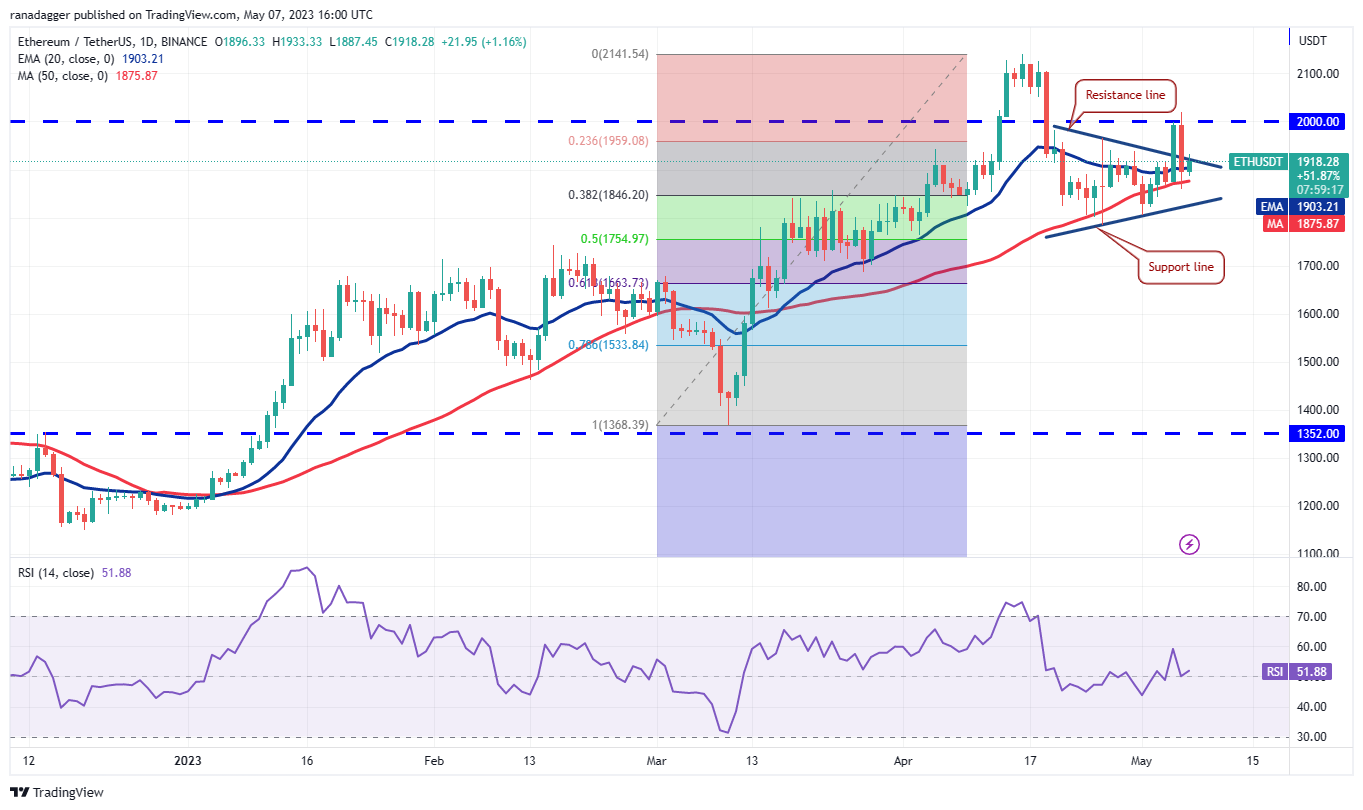 ETH/USDT daily chart. Source: TradingView
The 20-day EMA ($1,903) has leveled off, and the RSI is near the midpoint, suggesting that the ETH/USDT pair may remain within a range in the near term. The range could be defined between $2,000 and $1,785.
A consolidation just below the recent high is a positive indicator. It suggests that bulls are not rushing to take profits, which increases the likelihood of a breakout above $2,200.
Conversely, if the price drops below $1,785, it will indicate that bears have taken control. This could initiate a decline to $1,619.
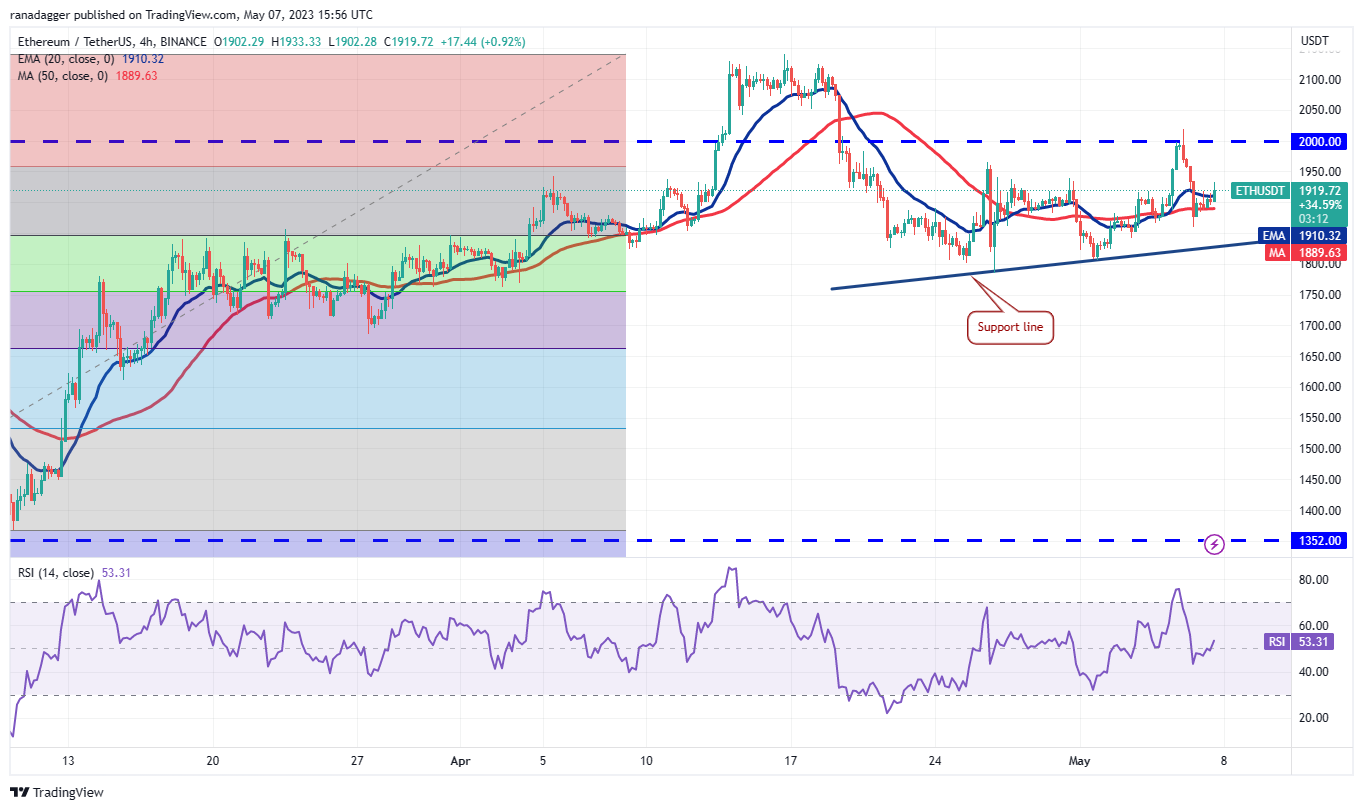 ETH/USDT 4-hour chart. Source: TradingView
The 4-hour chart reveals that bears were unable to capitalize on the break below the 50-simple moving average. This indicates that selling pressure is diminishing at lower levels. Bulls are attempting to recover by maintaining the price above the 20-EMA. If successful, the pair will again attempt to retest the critical resistance at $2,000.
On the contrary, if the ETH price declines from the current level and breaks below the 50-SMA, it will suggest that bears are in control. This could lead to a drop to the support line.
Monero price analysis
Monero (XMR) is attempting to remain above the moving averages, indicating that bulls are making an effort to recover.
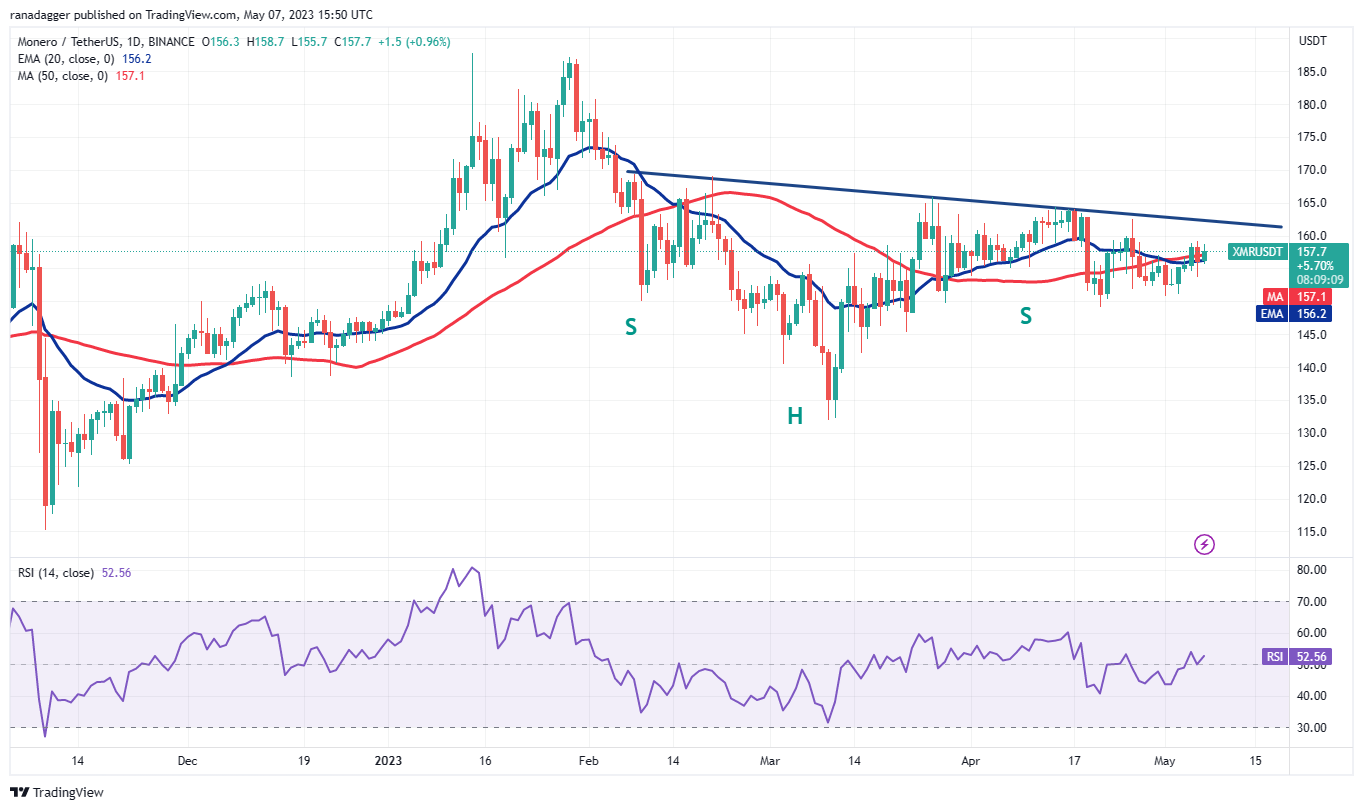 XMR/USDT daily chart. Source: TradingView
Related Posts
The flat 20-day EMA ($156) and the RSI just above the midpoint suggest a balance between supply and demand. If buyers push the XMR price above the neckline of the inverse head and shoulders pattern, the advantage will shift in their favor.
The XMR/USDT pair may then initiate a new upward movement. There is minor resistance at $181, but if surpassed, the pair could reach $187.
Alternatively, if the price declines from the current level or the neckline, it will indicate that bears remain active at higher levels. Sellers will then attempt to pull the price below the $149 support, opening the possibility for a decline to $130.
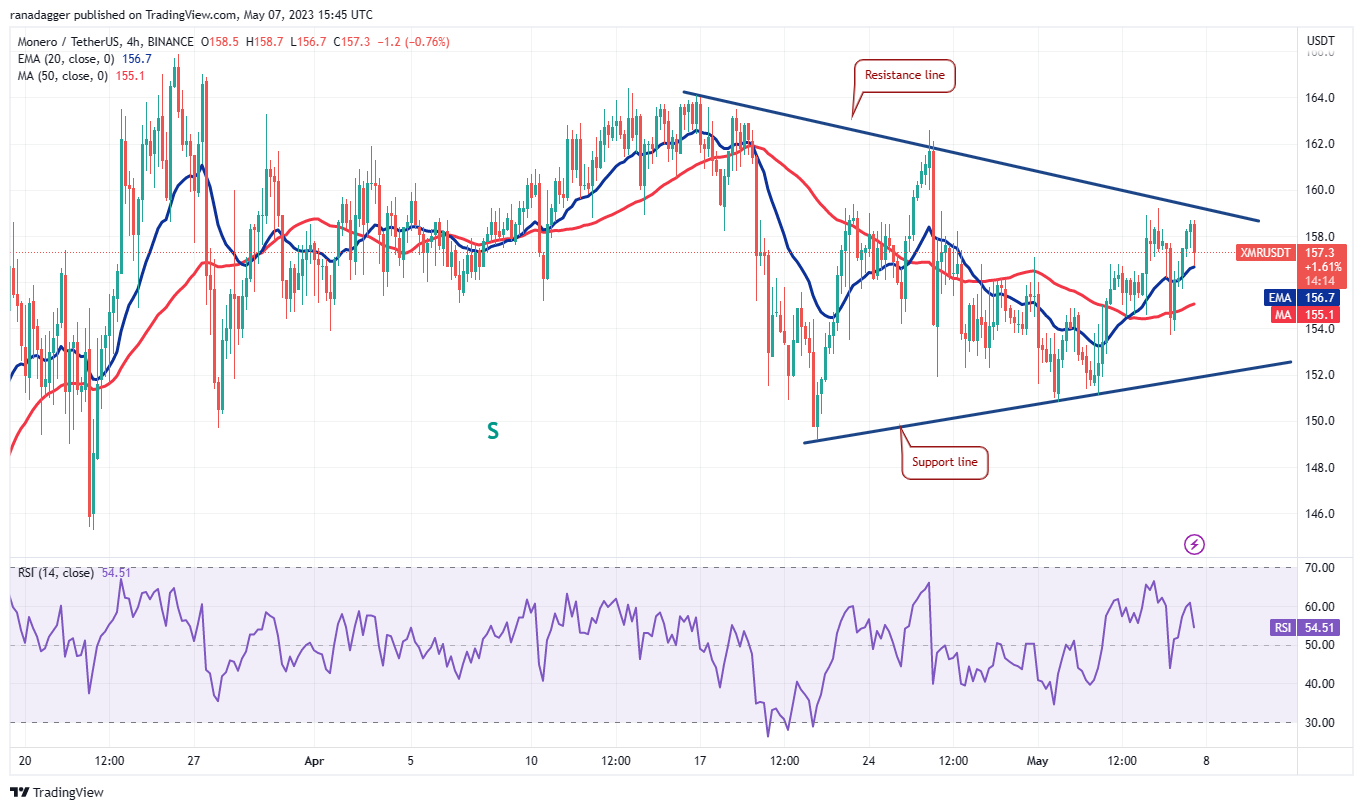 XMR/USDT 4-hour chart. Source: TradingView
The 4-hour chart shows that the price bounced off the 50-SMA, but bulls could not break through the resistance line. This indicates that bears are selling during rallies. If the price retraces from the 20-EMA, it will suggest that sentiment is shifting positively and traders are buying on dips.
Bulls will then make another attempt to overcome the overhead resistance. If they succeed, the pair could first rise to $162 and then to $164.
Conversely, if the price declines and breaks below the 50-SMA, it will indicate that bears are in control. This will heighten the likelihood of a retest of the support line.
Related: The Ethereum Foundation just sold $30M in Ether — But will ETH price fall this time?
OKB price analysis
OKB (OKB) is currently trading within a large symmetrical triangle pattern. Typically, in this configuration, traders buy near the support line and sell near the resistance.
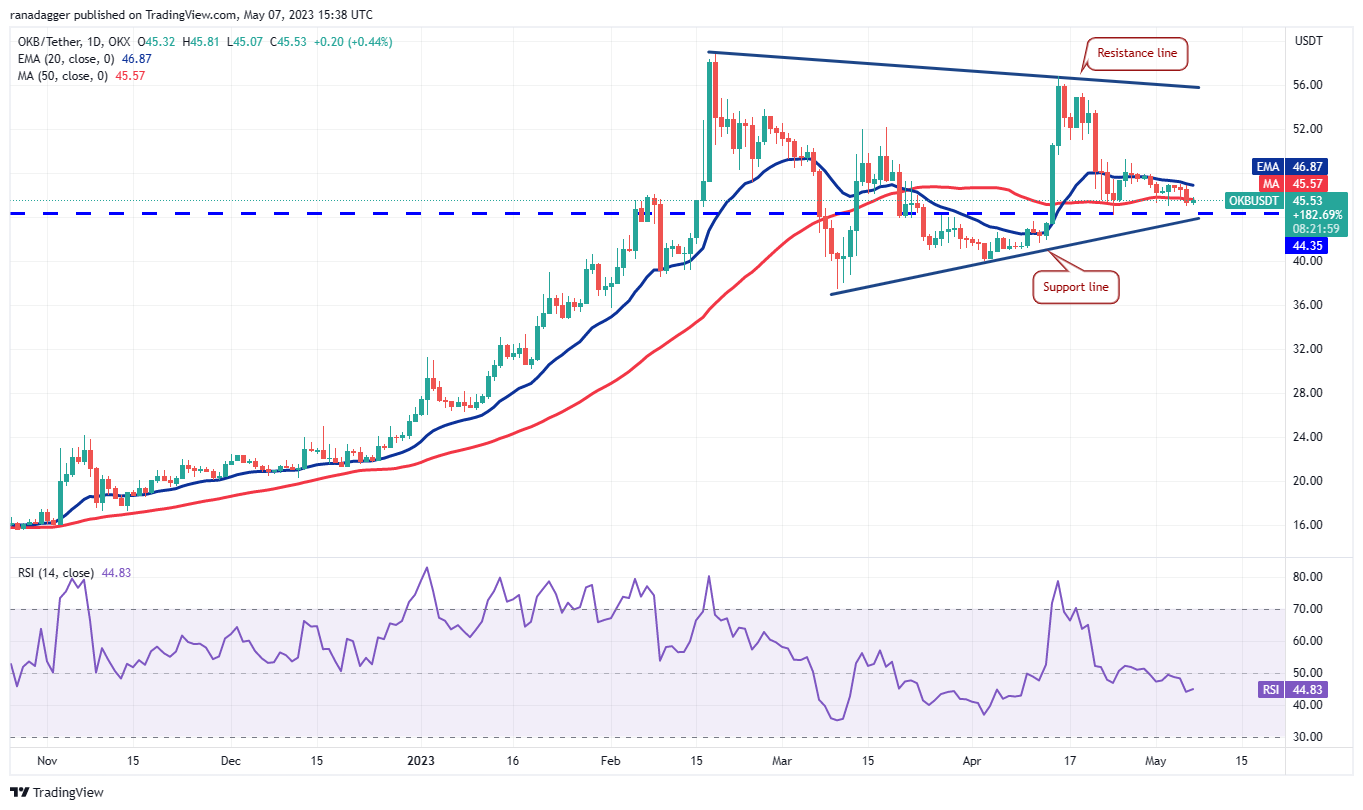 OKB/USDT daily chart. Source: TradingView
Bears are attempting to keep the OKB price below the 50-day SMA ($45.57), while bulls are trying to reclaim this level. If the price rises from the current level or rebounds off the support line, it will indicate demand at lower levels.
If buyers push the price above the 20-day EMA ($46.87), it will suggest that the OKB/USDT pair may remain within the triangle for a longer duration.
In contrast, if bears drive the price below the triangle, it will indicate that the setup has acted as a reversal pattern. This could initiate a new downtrend, likely pulling the pair down to $37.
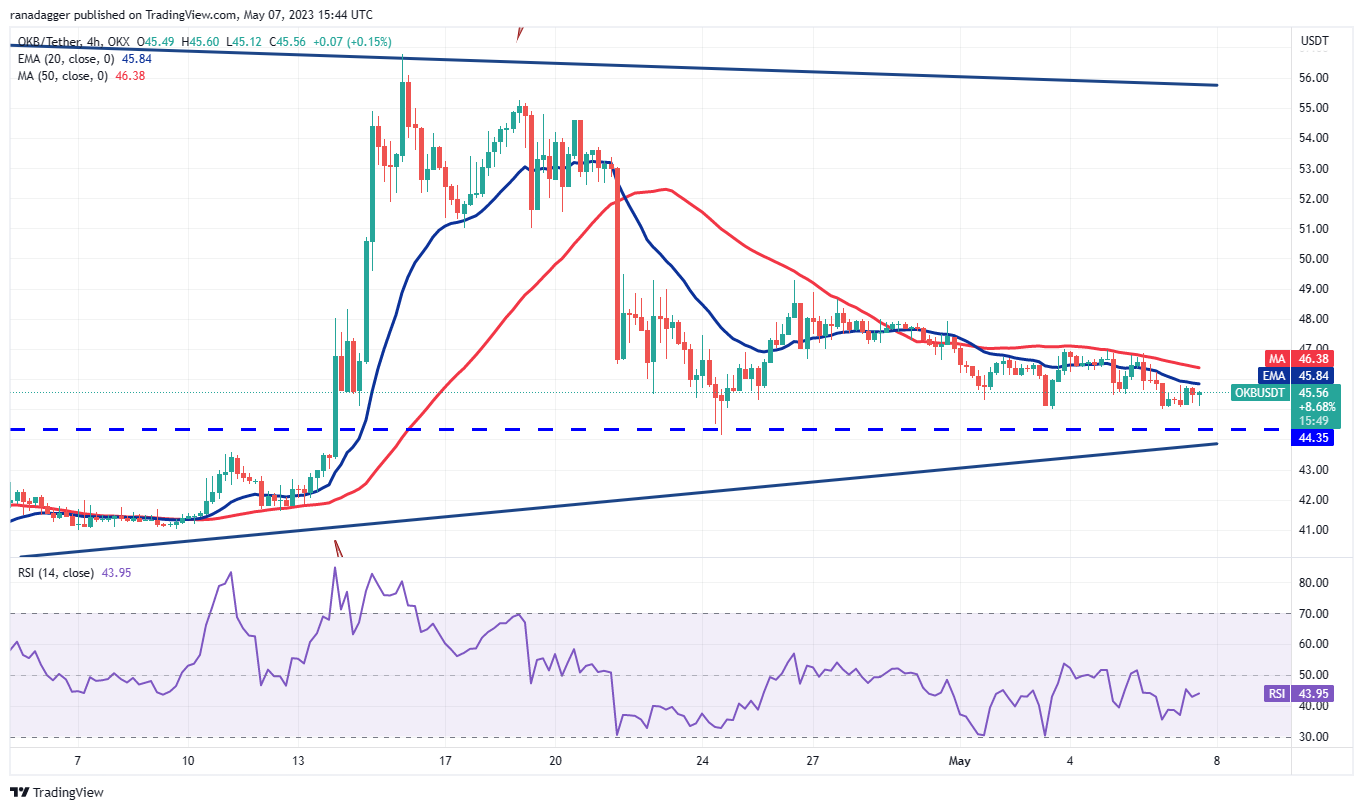 OKB/USDT 4-hour chart. Source: TradingView
The 4-hour chart indicates that bulls are trying to defend the horizontal support near $44.35, but they have not been able to push the price above the moving averages. This suggests that every minor relief rally is being sold off. If the price declines from the current level and falls below $44.35, the pair may drop to $41.70.
Conversely, if the price rises above the moving averages, it will signal accumulation at lower levels. The pair could initially rise to $49.50 and then attempt a rally to $53.
Rocket Pool price analysis
Rocket Pool (RPL) appears strong as it is trading above the moving averages, indicating that bulls are buying on dips.
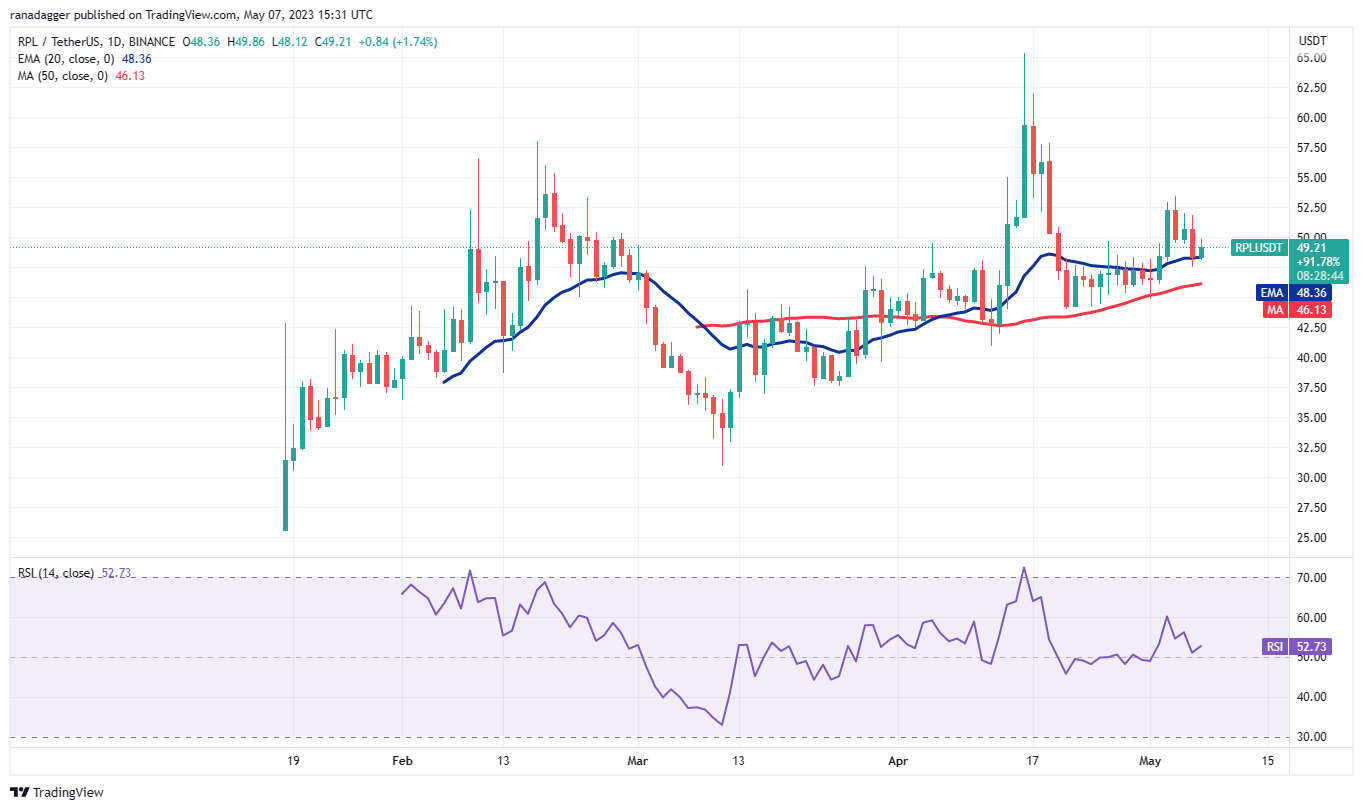 RPL/USDT daily chart. Source: TradingView
Bulls will need to push the price above the overhead resistance at $53.45 to indicate that the corrective phase may be concluding. The RPL/USDT pair may then attempt a rally to $58.
Another scenario is that the RPL price rises from the 20-day EMA ($48.36) but declines from $53.45. This would suggest a potential range-bound action between the 50-day SMA ($46.13) and $53.45 for a period.
A break and close below the 50-day SMA will be the initial indication that bears are gaining control. This would open the possibility for a decline to $37.
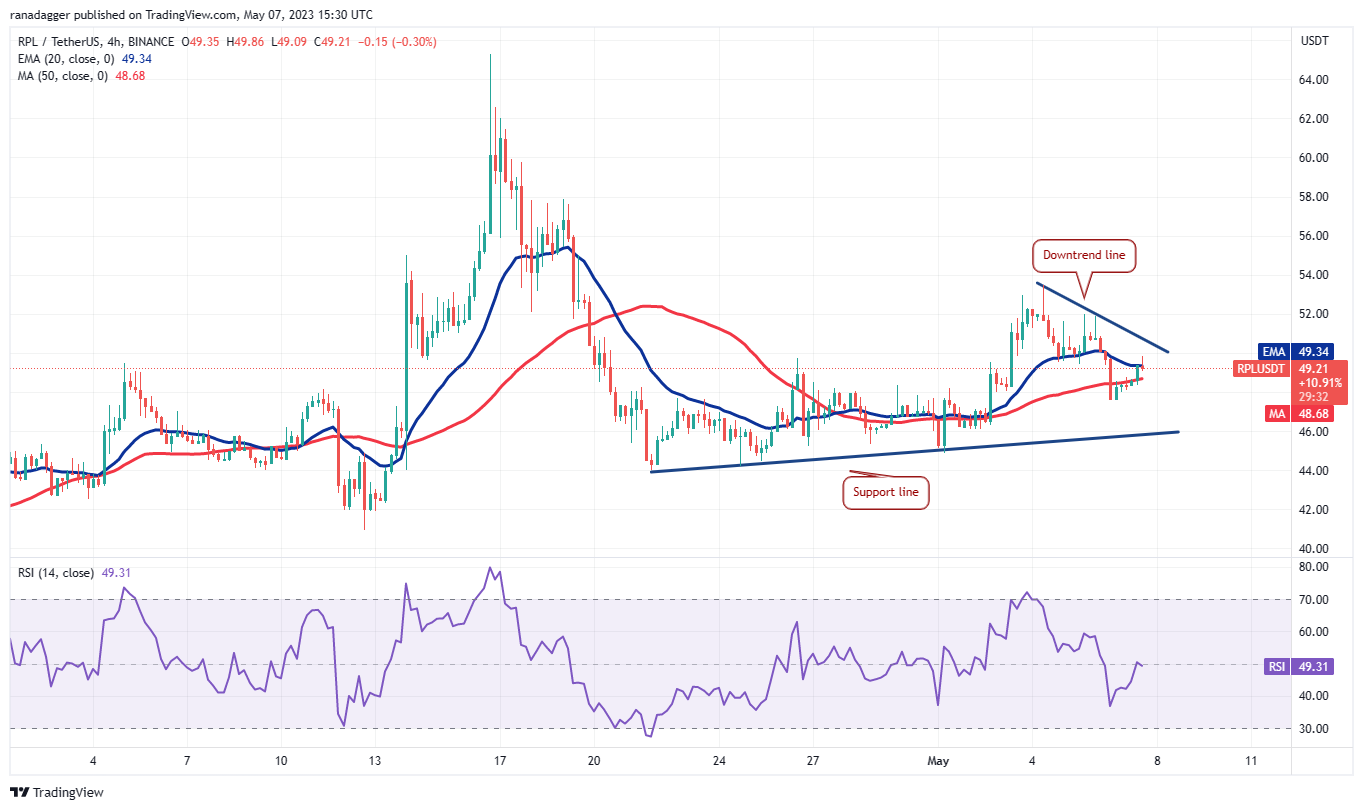 RPL/USDT 4-hour chart. Source: TradingView
The 4-hour chart shows that bears are attempting to maintain the price below the 20-EMA while bulls are trying to push it above. If buyers succeed, the pair may rise to the downtrend line, which is a key short-term level to monitor. If this resistance is surpassed, the pair may rally to $53.45.
Conversely, if the price declines from the current level and breaks below the 50-SMA, it risks dropping to the support line. Bulls are likely to defend this level vigorously.
This article does not contain investment advice or recommendations. Every investment and trading move involves risk, and readers should conduct their own research when making a decision.