Disclaimer: Information found on CryptoreNews is those of writers quoted. It does not represent the opinions of CryptoreNews on whether to sell, buy or hold any investments. You are advised to conduct your own research before making any investment decisions. Use provided information at your own risk.
CryptoreNews covers fintech, blockchain and Bitcoin bringing you the latest crypto news and analyses on the future of money.
The financial sector significantly depends on indicators to assess market sentiment and forecast upcoming trends. Among these, the Volatility Index, often referred to as the VIX, is a key gauge of market apprehension.
Developed by the Chicago Board Options Exchange, the VIX is an index that reflects the market’s forecast of 30-day future volatility. It is derived from the implied volatilities of a broad array of S&P 500 index options; a high VIX generally indicates increased investor anxiety, whereas a low value implies a stable market.
Conversely, the S&P 500 Index, or SPX, acts as a barometer for the overall condition of the U.S. stock market. It includes 500 of the largest U.S. companies based on market capitalization, and its fluctuations are closely monitored by traders, analysts, and institutional investors. Traditionally, the VIX and the SPX have exhibited an inverse correlation: as the SPX increases, signaling bullish sentiment, the VIX typically declines, indicating lower market anxiety, and vice versa.
However, recent market data presents an atypical scenario. Over the past three months, the SPX experienced a drop of 3.37%, clearly reflecting some bearish sentiment. In contrast, the VIX surged during the same timeframe, rising by 38.41%.
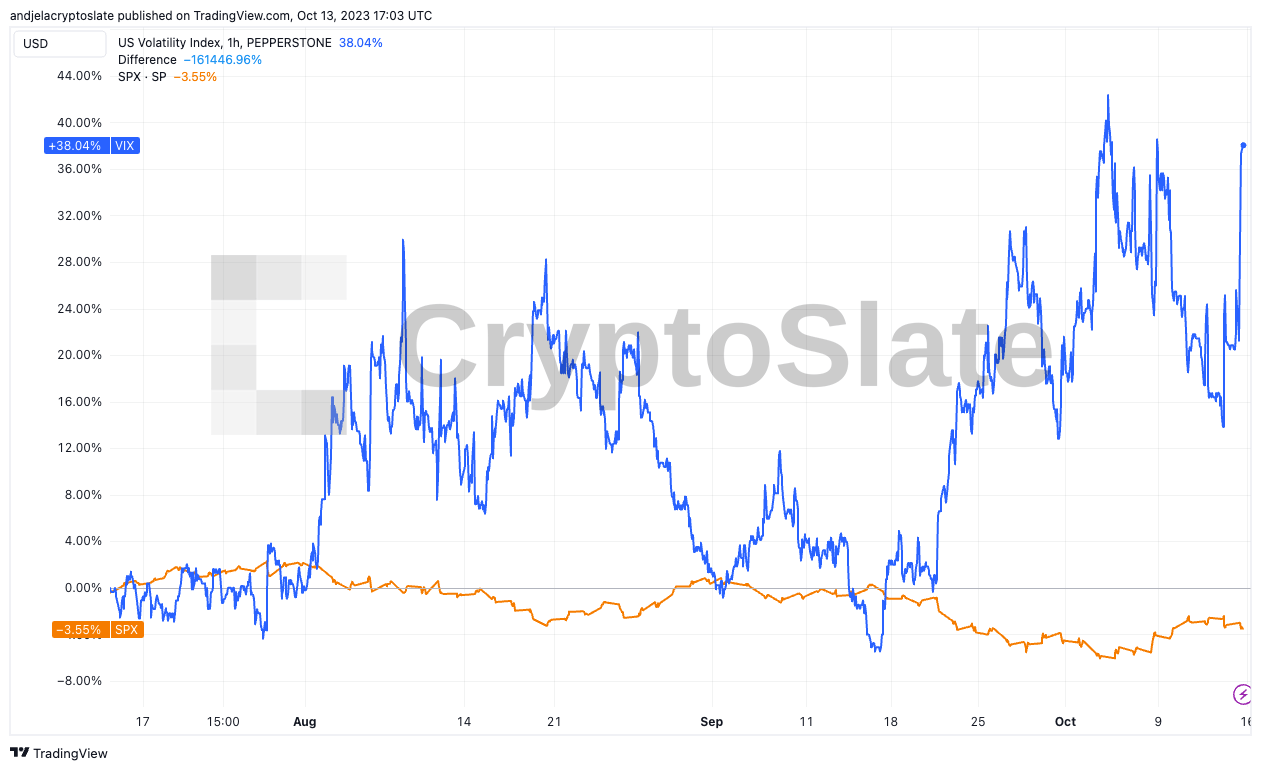 Graph illustrating the divergence between VIX and SPX from Jul. 12 to Oct. 13, 2023 (Source: TradingView)
This divergence is also evident in a shorter one-month period: the SPX fell by 3%, while the VIX escalated by 32.8%.
Related Posts
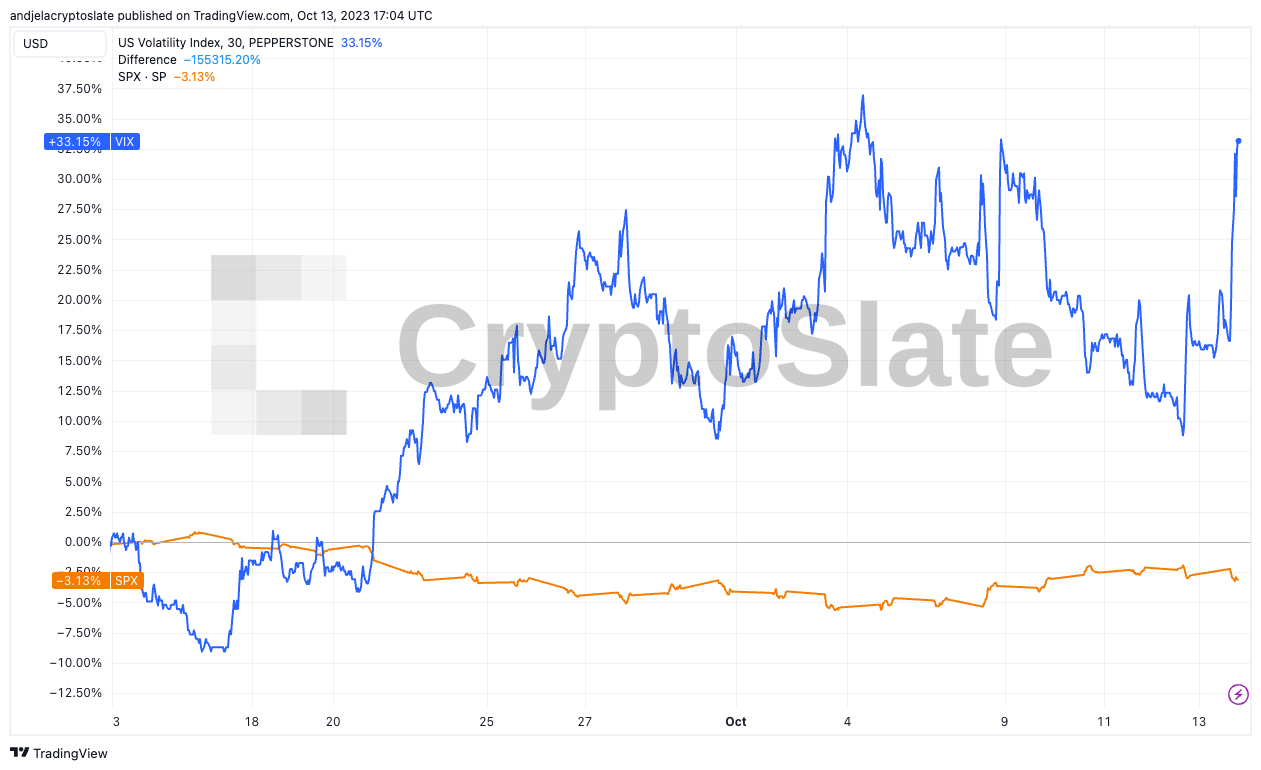 Graph illustrating the divergence between VIX and SPX from Sep. 12 to Oct. 13, 2023 (Source: TradingView)
The discrepancy on Oct. 13 was even more striking — in just one trading day, the VIX soared by an alarming 13.54%. Meanwhile, the SPX, instead of mirroring this volatility spike, remained nearly unchanged, recording a slight 0.82% decline.
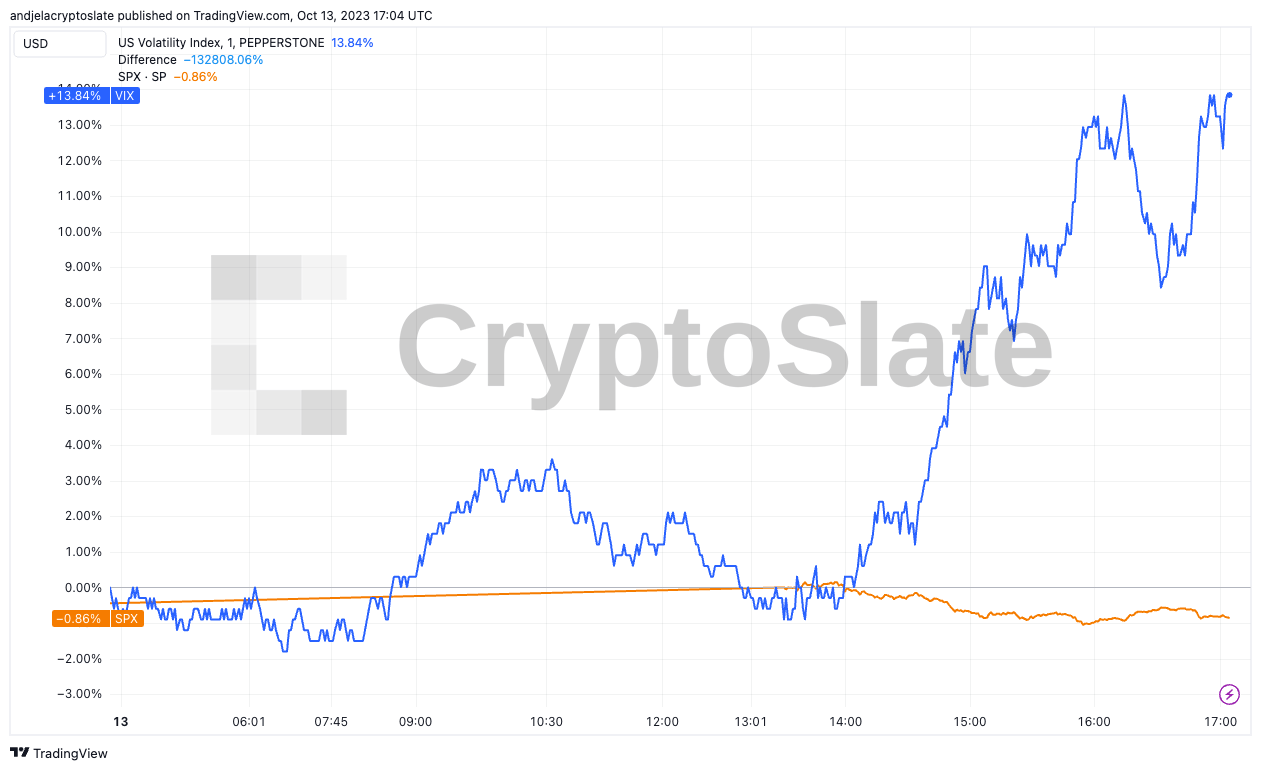 Graph illustrating the divergence between VIX and SPX from Oct. 12 to Oct. 13, 2023 (Source: TradingView)
This significant divergence raises questions. Several factors may be contributing to this irregularity. Firstly, the market could be anticipating substantial future movements in the SPX that are not yet apparent in its current price. Secondly, external events or geopolitical tensions might affect market derivatives more than the cash market, resulting in an inflated VIX. Lastly, structural changes or shifts in market dynamics and participants could modify the conventional relationship between the two indices.
For investors and market participants, such discrepancies warrant caution. While the VIX’s primary function is to gauge market sentiment, its current disconnection from the SPX may signal underlying market pressures or potential forthcoming volatility. Traders might view this as a cue to hedge their positions or brace for possible market fluctuations.
The post VIX surges while SPX remains steady: What’s behind the anomaly? appeared first on CryptoSlate.