Disclaimer: Information found on CryptoreNews is those of writers quoted. It does not represent the opinions of CryptoreNews on whether to sell, buy or hold any investments. You are advised to conduct your own research before making any investment decisions. Use provided information at your own risk.
CryptoreNews covers fintech, blockchain and Bitcoin bringing you the latest crypto news and analyses on the future of money.
The yields on U.S. Treasury bonds have recently been signaling caution. These yields, which reflect the return on investment for U.S. government bonds, act as an essential gauge of market sentiment and overall economic health.
A key focus in this scenario is the difference between the 10-year Treasury yield and the 3-month Treasury yield. This difference, which illustrates the returns on long-term versus short-term investments, serves as a vital indicator of future economic conditions.
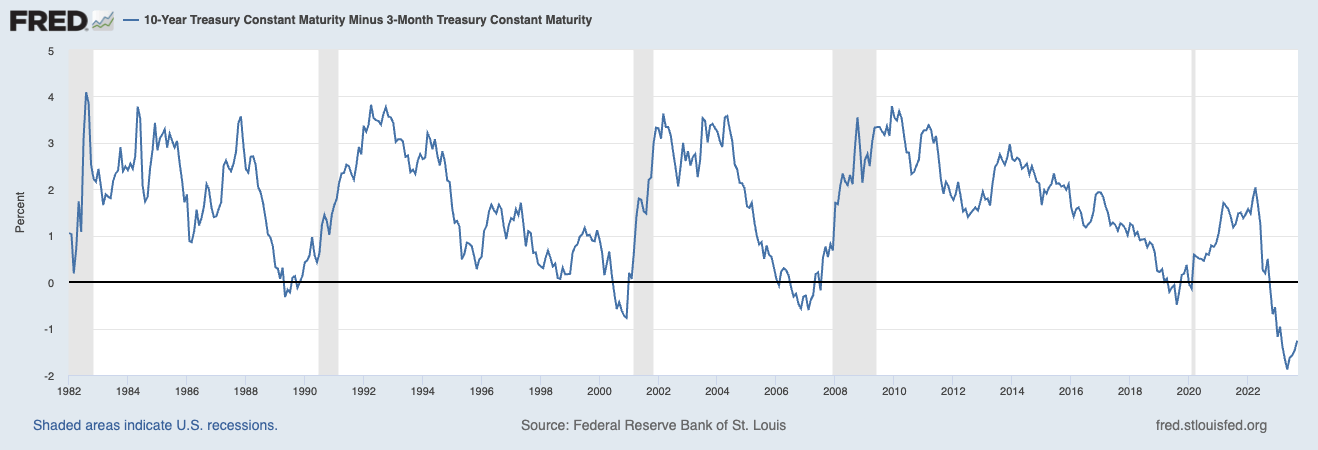 Graph depicting the difference between the U.S. 10-year Treasury yield and the 3-month Treasury yield from 1982 to 2023. Shaded areas denote periods of recession in the U.S. (Source: Federal Reserve)
Historically, the difference between the 10-year and 3-month Treasury yields has proven to be a dependable predictor of economic recessions.
A positive difference generally signifies investor confidence in the long-term economic outlook, whereas a negative difference, known as an “inverted yield curve,” frequently precedes recessions. This inversion indicates that investors have greater confidence in the short-term outlook compared to the long-term, leading them to prefer longer-term securities despite lower yields.
Previous occurrences of this inversion have consistently aligned with economic downturns. This trend was observable prior to the recessions of the early 1980s, the 1990s, the early 2000s dot-com boom, and significantly, the 2007-2008 financial crisis. The predictive capability of this difference, grounded in decades of financial data, highlights its significance in economic forecasting.
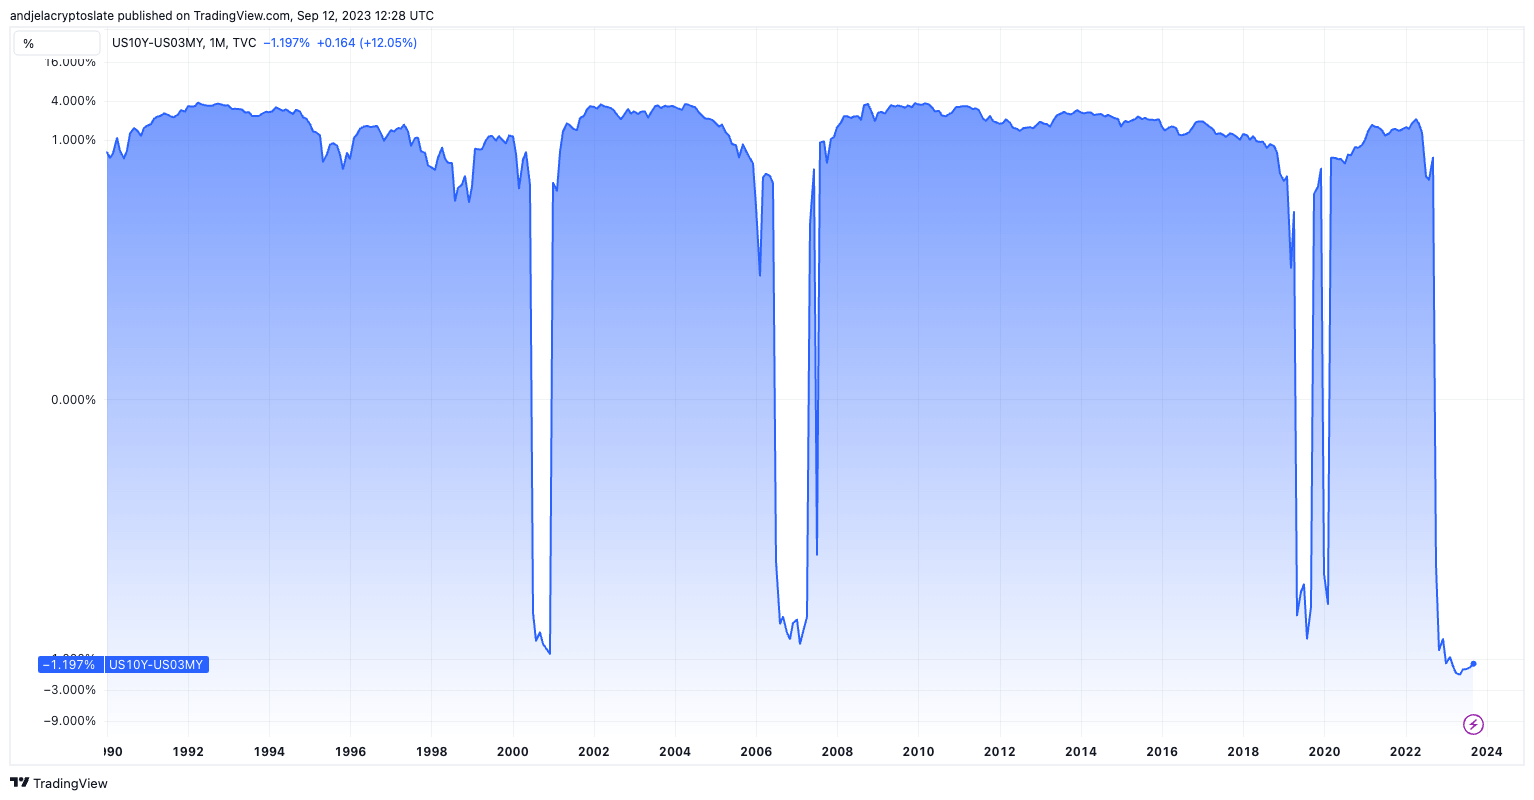 Graph illustrating the difference between the U.S. 10-year Treasury yield and the 3-month Treasury yield from 1990 to 2023 on a logarithmic scale (Source: TradingView)
Related Posts
Beyond its predictive ability, the yield difference has been utilized to estimate the likelihood of upcoming recessions. A 1996 research paper from the Federal Reserve Bank of New York indicates that the difference between the 10-year and 3-month Treasury yields can generate a model-based probability of a recession in the United States within the next 12 months. This model has historically shown a close alignment with actual recessions, providing a quantitative method for assessing economic downturn risks.
By entering the current difference value into the model, analysts can derive a percentage chance of a recession occurring in the subsequent year.
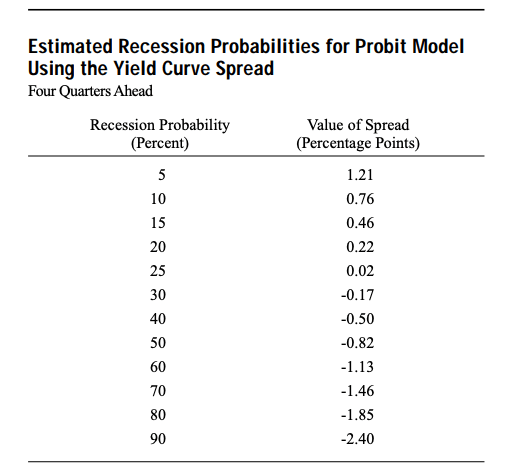 Table displaying the estimated recession probabilities derived from the yield curve difference in 1996 (Source: Federal Reserve Bank of New York)
In October 2022, the difference turned negative, a situation that drew attention in financial circles. By May 2023, this difference fell to a record low of -1.88%. As of September 10, it is recorded at a concerning -1.26%, prompting market analysts and investors to remain vigilant. The Federal Reserve’s recession probability model indicates an increased likelihood of recession, estimated between 60% and 70%.
Graph showing the difference between the U.S. 10-year Treasury yield and the 3-month Treasury yield year-to-date (Source: TradingView)
A notably large negative difference, such as the current one, reflects a lack of confidence in the long-term economic outlook. Investors, apprehensive about future conditions, are gravitating towards longer-term securities, even if it means accepting lower returns. This behavior indicates a collective expectation of economic challenges in the near future.
The post U.S. Treasury yield spread dips to historic lows signaling economic caution appeared first on CryptoSlate.