Disclaimer: Information found on CryptoreNews is those of writers quoted. It does not represent the opinions of CryptoreNews on whether to sell, buy or hold any investments. You are advised to conduct your own research before making any investment decisions. Use provided information at your own risk.
CryptoreNews covers fintech, blockchain and Bitcoin bringing you the latest crypto news and analyses on the future of money.


Traders have treated Bitcoin as a high-beta proxy for the same risk appetite driving Nvidia and the Mag-7, expecting it to move in tandem with equities on positive days.
This equity rally is fueled by earnings revisions, AI revenue growth, and buybacks, which bid up cash-flow assets while bypassing liquidity-driven ones.
A rally attended only by megacaps
| Signal | May 13 read | Why it matters |
|---|---|---|
| New ATH / green | Headline risk-on signal | |
| QQQ | +1.06% | Tech strength |
| Nvidia | +2.84% | AI/chip leadership |
| 7 of 11 down | Weak breadth | |
| NYSE/Nasdaq breadth | Decliners > advancers | Rally not broad |
| Bitcoin | Lost $80k; low near $78,760 | Liquidity assets left behind |
Megacap tech carries EPS beats, AI revenue lines, buyback programs, forward guidance, and margin expansion into every macro headwind, all of which reinforce bids when rates climb.
Bitcoin’s bid mechanism relies on liquidity alone. When liquidity tightens and the equity rally concentrates in cash-generating megacaps, Bitcoin absorbs the downside. Meanwhile, the earnings upside flows exclusively to cash-generating megacaps.
April’s PPI report compounded the problem, as producer prices rose 1.4% month over month and 6% year over year, marking the largest 12-month gain since December 2022. Energy led the rise, with gasoline prices up 15.6% on the month.
That print pushed Fed hike expectations sharply higher, with traders assigning a 34.3% chance of a rate increase by December, up from roughly 15% a week earlier.
Treasury yields and the dollar both climbed on the release. For a non-yielding asset with no earnings offset, that combination functions as a direct tax on valuation.
Correlation without upside beta
K33 found that BTC’s 30-day correlation with the Nasdaq remained above 0.7, confirming that Bitcoin still trades within the equity macro cycle.
Nasdaq futures gained 27% between March 30 and May 8, the strongest 30-day move in 16 years. Yet K33 identified a pattern where, when the Nasdaq rises more than 10% over 30 trading days, BTC’s upside beta often fades.
Bitcoin’s upside beta activates through broad liquidity expansion. This rally concentrated gains in AI-linked earnings while BTC’s spot conditions deteriorated.
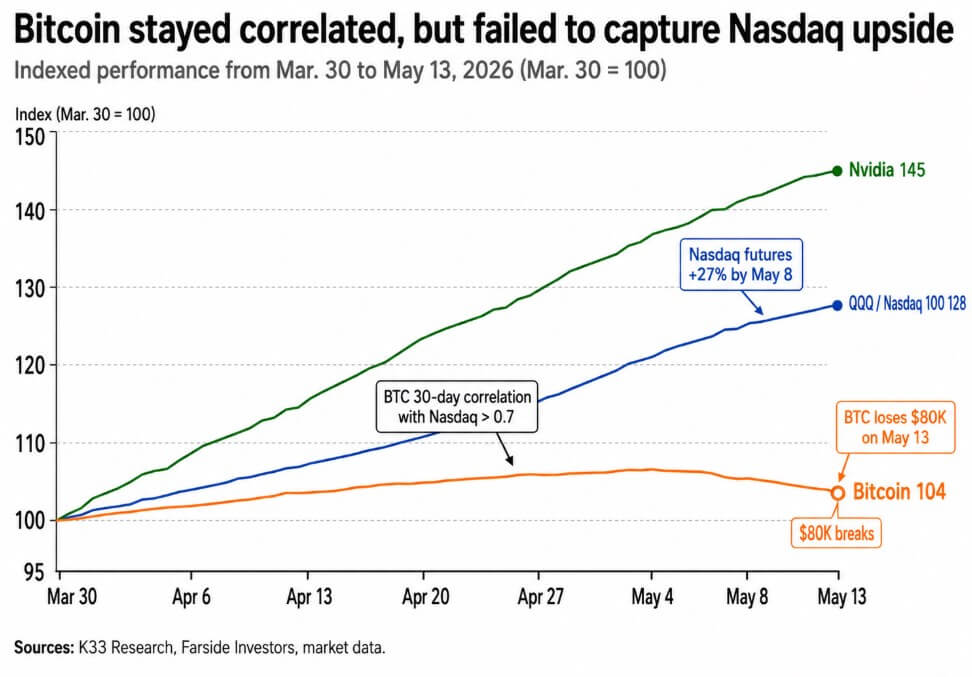
From March 30 to May 13, Nvidia gained 45% and QQQ rose 28%, while Bitcoin added 4% before losing its $80,000 support.
Per Farside Investors data, spot Bitcoin ETFs drew $629.8 million on May 1, $532.3 million on May 4, and $467.3 million on May 5. Then the flows reversed to outflows of $268.5 million on May 7, $145.7 million on May 8, and $233.2 million on May 12.
BTC perpetual funding rates ran negative for 74 consecutive days leading into this week. Average daily BTC spot volume sat around $2.7 billion, and BTC closed below its 200-day moving average on every approach.
A market with negative funding, thin spot volume, and a 200-day moving average overhead requires a broad liquidity catalyst to break higher.
The Fed’s balance sheet stood at approximately $6.71 trillion in total assets as of May 6, with reserve balances at over $3 trillion and the Treasury General Account (TGA) at $878 billion.
The TGA absorbs reserves from the banking system, draining liquidity from risk assets as it increases. The Treasury Borrowing Advisory Committee projected that the TGA would finish the third and fourth quarters of FY2026 at $900 billion and $950 billion, respectively.
The same committee noted that oil prices were up nearly 80% since the start of 2026, a supply-side inflation driver that keeps the Fed’s hands tied regardless of equity performance.
Bitcoin’s valuation lives in the window between Fed liquidity and real rates. Megacap tech bridges that disconnect with AI earnings durability, capital return programs, and revenue visibility.
Consequences of the split
If the inflation shock fades, the probability of a Fed hike recedes, and the dollar softens.
In that environment, ETF inflows that had briefly reversed could resume at scale, short covering could compress the funding rate from negative to neutral, and the $80,000-$85,000 range could become a floor rather than a ceiling.
Citi’s bullish BTC scenario targets $165,000 on a 12-month horizon, contingent on easing liquidity, sustained ETF demand, and crypto-specific legislative progress.
The high-beta trade works again in that scenario, driven by liquidity relief and ETF demand rather than index-level price action.
| Scenario | Macro trigger | BTC trigger | Likely BTC implication |
|---|---|---|---|
| Bull case | Inflation shock fades; Fed hike odds recede; dollar softens | ETF inflows resume; funding moves toward neutral; BTC reclaims $80k–$85k | $80k–$85k becomes support; Citi bull case points to $165k over 12 months |
| Base case | Inflation stays sticky but does not worsen | Mixed ETF flows; BTC chops around $80k | Range-bound market; BTC lags megacap tech |
| Bear case | PPI feeds into CPI/PCE; hike odds move toward 50% | ETF outflows persist; BTC fails to reclaim $80k | Test of $74k–$68k zone |
| Adverse macro | Liquidity tightens further; oil shock persists | Deleveraging and stop-losses accelerate | Citi adverse scenario points to $58k |
If April’s PPI feeds into May CPI and June PCE readings without relief, and the probability of a hike rises toward 50%, the picture for Bitcoin deteriorates regardless of what megacap tech does.
Three consecutive days of ETF outflows through May 12 show institutional holders already reducing exposure at this level.
A failure to reclaim $80,000 within the next few days opens a test of the $74,000-$68,000 zone, where derivative liquidations and retail stop-losses are concentrated.
Citi’s adverse macro scenario places Bitcoin at $58,000. In that path, megacap tech stays bid on AI earnings durability while Bitcoin absorbs the macro downside alone.
