Disclaimer: Information found on CryptoreNews is those of writers quoted. It does not represent the opinions of CryptoreNews on whether to sell, buy or hold any investments. You are advised to conduct your own research before making any investment decisions. Use provided information at your own risk.
CryptoreNews covers fintech, blockchain and Bitcoin bringing you the latest crypto news and analyses on the future of money.
Grasping regional market data is becoming increasingly vital for analyzing the Bitcoin market. The global character of Bitcoin implies that trading activities in one area can greatly impact price fluctuations worldwide. By examining where this trading activity is most prevalent, we can uncover insights into which regions have the greatest influence on Bitcoin’s price.
Glassnode provides estimates for both the supply and price variations of Bitcoin across three key regions: Asia, the European Union (E.U.), and the United States (U.S.). By correlating the timestamps of all transactions initiated by an address with the working hours of various geographical areas, Glassnode assesses the likelihood of each entity’s location. This methodology ensures that regional data is as precise as possible, considering Bitcoin’s decentralized nature.
Analysis by CryptoSlate revealed that the most notable price movements are not originating from the U.S. Instead, the regional month-over-month price changes indicate that Asia is at the forefront. On Oct. 2, the 30-day price change for Bitcoin in Asia showed a significant increase of $1,214. In comparison, the U.S. and E.U. recorded more modest month-over-month price changes of $103 and $431, respectively.
Importantly, the U.S. saw a decline in the final week of September, with its largest drop being -$987 on Sep. 29. This indicates that while traders in Asia are accumulating Bitcoin, their counterparts in the U.S. and E.U. are adopting a more cautious approach, with the U.S. even exhibiting signs of distribution.
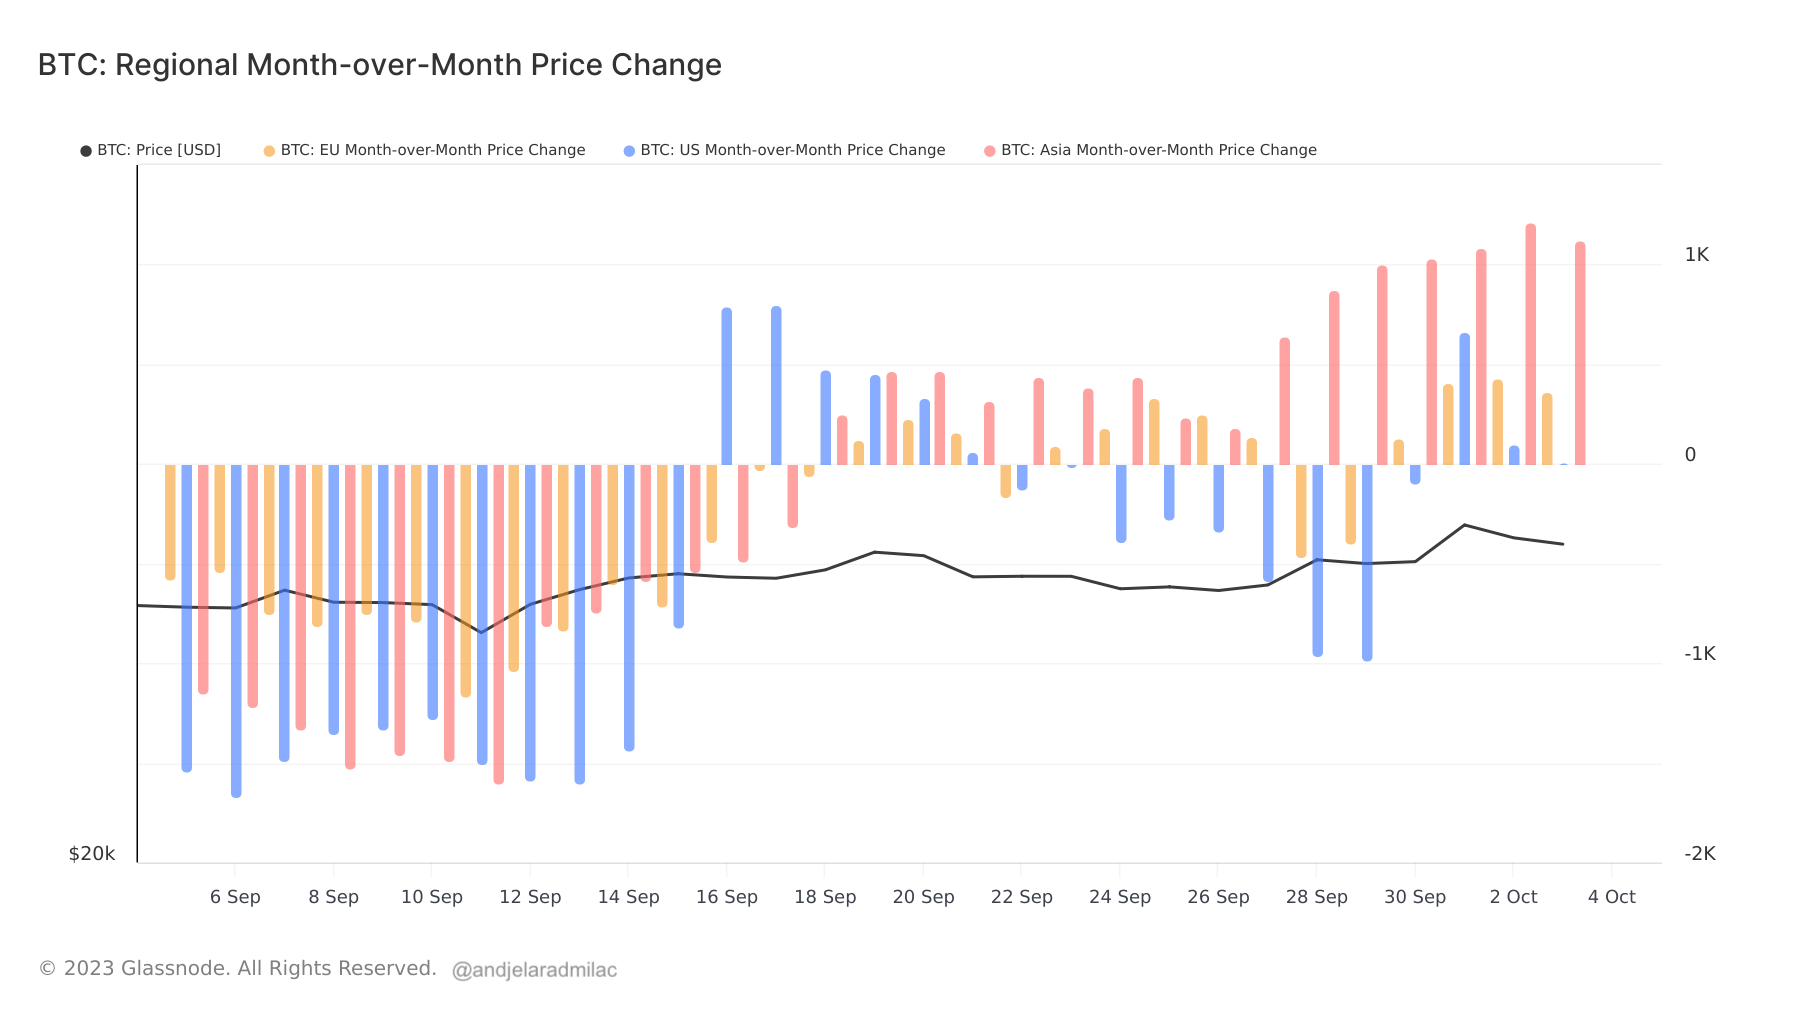 Graph illustrating the regional month-over-month price change in the U.S. (blue), E.U. (yellow), and Asia (red) from Sep. 5 to Oct. 4, 2023 (Source: Glassnode)
The regional year-over-year supply change provides additional insights. On Oct. 3, the Bitcoin supply in Asia rose by 3.23% YoY. The E.U. also noted a slight increase, with a 0.24% rise. Conversely, the U.S. supply experienced a decline of 3.48% YoY.
Related Posts
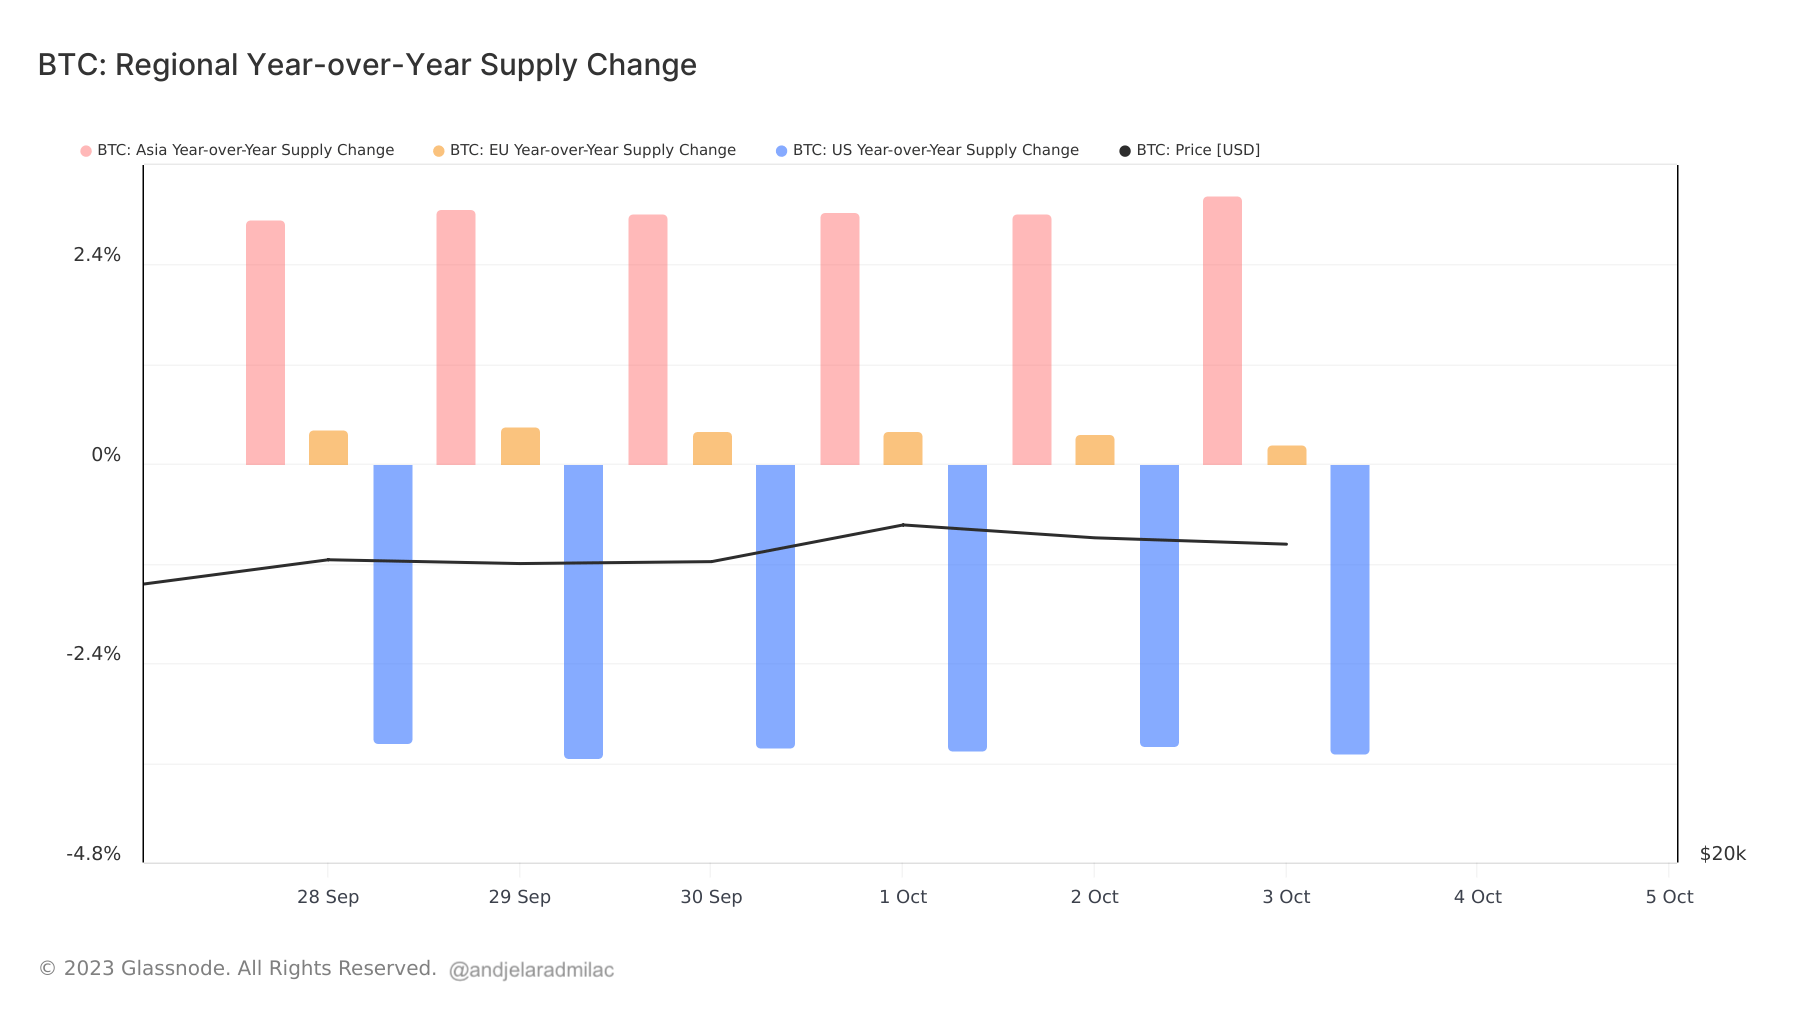 Graph depicting the regional year-over-year supply change in the U.S. (blue), E.U. (yellow), and Asia (red) from Sep. 28 to Oct. 4, 2023 (Source: Glassnode)
This decrease is part of a larger trend that commenced in 2022, with the U.S. Bitcoin supply undergoing a gradual deflation. Since Aug. 2022, the U.S. supply has consistently demonstrated negative YoY growth. Notably, after years of decline, the E.U. supply began to rise in Nov. 2022. In contrast, the Asian supply has been increasing alongside the reduction in the U.S. supply, indicating a nearly perfect inverse relationship.
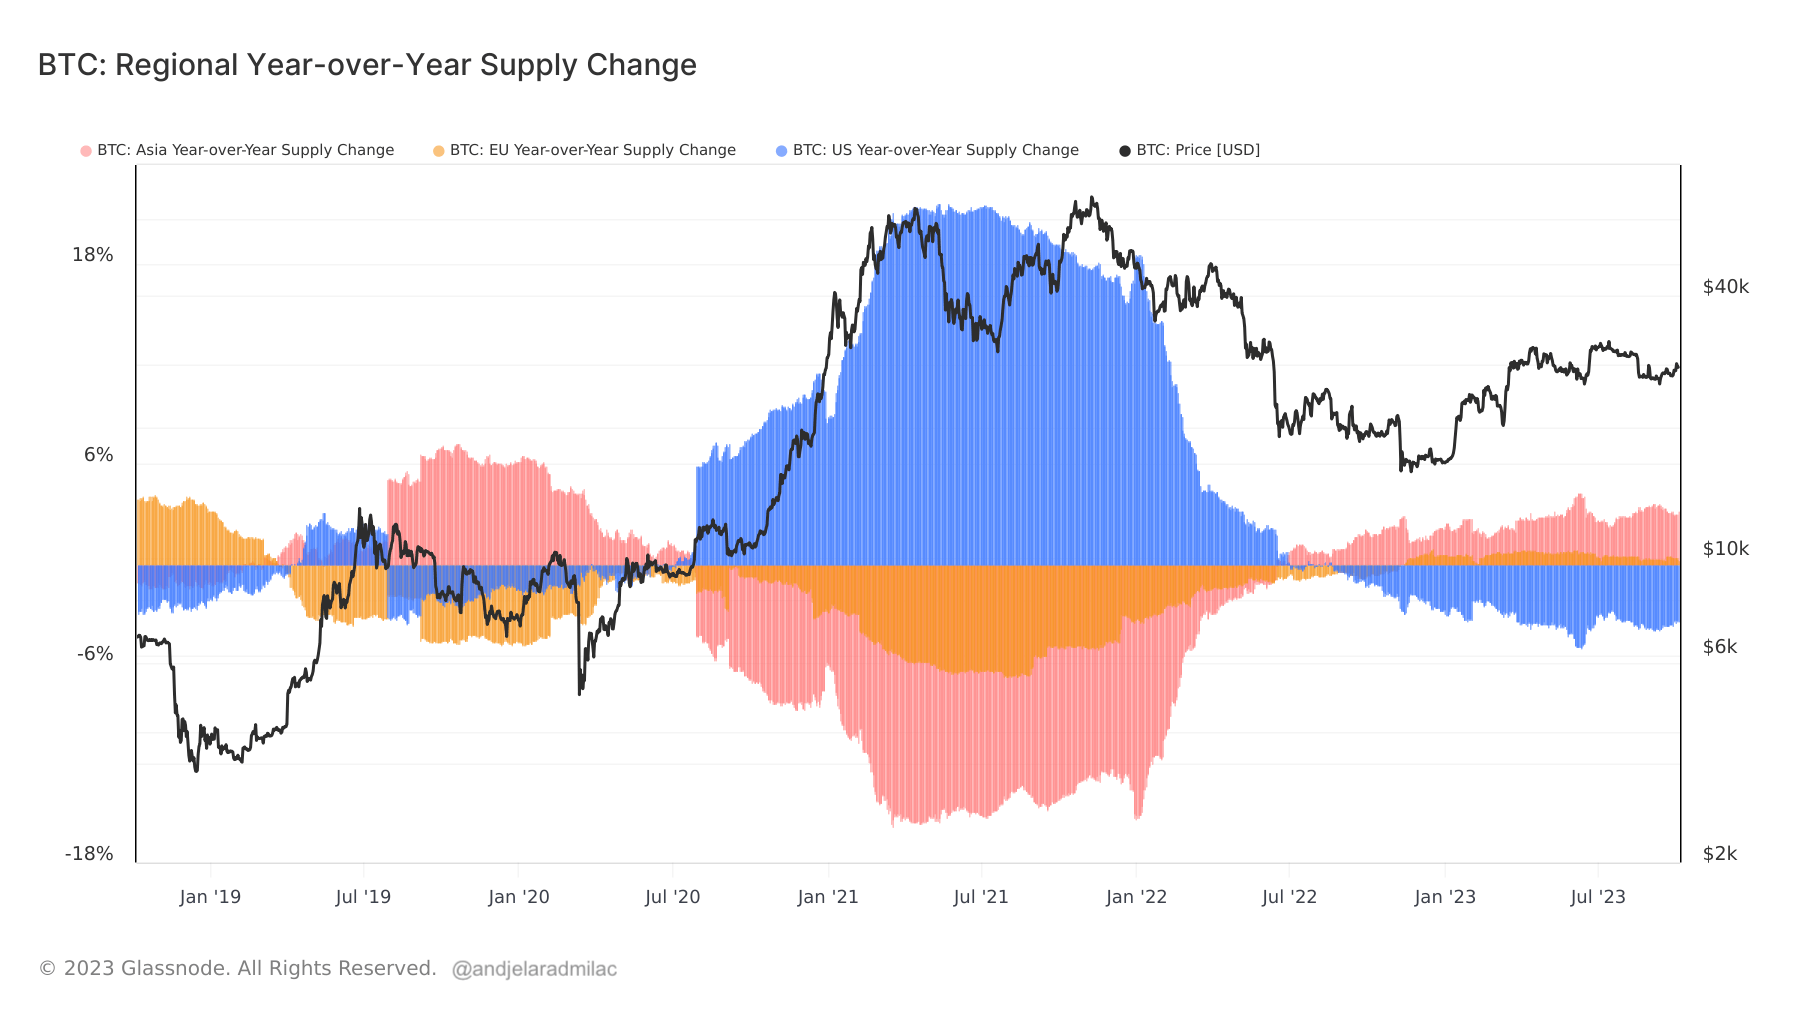 Graph showing the regional year-over-year supply change in the U.S. (blue), E.U. (yellow), and Asia (red) from October 2018 to October 2023 (Source: Glassnode)
The data implies that while traders in Asia are optimistic about Bitcoin, the markets in the U.S. and E.U. are more reserved. The increase in supply in Asia reflects a growing confidence in the cryptocurrency, while the decline in the U.S. indicates a more cautious approach. The E.U.’s slight increase may suggest a sense of cautious optimism.
Regional data offers important insights into the global Bitcoin market. Current trends indicate a shift in market dynamics, with Asia emerging as a significant player in Bitcoin trading.
The post Bitcoin’s regional dynamics: Asia bullish, U.S. and E.U. in distribution mode appeared first on CryptoSlate.