Disclaimer: Information found on CryptoreNews is those of writers quoted. It does not represent the opinions of CryptoreNews on whether to sell, buy or hold any investments. You are advised to conduct your own research before making any investment decisions. Use provided information at your own risk.
CryptoreNews covers fintech, blockchain and Bitcoin bringing you the latest crypto news and analyses on the future of money.
DeFi adoption differs among blockchains, while Bitcoin’s price influences transaction speed.
In the midst of the 2023 bear market, it is essential to consider the transformative events that have influenced this sector.
The ‘DeFi Summer’ of 2020 marked a pivotal moment in the blockchain landscape, as noted by CryptoSlate. This period witnessed the introduction of numerous DeFi initiatives, heralding the beginning of a new financial era. The advancements in DeFi during this time not only created significant ripples; they initiated a fundamental shift, establishing DeFi as a daring pioneer of this extraordinary movement.
Although the concept has existed since 2015 with projects like MakerDAO, DeFi saw an extraordinary rise during the 2021 bull market, reshaping conventional finance and asserting itself as a key player in the industry. However, currently, with token values plummeting by as much as 90% as we traverse the challenging landscape of the ongoing bear market, we examine the pace of DeFi adoption and the influence of market cycles on this adoption.
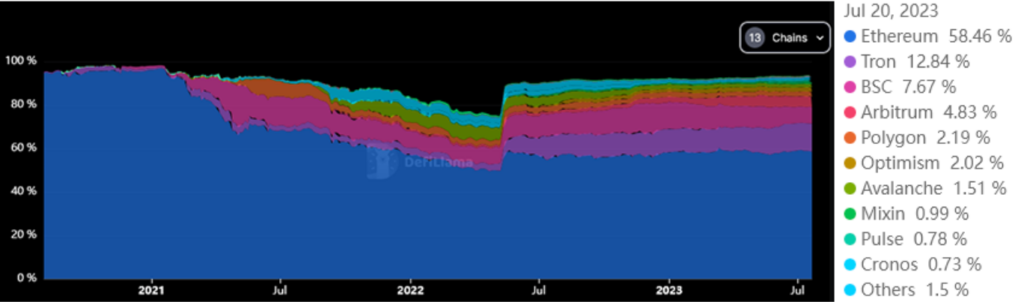
DeFi TVL analysis by chain since 2017
In this context, our analysis centers on data gathered from 2018 to 2023, focusing on adoption across various chains including Ethereum, Tron, BNB Chain (BSC), Arbitrum, Polygon, Optimism, Avalanche, Mixin, Pulse, Cronos, Solana, Cardano, and Osmosis.
 Source: DefiLlama
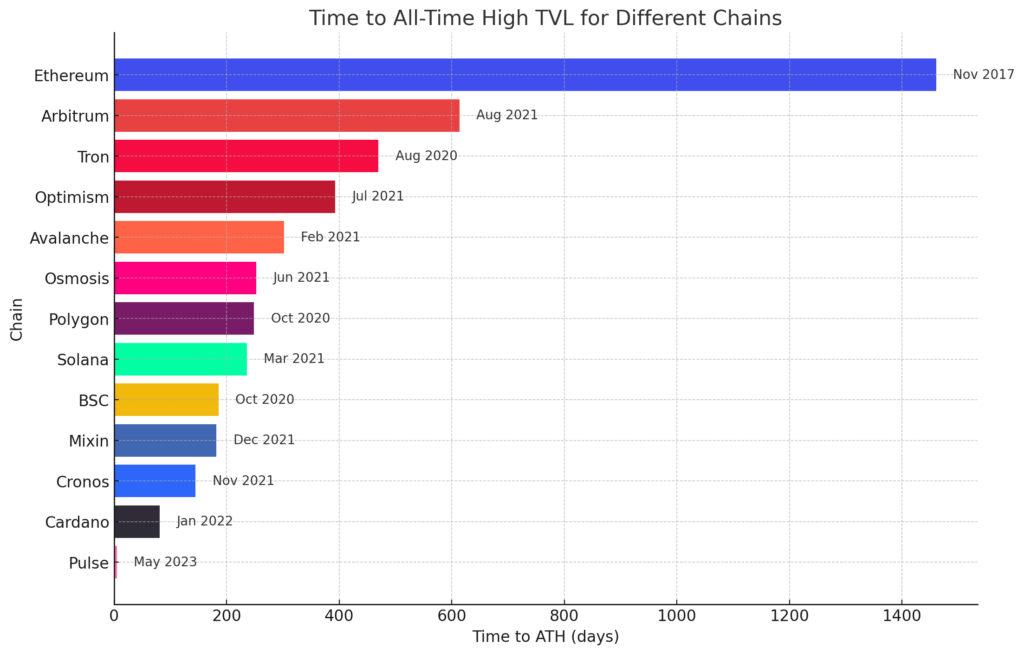
The table below illustrates the chains examined, the date each chain achieved its all-time high for TVL (as recorded by DefiLlama), the duration it took to reach this all-time high since launch (velocity), its all-time high (ATH), and the current TVL.
| Chain | Activity start* | ATH Date | ATH TVL | Velocity | Current TVL |
|---|---|---|---|---|---|
| Ethereum | November 2017** | November 2021 | $108.92B | 1280 days | $25.73B |
| Tron | August 2020 | November 2021 | $6.74B | 470 days | $5.69B |
| BSC | October 2020 | May 2021 | $21.94B | 186 days | $3.36B |
| Arbitrum | August 2021 | May 2023 | $2.53B | 614 days | $2.12B |
| Polygon | October 2020 | June 2021 | $9.89B | 249 days | $0.97B |
| Optimism | July 2021 | August 2022 | $1.15B | 393 days | $0.92B |
| Avalanche | February 2021 | December 2021 | $11.41B | 302 days | $0.66B |
| Mixin | December 2021 | June 2022 | $0.59B | 182 days | $0.44B |
| Pulse | May 2023 | May 2023 | $0.49B | 5 days | $0.34B |
| Cronos | November 2021 | April 2022 | $3.22B | 145 days | $0.32B |
| Solana | March 2021 | November 2021 | $10.03B | 236 days | $0.31B |
| Cardano | January 2022 | March 2022 | $0.33B | 81 days | $0.18B |
| Osmosis | June 2021 | March 2022 | $1.83B | 253 days | $0.13B |
The chart below illustrates the speed at which each chain achieved its all-time high in TVL. Ethereum, as a DeFi pioneer, has technically had DeFi activity since 2017, making it notable for its slower adoption, as its all-time high was not reached until November 2021.
Notably, November 2021 aligns with Bitcoin’s all-time high and likely influenced DeFi on Tron and Solana, which also experienced peaks during this period.
 Source Data: DefiLlama**
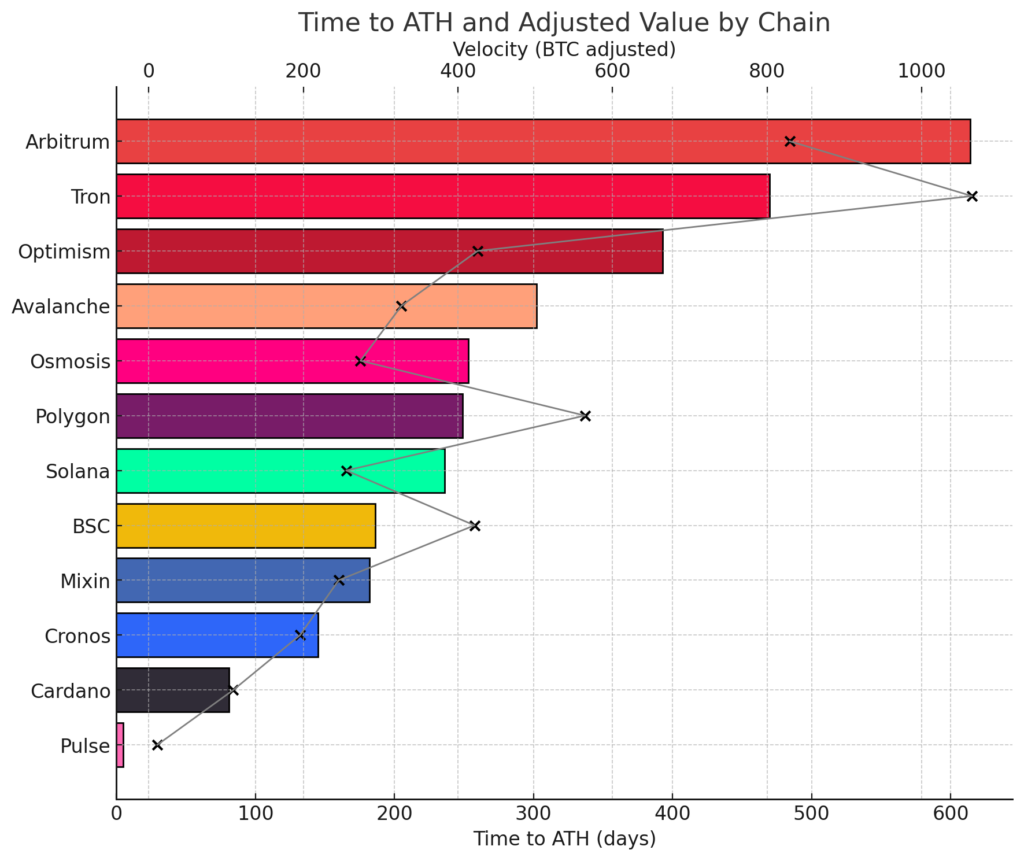
Bitcoin adjusted velocity
As Bitcoin is regarded as an indicator of the overall health of the cryptocurrency market, the pace of DeFi adoption was adjusted according to Bitcoin’s price at the time of each chain’s DeFi launch.
CryptoSlate compared Bitcoin’s price with the all-time high data to establish a Bitcoin-adjusted velocity (BaV) for each chain.
Related Posts
The grey line and plot points in the chart below represent the BaV for each chain. The chart indicates that the DeFi ecosystems of Tron, Polygon, and BSC benefited from Bitcoin’s price and the accompanying bullish market sentiment.
 Source Data: DefiLlama***/ Yahoo Finance
Analysis of chain velocity
Ethereum was excluded from the above chart for clarity, as it recorded an exceptionally high velocity score of 7,936, compared to Tron at 1,065 and Arbitrum at 829.
Considering the bear market, Pulse’s velocity decreased, resulting in a score of just 10.98, having reached its ATH in only 5 days. The next lowest was Cardano at 109, approximately ten times higher.
Utilizing the BaV metric, it appears that the top-performing chains were Pulse, Cardano, Cronos, Solana, and Osmosis, while Ethereum, Tron, and Arbitrum exhibited the slowest velocities.
Tron is among the chains currently nearest to its ATH, showing strong performance in 2023. If it surpasses its ATH of $6.47 billion from its current level of $5.6 billion, it may exceed Ethereum in both BaV and standard velocity metrics.
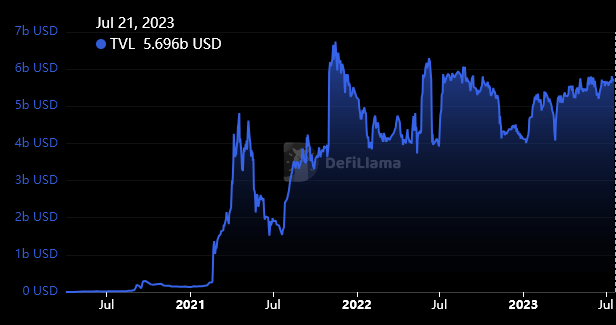 Source: DefiLlama
The varied paths of DeFi adoption across different blockchain networks highlight the significance of timing, market conditions, and the advantages of being an early entrant in the field. Nonetheless, as demonstrated by the impressive case of Pulse, even newcomers can experience rapid growth when the right conditions align.
Understanding the data
The rate at which a chain reaches its all-time high in TVL is a multifaceted metric. Some may contend that a rapid ascent often leads to a swift decline, which is indeed true for certain chains.
However, the core factors under examination here relate to momentum and adoption. Furthermore, all the projects listed have recorded at least $330 million locked, with the majority exceeding $1 billion. These are not low market cap projects with minimal liquidity.
The projects discussed in this article are essential for understanding the strengths and weaknesses of the historical DeFi onboarding process. On average, it took approximately 338 days for a chain to reach its ATH, indicating that, excluding outliers, most chains require nearly a year to peak in DeFi activity.
* Launch date refers to the date of the first data tracked by DefiLama for each chain**
** Using MakerDAO’s DAI launch as the date for the Ethereum DeFi launch and data according to CoinmarketCap’s historical data.
*** Additional data included due to DefiLlama 2020 cut-off date.
The post DeFi adoption varies across chains, BTC price affects velocity appeared first on CryptoSlate.