Disclaimer: Information found on CryptoreNews is those of writers quoted. It does not represent the opinions of CryptoreNews on whether to sell, buy or hold any investments. You are advised to conduct your own research before making any investment decisions. Use provided information at your own risk.
CryptoreNews covers fintech, blockchain and Bitcoin bringing you the latest crypto news and analyses on the future of money.


Spent Lifespan Relative Value (SLRV) provides insight into the age of coins transacted on the Bitcoin network. It helps distinguish between the behaviors of long-term holders and short-term speculators, serving as a gauge for market sentiment.
SLRV ribbons visually represent the SLRV ratio across various time frames, primarily the 30-day moving average (30DMA) and the 150-day moving average (150DMA). Their significance lies in their ability to offer a clear view of market trends.
The 30DMA, reflecting a shorter time frame, captures recent trader behavior, typically associated with short-term holders or speculators who react to immediate market changes. Conversely, the 150DMA, with its longer duration, reflects the actions of long-term holders who base decisions on extended market trends and are less swayed by short-term fluctuations.
When the 30DMA sits above the 150DMA, it indicates bullish sentiment, suggesting that long-term holders are not selling their coins. In contrast, when the 30DMA falls below the 150DMA, it signals a potential bearish shift, as older coins begin to enter the market.
Historical data shows a correlation between peaks in the SLRV 30-day moving average (30DMA) and peaks in Bitcoin’s price. As the SLRV 30DMA rises, a significant portion of long-term holders tends to sell, often marking a price peak. Following this, Bitcoin’s price typically declines when the SLRV 30DMA dips below the SLRV 150DMA. This ribbon inversion acts as a precursor to a potential market downturn.
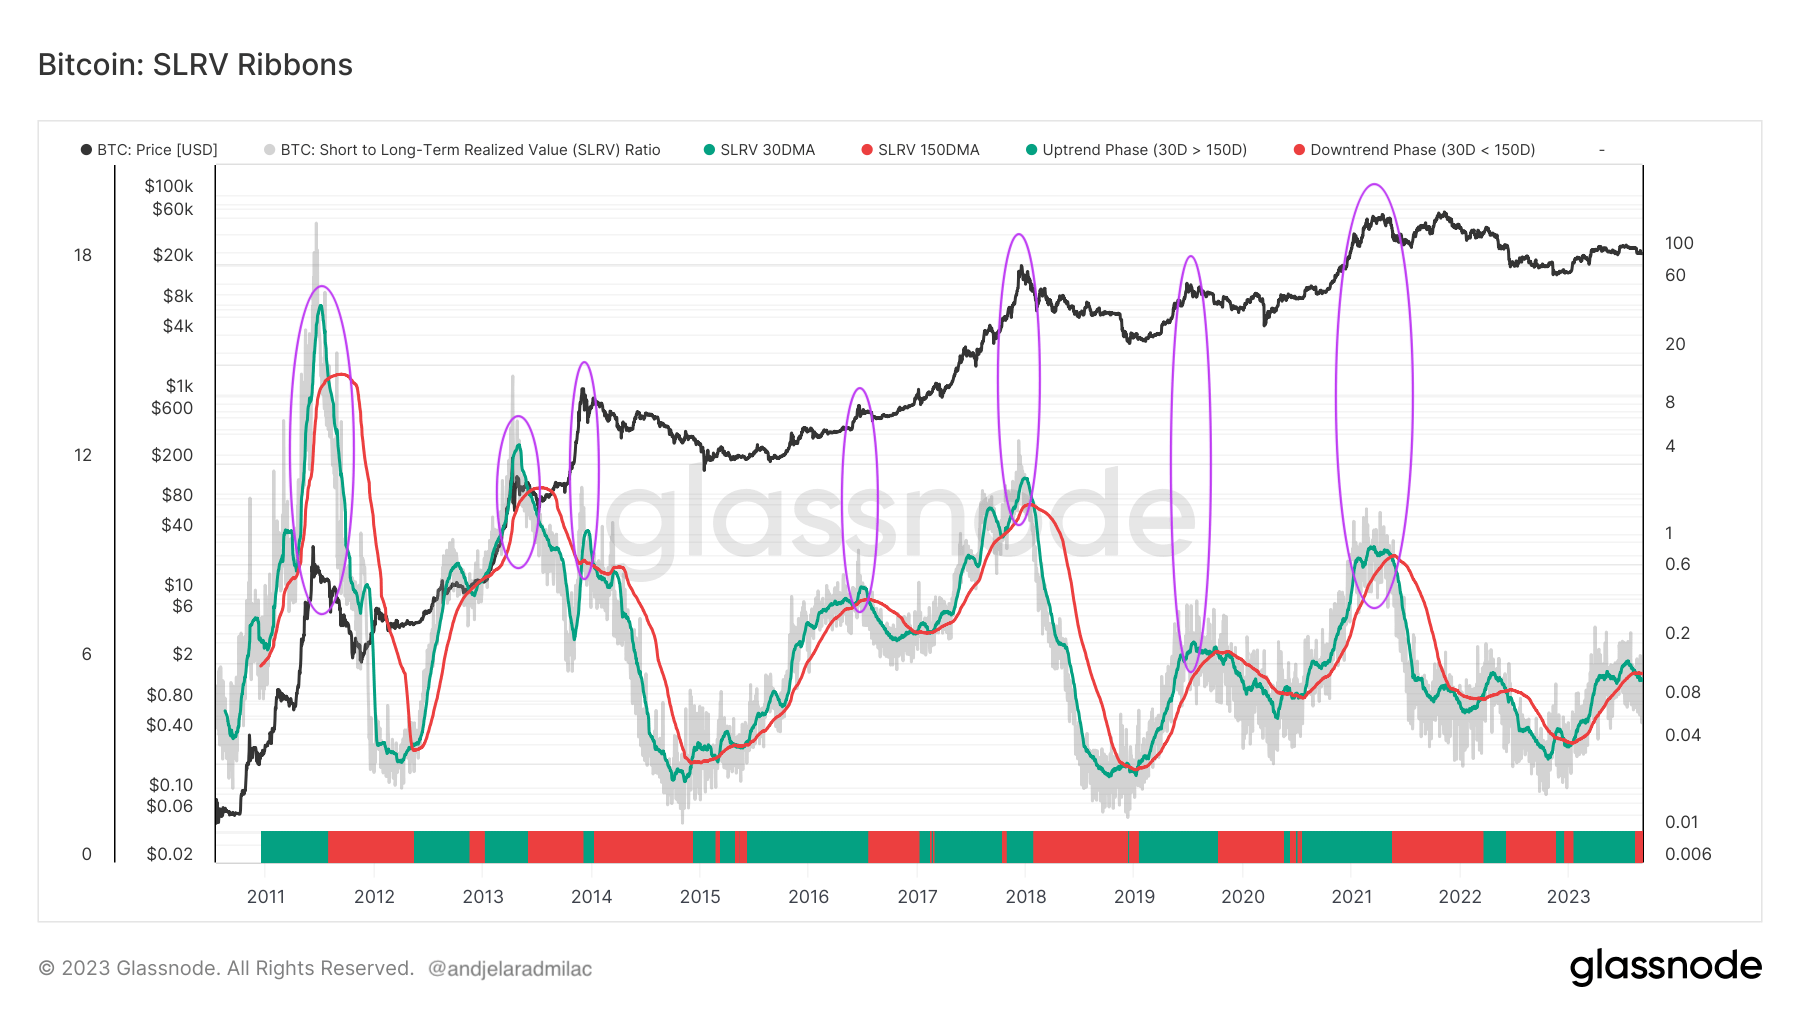
Graph showing the SLRV ribbons from 2010 to 2023 (Source: Glassnode)
Related Posts
The SLRV 30DMA remained dominant over the 150DMA for most of the year.
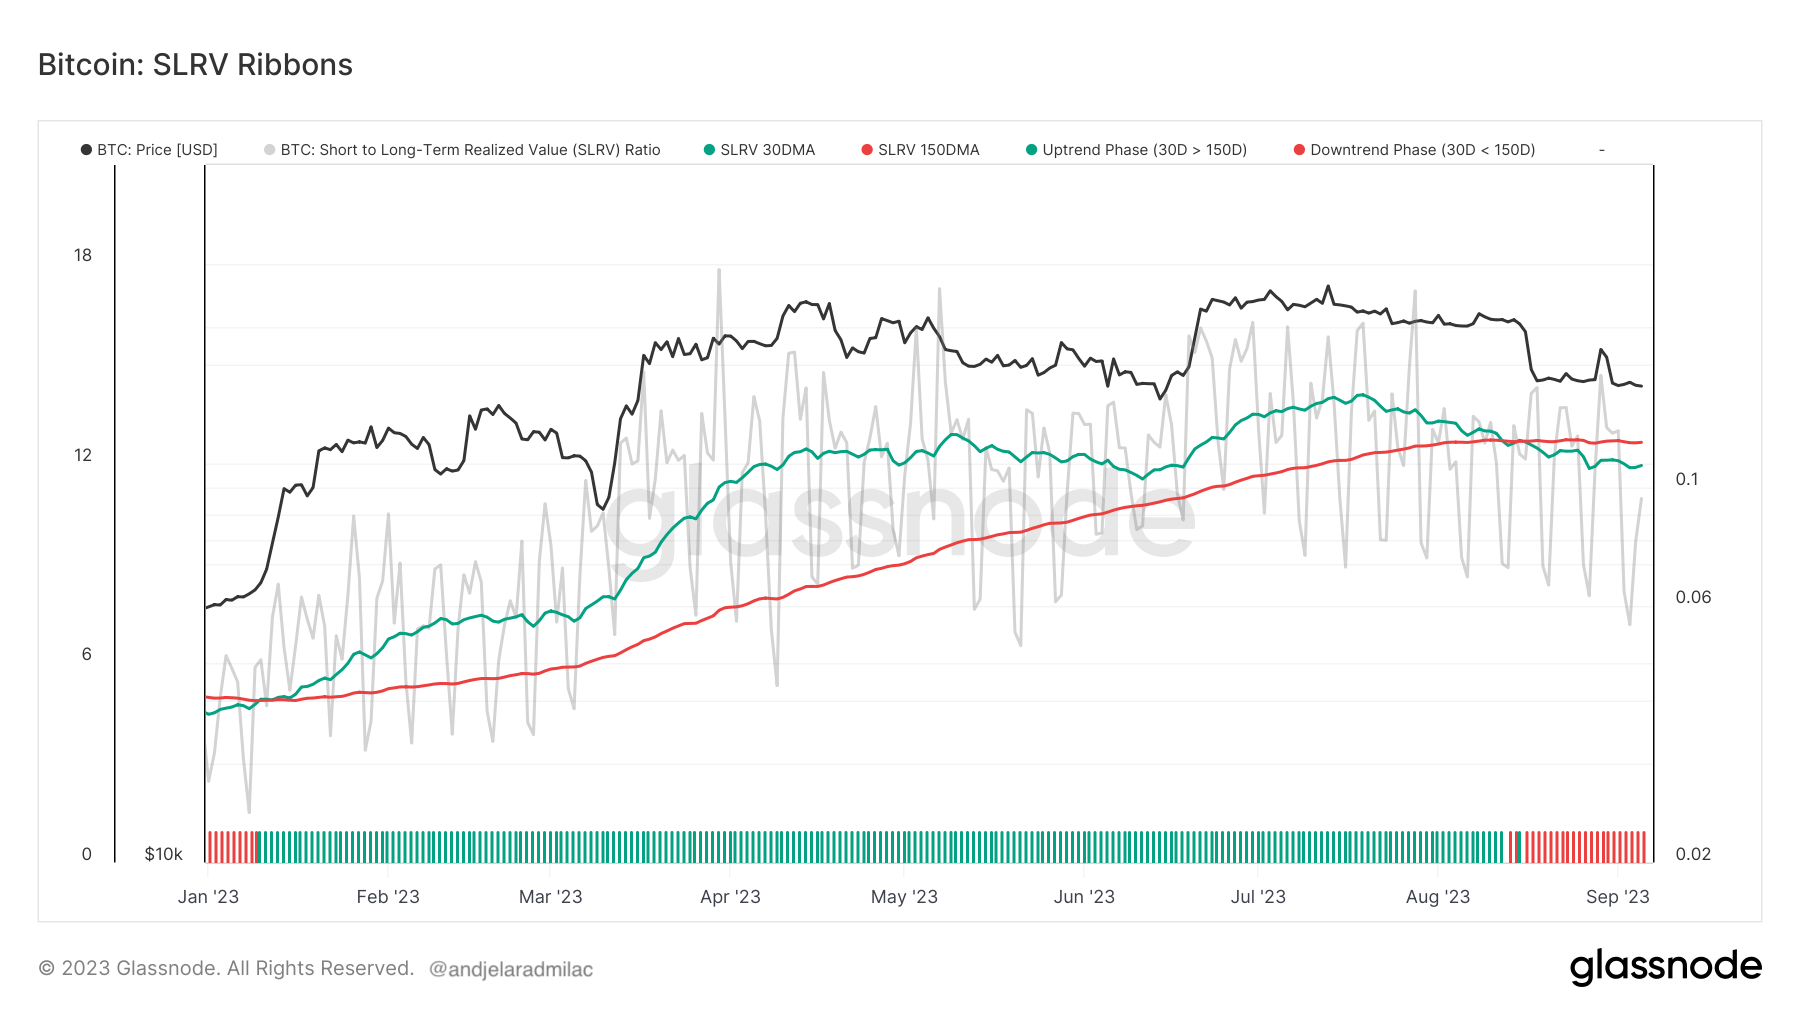
Graph showing the SLRV ribbons YTD (Source: Glassnode)
However, a notable shift occurred on Aug. 13, when the 150DMA briefly moved above the 30DMA. At the time, Bitcoin’s price was oscillating around the $29,200 mark, confined within a tight trading range established in mid-June. By Aug. 15, the SLRV ribbons were fully inverted, with the 30DMA plunging below the 150DMA. This inversion was mirrored in Bitcoin’s price, which dropped from $29,200 to $26,000.
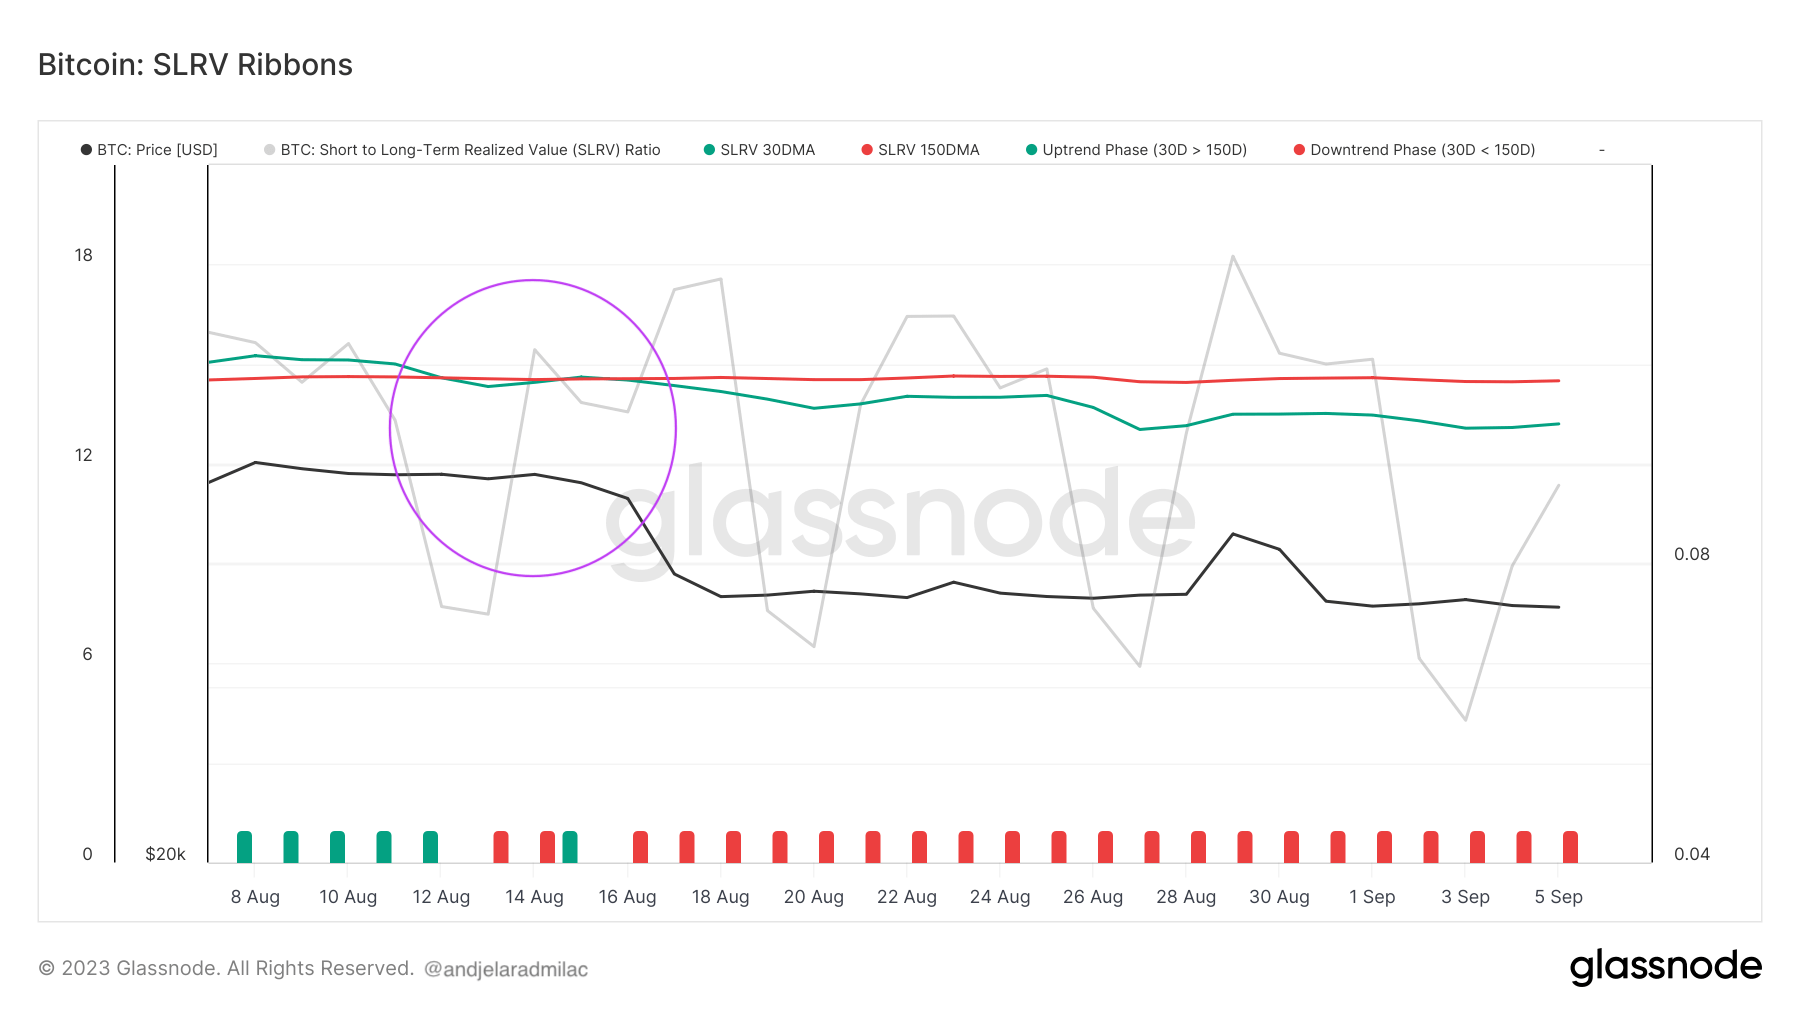
Graph showing the SLRV ribbons from Aug. 6 to Sep. 6, 2023 (Source: Glassnode)
As of Sep. 6, the SLRV ribbons remained inverted, with the downtrend showing no immediate signs of reversal. For market participants, this could signal caution. The inversion of the SLRV ribbons, combined with Bitcoin’s price response, suggests that the market may be entering a phase where long-term holders are considering liquidating their positions. This could exert downward pressure on Bitcoin’s price in the near term.
