Disclaimer: Information found on CryptoreNews is those of writers quoted. It does not represent the opinions of CryptoreNews on whether to sell, buy or hold any investments. You are advised to conduct your own research before making any investment decisions. Use provided information at your own risk.
CryptoreNews covers fintech, blockchain and Bitcoin bringing you the latest crypto news and analyses on the future of money.
Bitcoin’s support structure weakened in the first quarter as previous investors withdrew their backing.
As the first quarter of 2026 concluded, Bitcoin’s lackluster performance appears less like an isolated crypto-specific event and more indicative of a market that has faced increasing macroeconomic and geopolitical challenges over recent months.
When Q1 wrapped up on March 31, Bitcoin was trading around $66,280, reflecting a decline of approximately 24% for the year, while the S&P 500 was also on track for its worst quarterly performance since 2022 as investors retreated from riskier assets.
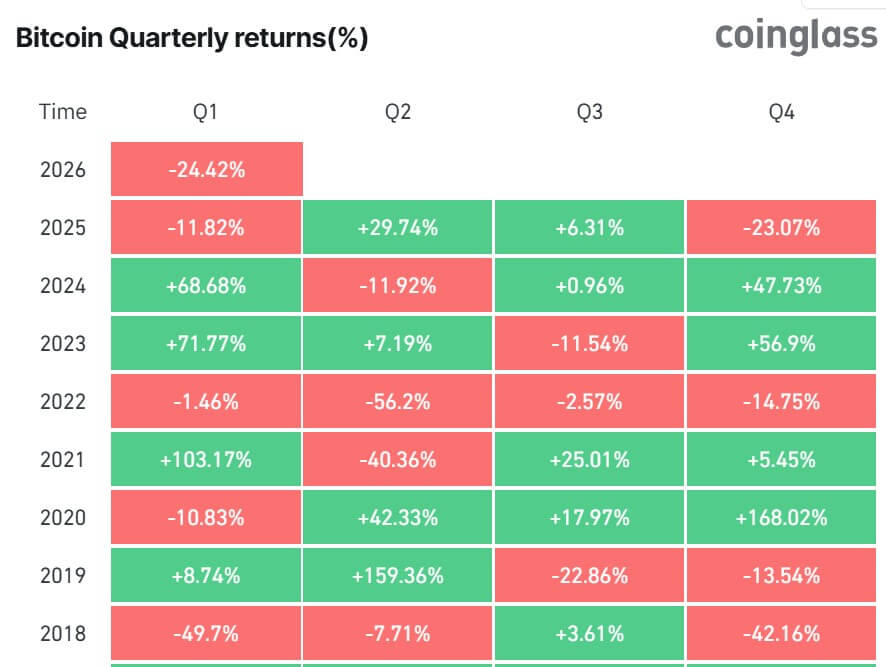 Bitcoin Quarterly Price Performance Since 2018 (Source: CoinGlass)
The quarter commenced with optimism surrounding the potential for the ETF era, corporate treasury investments, and a more favorable US policy environment to bolster the crypto market.
However, it concluded with oil prices exceeding $100, rising yields, and renewed questions about whether Bitcoin functions more as a hedge or a leveraged macro investment.
Throughout the reporting period, BTC‘s downward movement was not attributed to a single factor. Instead, the disappointing price performance stemmed from a combination of war-induced energy shocks, diminishing confidence in Federal Reserve easing, reduced institutional demand, routine miner sales, selective de-risking by long-term holders, and cautious derivatives positioning, all contributing to the quarter’s overall sentiment.
By late March, some of the most intense selling pressure had subsided, yet the market still lacked the widespread, aggressive buying typically seen during a robust recovery.
War, oil, and yields reset the quarter
Macroeconomic pressures influenced Bitcoin throughout the first three months of the year, but a significant shift occurred in February, when military tensions involving the US, Israel, and Iran escalated, prompting investors to reevaluate inflation, interest rates, and risk exposure simultaneously.
The conflict led to a sharp increase in oil prices as investors anticipated potential disruptions across the Middle East, with Brent crude consistently trading above $100 amid warnings that any extended disruption in the Strait of Hormuz could drive prices even higher.
This added to the strain on global markets already grappling with uneven growth and ongoing inflation concerns.
Market analysts observed that the rise in energy prices directly impacted the rates markets, where investors who began the year expecting a more accommodating policy environment were instead faced with the likelihood that higher fuel costs would keep inflation elevated and complicate the Federal Reserve’s future decisions.
Consequently, the 10-year Treasury yield briefly approached 4.50% before easing, reflecting a broader adjustment of rate expectations as markets adapted to a more uncertain monetary landscape.
Simultaneously, equities declined as this repricing spread. According to Reuters, the S&P 500 was projected to drop about 7% for the quarter, marking its weakest quarterly performance in four years.
Bitcoin operated within this same macro environment. On one hand, geopolitical unrest and increasing skepticism toward traditional markets bolstered the argument for alternative stores of value, such as Bitcoin.
Conversely, rising Treasury yields and heightened demand for conventional safe-haven assets drained liquidity from speculative positions, negatively impacting digital assets.
The outcome was a market trapped between approximately $60,000 and $72,000, with neither bulls nor bears able to establish a sustained trend.
The quarter ultimately illustrated how swiftly geopolitical conflicts can alter crypto trading conditions. What began as a year with expectations of looser financial conditions transformed into a period characterized by war risk, energy shocks, and a more intricate rate outlook, leaving Bitcoin and the broader digital asset market navigating a global risk reset.
The ETF and institutional bid have stopped acting like a shock absorber
Institutional demand persisted in the market during the first quarter, but it was insufficient to counteract the overarching macro pressures driving prices downward.
Data from SoSoValue indicated that Bitcoin ETFs experienced $1.8 billion in net outflows during the first two months of the year, followed by approximately $1 billion in inflows in March.
This resulted in the nine products recording net outflows exceeding $800 million for the quarter, signaling that spot flows had weakened and that accumulation was not robust enough to provide consistent support as risk sentiment declined.
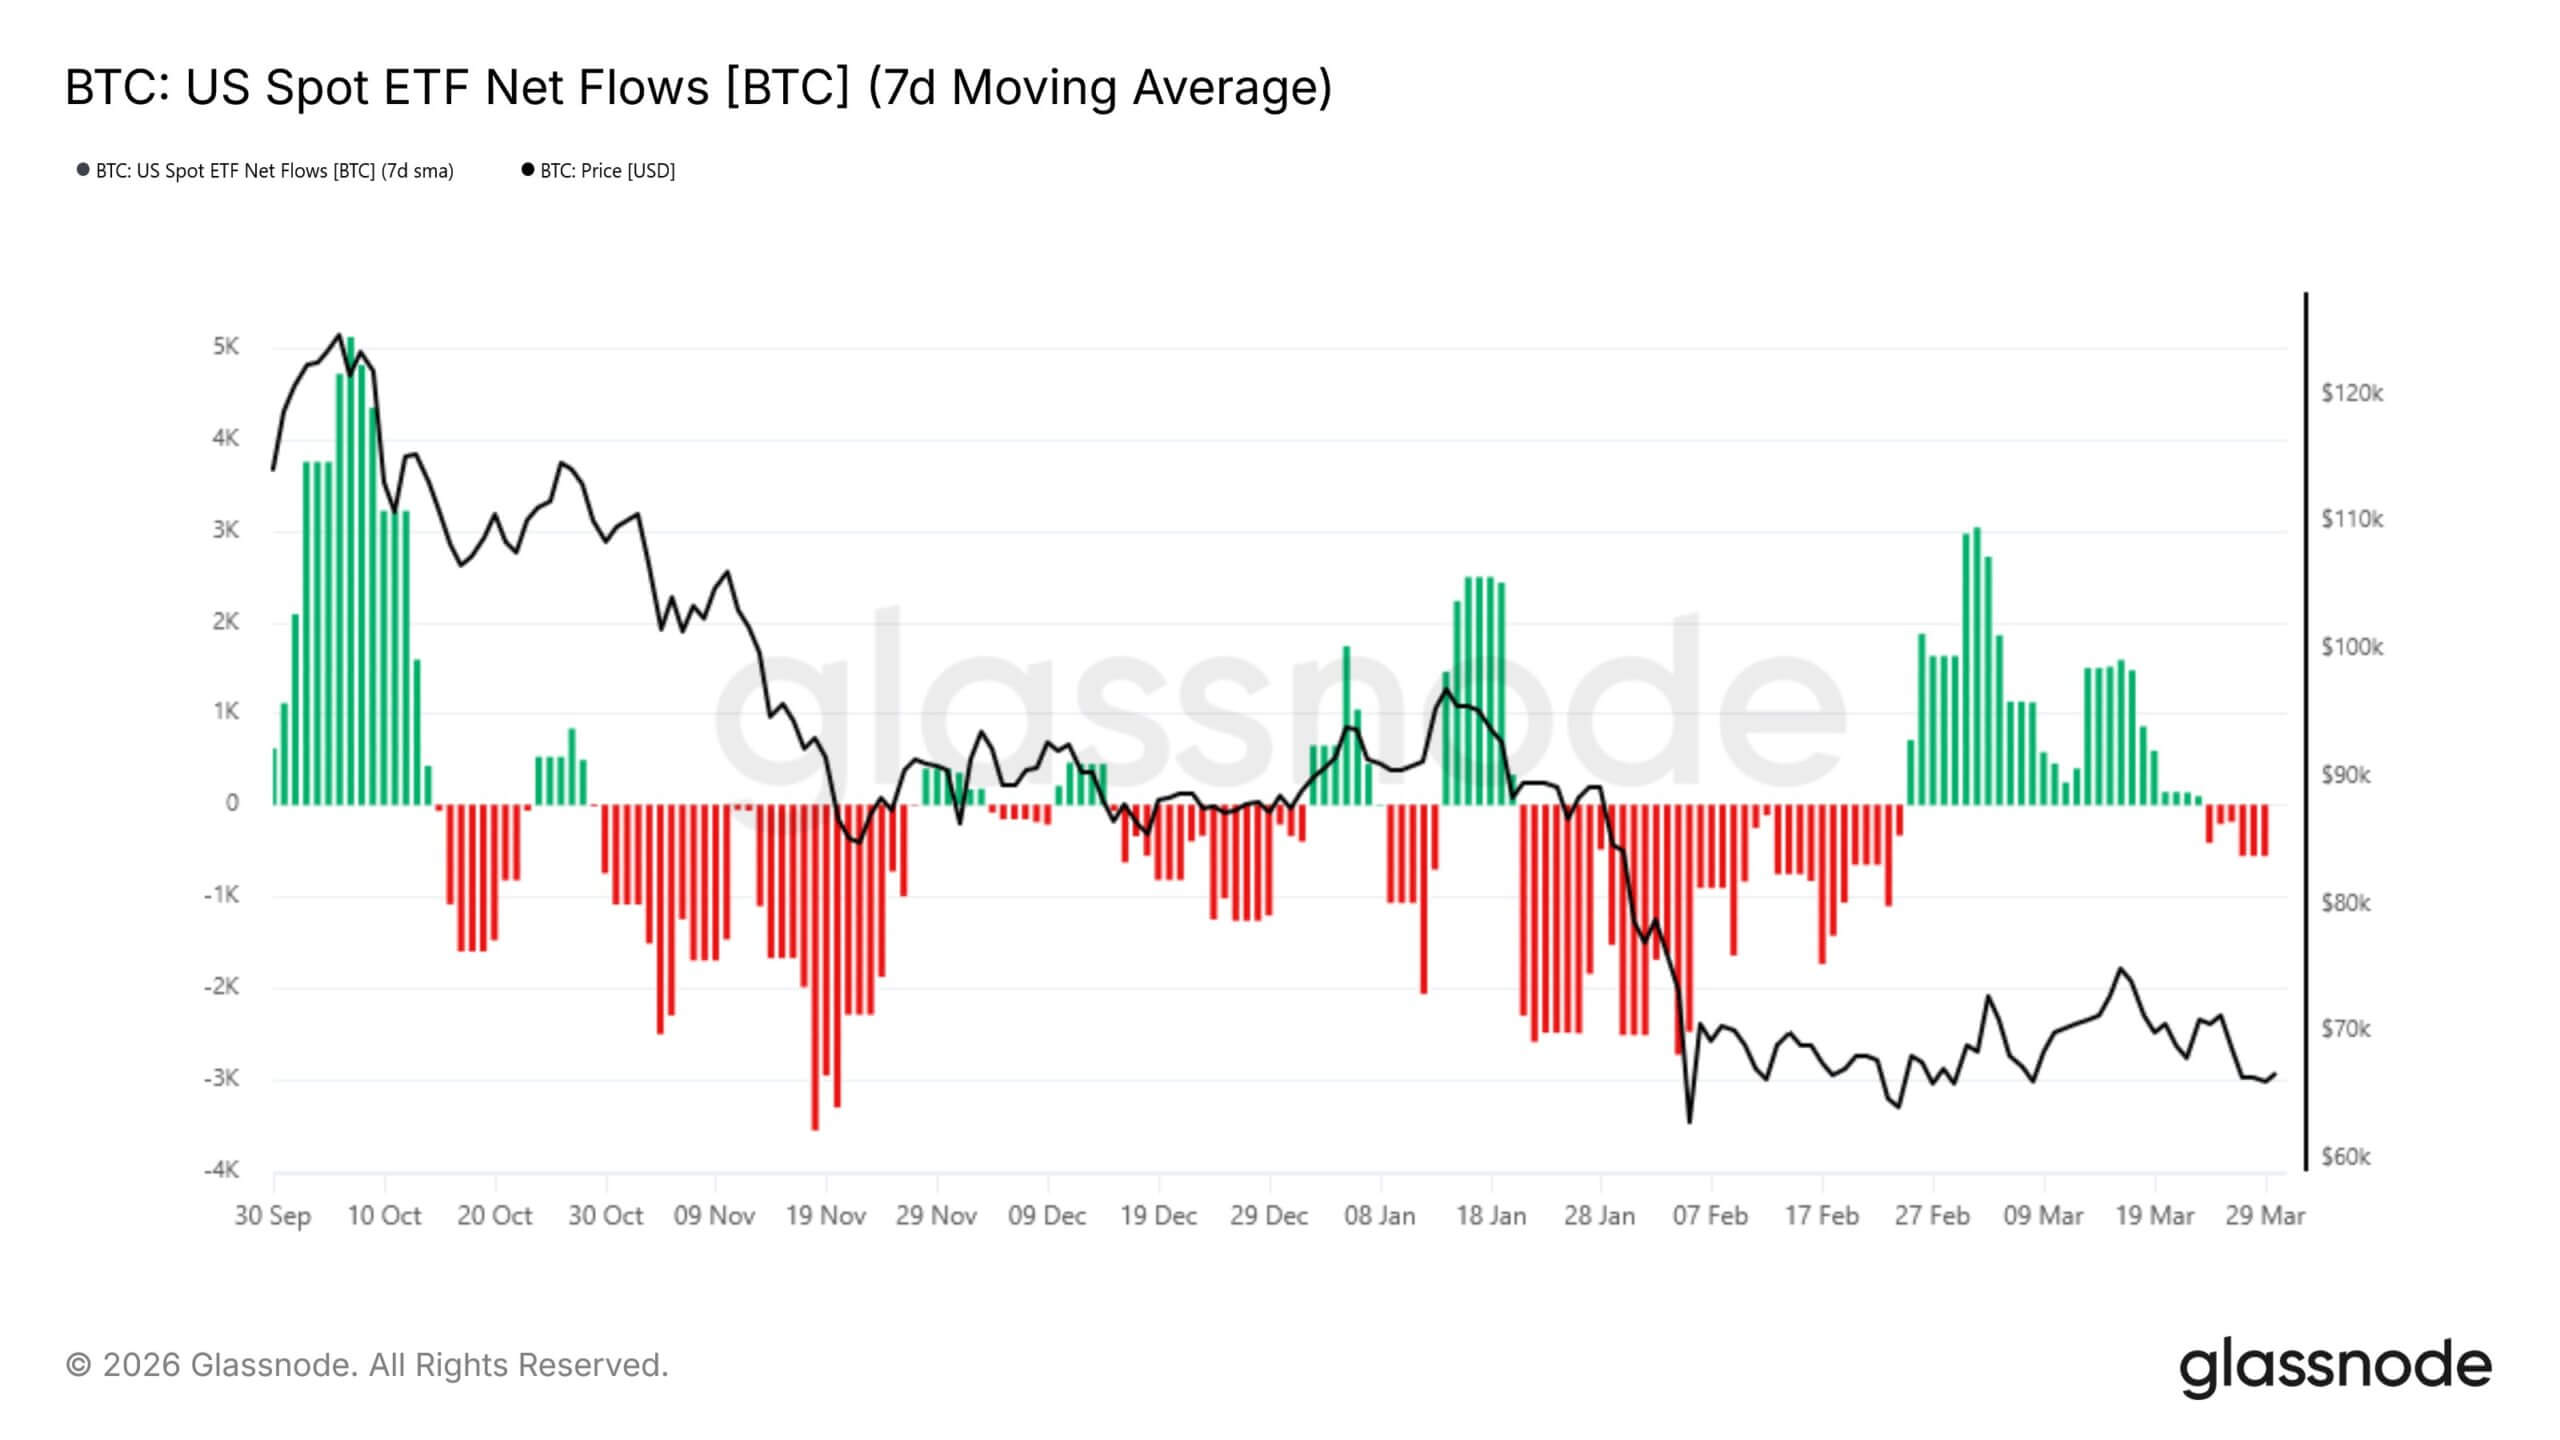 US Bitcoin ETF Netflows (Source: Glassnode)
The trend suggested that while demand was still present, it no longer arrived with the consistency necessary to absorb selling pressure.
CoinShares attributed the slowdown in demand to two broader factors impacting markets: concerns that the conflict in Iran would persist and a shift in expectations for the June Federal Open Market Committee meeting, where investors transitioned from anticipating rate cuts to considering the risk of rate hikes.
This combination left digital assets vulnerable to the same macro repricing affecting other liquidity-sensitive trades.
Simultaneously, the same loss of momentum was evident in the corporate treasury trade, which had been a defining theme of the previous year. What once appeared to be a widespread accumulation story among public companies narrowed significantly, with buying increasingly concentrated in one entity while activity elsewhere dwindled.
CryptoSlate previously reported that Strategy, formerly MicroStrategy, dominated BTC purchasing activity within this group, with the Michael Saylor-led company acquiring over 88,000 Bitcoin during the reporting period. This marks one of its largest quarterly acquisitions since 2025.
Outside of Strategy, the overall picture was considerably weaker. During the same timeframe, all other Bitcoin treasury companies collectively purchased less than they had at the peak of the trade in 2025.
In some instances, companies that had previously advocated for treasury accumulation began to reverse course. Nakamoto sold approximately 284 Bitcoin in March for around $20 million, at an average sale price of $70,422 per coin, after net purchases of 5,342 BTC in 2025 at a weighted average price of $118,171.
This transaction illustrated how swiftly the economics of the trade had shifted. A company that had structured its strategy around Bitcoin accumulation ended up selling coins at a price significantly lower than the average price of its earlier buying efforts.
This reversal highlighted the broader strain on the financing model that supported last year’s treasury boom. The trade gained momentum as Bitcoin surged, and public-market investors rewarded listed companies that provided leveraged exposure to the token through their balance sheets.
As Bitcoin increased in value, many firms were able to issue shares at premiums to the value of the BTC they already held, raise new capital, and acquire additional coins. In some cases, companies also incorporated debt financing to enhance their exposure.
The model relied on rising prices and expanding equity premiums. Once Bitcoin ceased its upward trajectory, maintaining that structure became increasingly challenging.
This created a tighter feedback loop across the sector. A declining Bitcoin price reduced net asset value per share. Lower net asset value and diminished sentiment compressed equity premiums. Narrower premiums then made new stock issuance less beneficial, weakening one of the primary tools companies had utilized to expand their Bitcoin holdings. Once that cycle reversed, the financing engine behind the trade began to lose momentum.
Related Posts
The impact has been particularly evident in treasury-company stocks. Shares that once traded as high-beta proxies for Bitcoin upside have significantly declined from their 2025 peaks, with many underperforming Bitcoin itself.
Thus, what appeared last year to be a scalable public-market strategy has become more difficult to implement in a market where the underlying asset is no longer appreciating rapidly enough to sustain the same financing assumptions.
Routine miner sales begin to weigh more heavily
Another notable factor influencing BTC price performance during the period was the selling activity of Bitcoin miners. While the actions of these groups were not the primary cause of Bitcoin’s weak first quarter, they became increasingly difficult to overlook as demand began to wane.
Asset management firm VanEck reported that miners had effectively sold nearly all newly issued Bitcoin supply over the past year, totaling around 164,000 BTC.
For context, MARA Holdings provided a clear example of how this pressure manifested during the quarter. The company announced on March 26 that it sold 15,133 Bitcoin between March 4 and March 25 for approximately $1.1 billion, using most of the proceeds to repurchase convertible notes and reduce debt.
Other miners were also depleting their treasuries. Core Scientific sold about 1,900 BTC, valued at roughly $175 million, in January and indicated plans to liquidate all remaining holdings substantially in the first quarter of 2026. Bitdeer reduced its treasury to zero in February, while Riot sold 1,818 BTC, worth about $162 million.
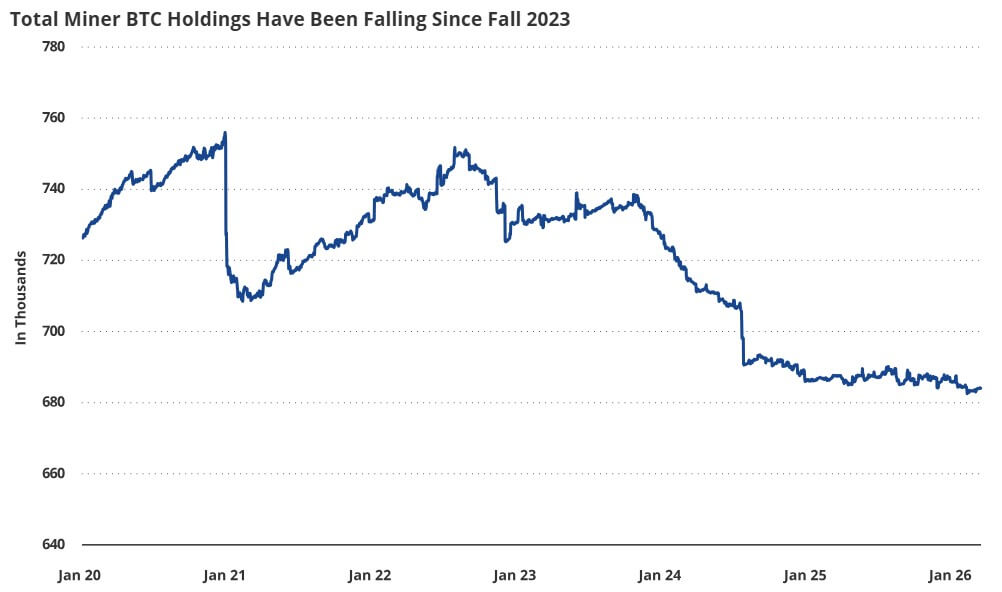 Bitcoin Miners' BTC Balance (Source: VanEck)
This indicated that miners were no longer serving as a significant source of net accumulation. Instead, they had also become net sellers in a market where ETF inflows had become inconsistent and organic buying had diminished.
Moreover, the selling by Bitcoin miners reflected pressures within the mining sector rather than panic regarding the leading cryptocurrency itself.
CoinShares noted that a sharp price correction, coupled with near-record hashrate, pushed hash prices to five-year lows. VanEck echoed similar observations, stating that the average cash cost to produce one Bitcoin among publicly listed miners rose to approximately $79,995 in the fourth quarter of 2025.
This left many operators with tighter margins and fewer financing options.
At the same time, an increasing number of miners were redirecting capital toward artificial intelligence and high-performance computing infrastructure.
CoinShares reported that over $70 billion in cumulative AI and HPC contracts had now been announced across the public mining sector, with companies such as TeraWulf, Core Scientific, Cipher Mining, and Hut 8 increasingly resembling data center operators that also mine Bitcoin.
This helps clarify why the miner sales were significant even without a capitulation event. The issue was not that miners were hastily selling coins in a panic. Rather, they were consistently distributing supplies into a market that no longer had the capacity to absorb them.
When institutional inflows were robust, those balance-sheet sales could occur with limited impact. However, in the first quarter, weaker demand meant that even routine selling began to exert more pressure on prices.
Bitcoin long-term holders are still selling
Bitcoin long-term holders contributed to that pressure as they continued to sell into the new year.
Data from CryptoQuant indicated that this group’s Spent Output Profit Ratio (SOPR) fell below 1, suggesting they were selling at a loss.
According to the firm:
“Since long-term holders are the least sensitive to short-term volatility, a phase in which they begin to realize losses can be interpreted as a broader market-wide capitulation. By this point, short-term holders have likely already exited the market or experienced significant losses.”
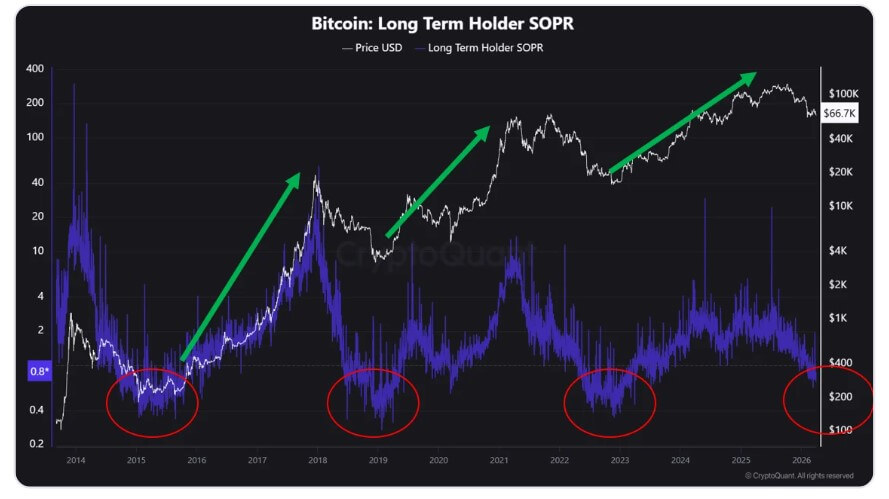 Bitcoin Long-Term Holders SOPR (Source: CryptoQuant)
This is supported by Glassnode, which noted that realized losses remained high into late March but showed no signs of panic, indicating a controlled de-risking phase rather than indiscriminate selling.
Unrealized losses also increased while staying within historical norms, suggesting that stress was building but had not yet escalated into a complete washout.
VanEck’s mid-March ChainCheck pointed to a similar conclusion. It reported that transfer volume declined month over month across every long-term holder age cohort, indicating that older coins were being spent less frequently and that long-term holder distribution was slowing.
This suggested that some experienced holders had reduced risk earlier in the quarter, but by mid-March, the broader trend was becoming more restrained.
Overall, the quarter’s narrative was more complex than a simple assertion that smart money sold into weakness. Long-term holders were also realizing losses, but in a measured manner rather than in a state of panic.
The outcome was a market facing ongoing supply at a time when demand had become less reliable, which was sufficient to keep Bitcoin under pressure without a widespread liquidation across this group.
Bears keep control of the derivatives tape
If spot and on-chain flows illustrated one aspect of the situation, derivatives conveyed the rest.
Glassnode reported that perpetual funding rates remained negative even as Bitcoin stabilized, indicating that traders were still willing to pay to maintain downside exposure. It also noted that futures open interest remained relatively subdued, suggesting that leverage was not being rebuilt in support of a recovery.
The same report indicated that spot market activity remained relatively quiet after the selloff into the $67,000 range, with exchange volumes showing only a modest response and the rebound appearing reactive rather than driven by conviction.
This distinction is significant. Prices can stabilize before buyers genuinely return. Through late March, Bitcoin appeared more balanced than during the worst of the selloff, but not significantly bullish.
Options markets reflected similar caution. VanEck noted that the put-call open interest ratio averaged 0.77 in mid-March, its highest level since June 2021, while put premiums relative to spot volume reached an all-time high of approximately 4 basis points.
Essentially, investors were paying heavily for downside protection even as price action steadied. This is not indicative of a market leaning toward upside; rather, it suggests a market still preparing for another shock.
The post Bitcoin’s support system broke in Q1 — and the buyers that used to hold it up stepped back appeared first on CryptoSlate.