Disclaimer: Information found on CryptoreNews is those of writers quoted. It does not represent the opinions of CryptoreNews on whether to sell, buy or hold any investments. You are advised to conduct your own research before making any investment decisions. Use provided information at your own risk.
CryptoreNews covers fintech, blockchain and Bitcoin bringing you the latest crypto news and analyses on the future of money.
Bitcoin’s price has historically not concluded a year at a higher level following such a poor start — will 2026 change this trend?
Bitcoin has never concluded a year positively after such a poor start
Bitcoin seasonality is a market narrative that persists due to the simplicity of averages, which are easily captured in screenshots. However, the average often conceals the crucial factor: the market state.
A robust “Uptober” during a healthy bull trend differs significantly from a strong October following a year that began with losses. A favorable December average does not provide an advantage if the median month remains negative. Additionally, a strong Q1 does not automatically indicate continued growth if the market has already realized most of its potential gains.
This is the fundamental takeaway. The valuable aspect of Bitcoin price seasonality is not merely the calendar. The interplay between month, market regime, and trajectory is far more significant.
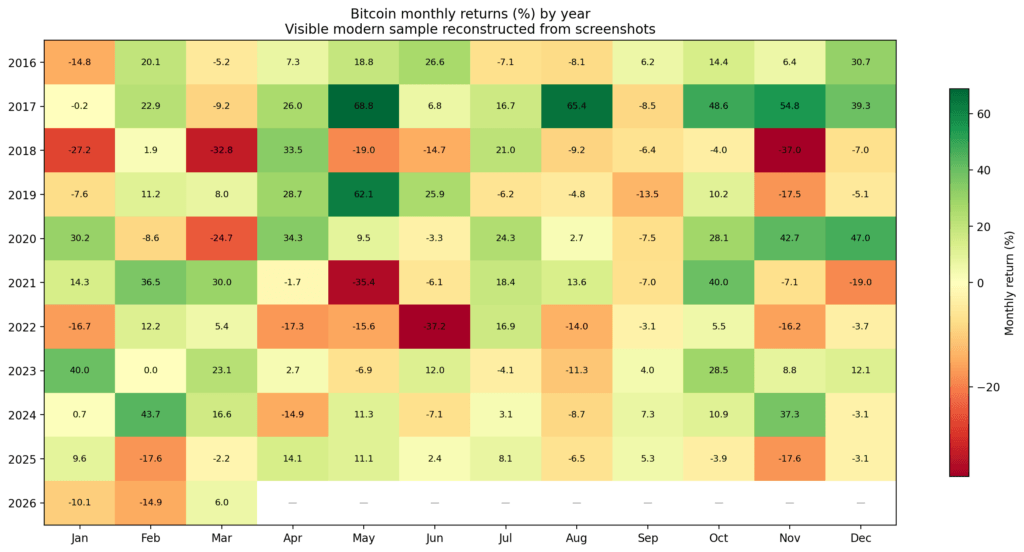 Heatmap of Bitcoin monthly returns by year from 2016 to 2026, with green gains and red losses.
The initial issue with the seasonality narrative is that averages distort the distribution
When examining mean monthly returns, Bitcoin seems to present a series of recurring bullish opportunities. In the recent data, October stands out with a mean return of 17.8%, a median of 12.7%, and an 80% win rate. July also performs well, showing a 9.1% mean return, a 12.4% median, and a 70% win rate. February and April also appear relatively positive.
However, once you delve deeper than averages, the situation shifts rapidly.
August serves as a clear example. The mean return is slightly positive at 1.9%, which seems harmless until you examine the details: the median is -7.3%, the win rate is only 30%, and the distribution is positively skewed.
In simpler terms, August has not proven to be a reliable “up month.” It has been characterized by a low hit rate, occasionally buoyed by a few significant upside outliers.
December faces a similar issue, albeit in a milder form. The mean is positive, yet the median is negative, and the win rate is merely 40%. November is comparable: it shows a headline-positive average, but the distribution has enough variance and downside risk to make the average appear more favorable than the actual experience of holding risk during that month.
May presents another pitfall. The average return appears robust, but dispersion dominates the month. The upside tail is substantial, the downside tail is significant, and the standard deviation is high enough that stating “May is positive on average” provides little insight into the actual risk involved.
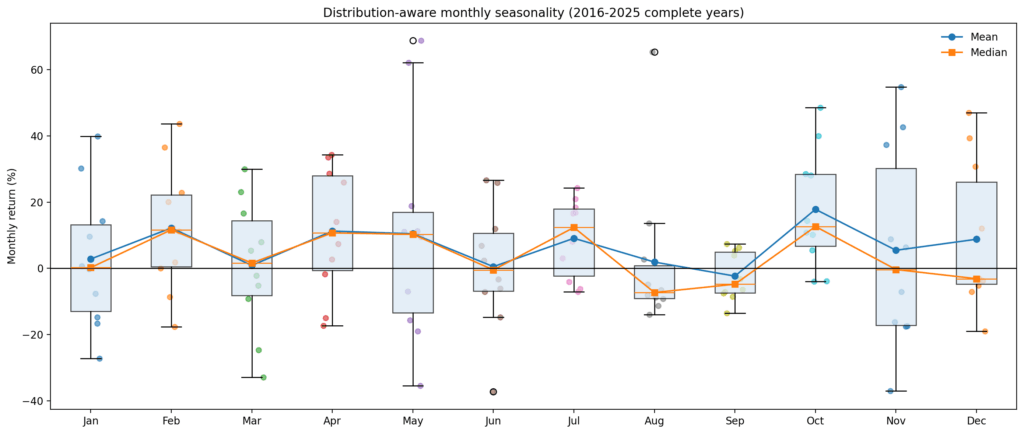 Box-and-whisker chart of Bitcoin monthly returns from 2016 to 2025, showing the distribution for each month with mean and median lines.
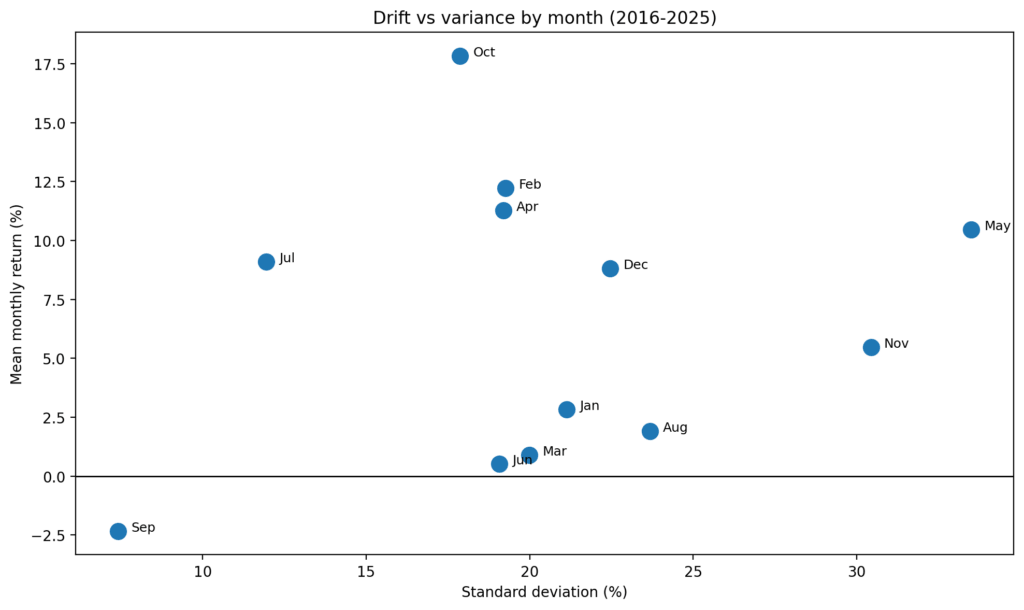 Scatter plot titled showing each month’s mean Bitcoin return versus standard deviation; October has the highest average return, while September is the only month with a negative average return.
Some months exhibit drift dominance, where the mean, median, and win rate align broadly. Others are variance-dominant, where the average tells more of a story than it does forecast.
 Related Reading
The $100 billion corporate Bitcoin surge is down to one buyer as other companies stop adding
Market pressures compel Bitcoin treasury firms to reevaluate strategies, with Strategy emerging as a significant player.
Mar 26, 2026 · Oluwapelumi Adejumo
The months that seem most applicable are not the ones most frequently discussed
October stands out as the most reliable month. Not because it always succeeds (it does not), but because its average, median, and win rate all align positively.
July follows as the next best example. These months represent the closest approximations to stable seasonal opportunities in the data.
Conversely, some of the more commonly referenced seasonal points appear fragile.
August’s favorable mean is largely a result of skew. November and December can perform well, but they do not represent clean trend months in a statistical context. They are conditional months that require validation from the market regime and trajectory.
This distinction marks the line between genuine advantage and illusion. A month with a positive average does not inherently indicate a month with a repeatable advantage.
If the median is negative and the win rate is low, what exists is not true seasonality. Instead, it is optionality masquerading as consistency.
 Related Reading
Bitcoin miners start funding pivot to AI with debt while selling BTC to stay liquid
CoinShares’ latest mining report indicates that the most significant shift is that pressured miners are liquidating coins, stronger operators are transitioning into AI, and publicly traded mining stocks are becoming less reliable Bitcoin proxies than many investors believe.
Mar 26, 2026 · Gino Matos
Market regime alters the nature of the seasonal signal
The next step involved categorizing years into distinct regimes: bull years with annual returns exceeding 50%, bear years with returns below -20%, and neutral years in between.
Once this categorization is made, unconditional seasonality begins to resemble less of a structured pattern and more of a blended average of opposing states.
Several months change sign based on the regime, including January, March, May, June, August, November, and December.
In essence, the same month that appears favorable in the overall sample can turn negative when examined within a weaker macro context.
This aligns with the expectation that seasonality is influenced by market state rather than being independent of it.
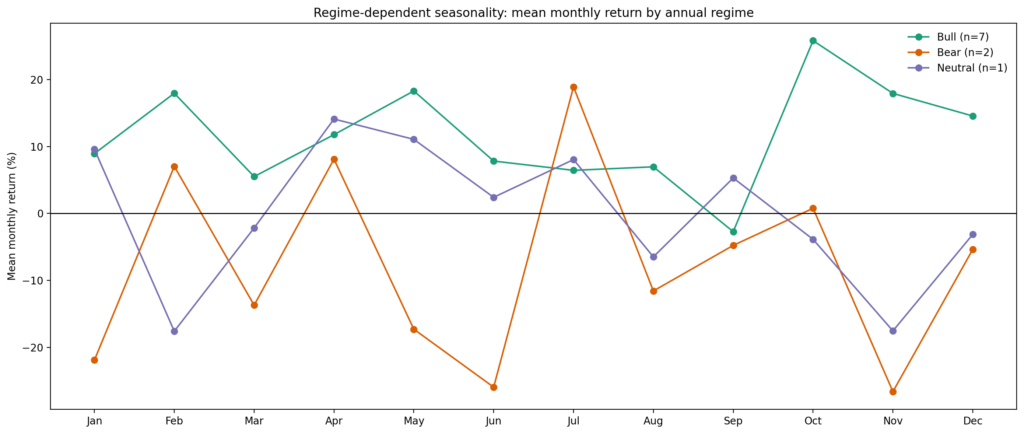 Line chart comparing Bitcoin’s average monthly returns across bull, bear, and neutral yearly regimes, showing stronger gains in September to December during bull years and weaker late-year performance in bear years.
Only a few months appear relatively resilient across different regimes. July is the strongest candidate. April shows some constructive characteristics as well, though not as clearly. September, on the other hand, remains weak enough across major regimes that it warrants recognition as a recurring soft period rather than a mere anomaly.
The limitation is evident: the bear sample is small. However, this is also the point. If a seasonal assertion collapses when you question whether it endures across varying states of the market, it likely was never a robust assertion to begin with.
 Related Reading
Bitcoin is down 43%, yet almost every other crypto has lost more
Several tokens are nearing previous highs, challenging Bitcoin’s relative standing.
Mar 25, 2026 · Liam 'Akiba' Wright
The true advantage lies in path dependency, not calendar myths
The most significant signals are not monthly averages at all. They are state variables linked to the trajectory of the year.
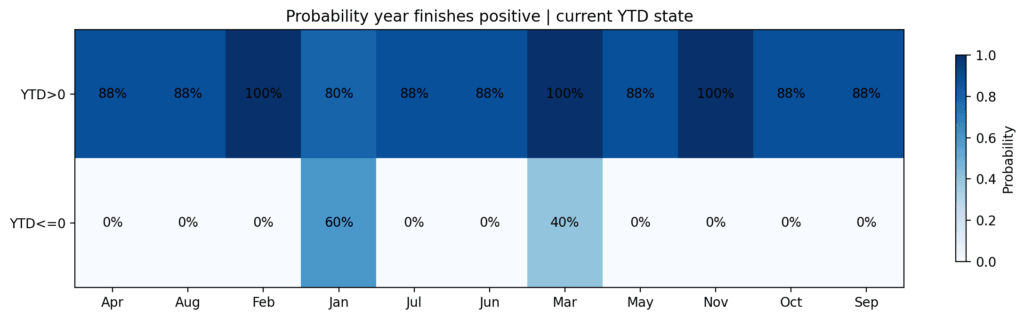 Heatmap showing probability of a positive year-end return for Bitcoin by month and whether the year is currently up or down YTD, with higher probabilities concentrated when BTC is already positive YTD.
In the 2016–2025 data set, if Bitcoin was positive year-to-date after February, it concluded the year positively seven out of seven times.
Related Posts
If it was negative year-to-date after February, it finished positively zero out of three times.
After March, the distinction remained significant: positive YTD years concluded positively five out of five times, while negative YTD years only finished positively two out of five times.
This distinction is not trivial. It implies that by late Q1, Bitcoin’s seasonal profile is already being influenced by whether the year is in a healthy trend or in a recovery phase.
The market does not merely enter “good” or “bad” months. It enters them from a specific state, which alters the future distribution.
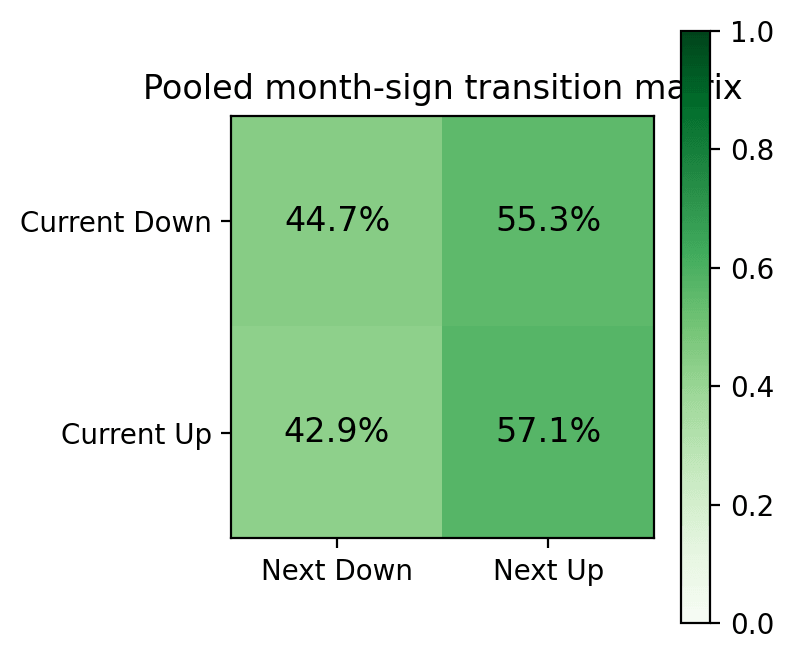 Heatmap showing Bitcoin month-to-month sign transitions, with the next month more likely up than down after both up and down months.
Equally important, simple month-to-month sign momentum does not hold true. Following an up month, the next month was positive 57.1% of the time. After a down month, the next month was positive 55.3% of the time. This does not represent a significant advantage.
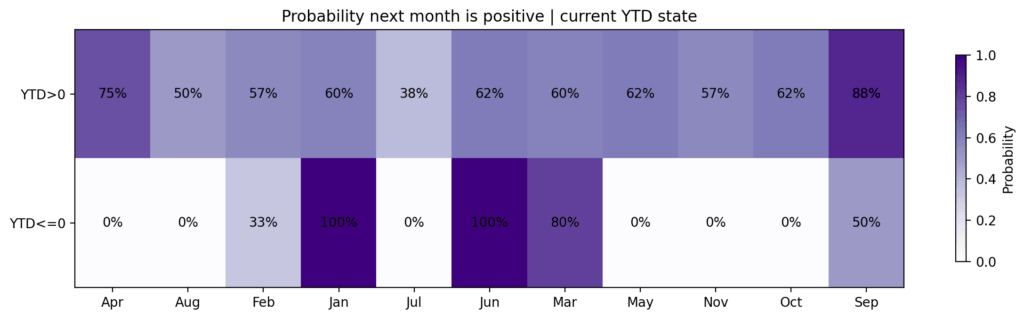 Heatmap showing Bitcoin’s probability of a positive next month by month and whether year-to-date performance is positive or negative
The valuable signal only becomes apparent when you consider the broader trajectory, the YTD performance, the Q1 outcome, and whether the year is in a recovery or decline phase.
A strong Q1 benefits the year, but often hampers the subsequent quarter
One of the more intriguing findings is that strong early-year performance does not serve as a clear continuation signal.
Years with Q1 returns exceeding 20% did finish positively every time. However, Q2 in those years was weak on average, with a mean decline of 15.1%.
This distinction is crucial as it separates direction from timing.
A strong Q1 improved the likelihood of a positive full-year outcome, but it also tended to pull forward returns and increase the chances of a spring correction.
In essence, the market could remain structurally positive while simultaneously becoming more challenging to hold through Q2.
The data does not support the assumption that a positive year-level tendency equates to a positive entry signal for the following month or quarter.
June appears to be the critical decision point
If there is a practical seasonal checkpoint in the data, it is not a single month but the year’s condition by midyear. Years with first-half returns at or below zero have never finished positively. Conversely, years with positive first-half returns concluded positively seven times out of eight, with 2025 as the notable exception.
This same logic applies to years with negative Q1 performance. If a weak first quarter was succeeded by a Q2 rebound exceeding 20%, the full-year outcome improved significantly.
If the rebound failed to surpass that threshold, the year did not finish positively. This does not imply that Q2 is destiny, but it does make it the most critical repair window in the annual trajectory.
The implication is clear. Once a year begins in a damaged state, the onus shifts to Q2.
If the market cannot effectively recover by June, the rationale for relying on second-half seasonal optimism diminishes considerably.
Why 2026 is significant now
This framework is particularly pertinent for 2026, as the year has already deviated from one of the clearer modern path templates.
Historically, a negative January has been followed by a positive February — until now.
2026 commenced with a 10% drop in January, experienced an additional 14.8% decline in February, and then rebounded 6% by mid-March, resulting in Q1 being down approximately 19%.
This negative-negative-positive sequence is atypical in the recent data, placing 2026 in what can best be described as a repair-or-failure state.
Cluster analysis positions the current year closest to a group that includes 2016, 2018, 2022, and 2025.
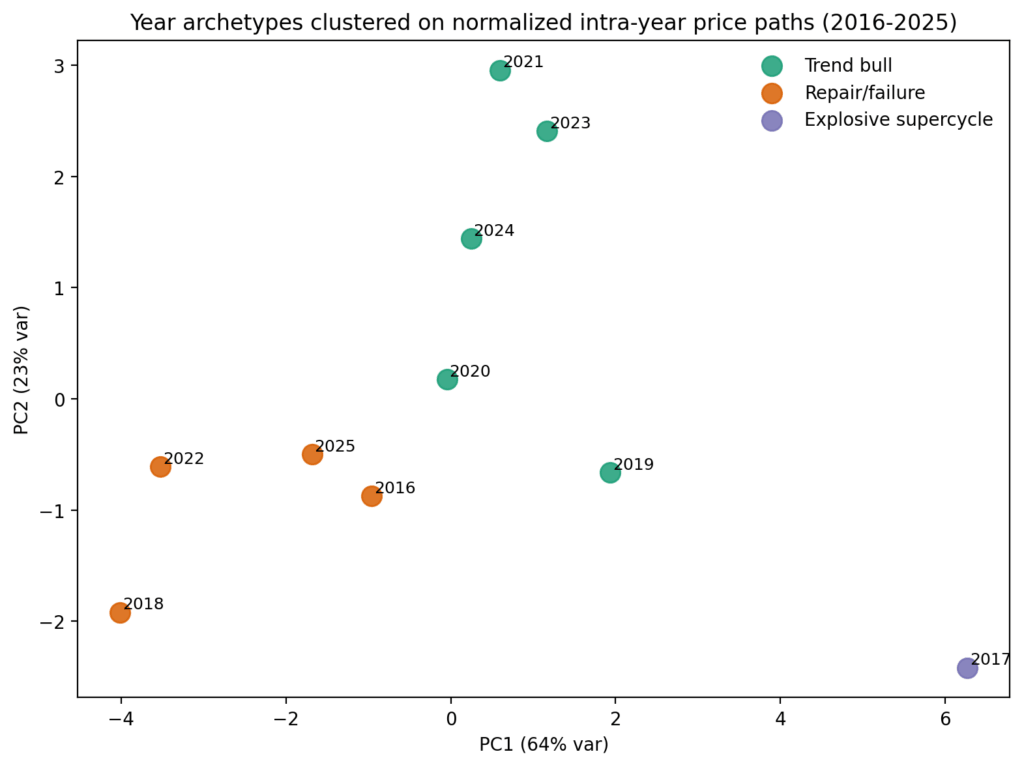 Scatter plot clustering Bitcoin year archetypes from 2016 to 2025 by normalized intra-year price paths, with 2021, 2023, and 2024 in the trend-bull cluster, 2016, 2018, 2022, and 2025 in repair-failure, and 2017 in an explosive supercycle outlier.
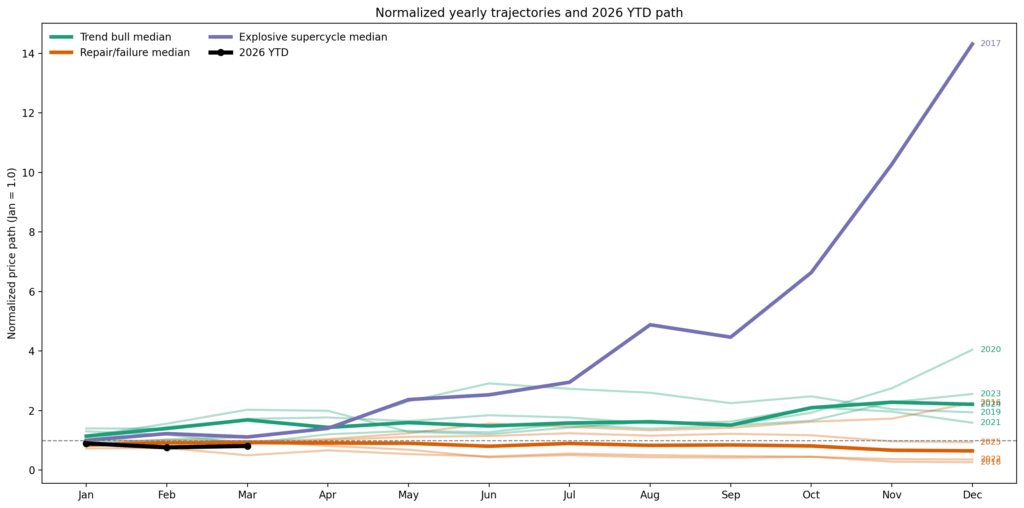 Line chart comparing normalized yearly Bitcoin price trajectories with a projected 2026 path, showing 2026 sharply accelerating into year-end far above prior years and historical median trends.
The appropriate context for 2026 is one successful repair year, two failure years, and one rebound-without-trend year. It is not about “Bitcoin typically performs well in Q4,” nor is it about “the worst is over because March saw a bounce,” but rather: can Q2 accomplish enough to shift the year out of a damaged state?
The 2026 scenario tree represents a repair challenge, not a seasonal certainty
The most optimistic likely outcome from this point is a genuine repair regime. This would manifest as a vigorous Q2 recovery, some summer consolidation, and then renewed upward movement in the latter half of the year.
Historically, the closest parallel is 2016, with 2020 as a more explosive upside outlier.
To even bring the first half of 2026 back to a neutral position from current levels, Bitcoin would need to increase by over 20% in Q2. To make the year appear as a strong repair rather than just a partial rebound, it would require significantly more.
The bearish scenario involves a continuation failure, with 2018 and 2022 serving as clear reference points. In this scenario, spring strength proves to be tactical rather than structural, the market reopens downside later in Q2 or Q3, and the typical “good months” fail to deliver the substantial results investors anticipate.
2026 is not in a position where unconditional seasonality can be relied upon. The year must earn a more favorable seasonal profile through repair.
The current sell-off does not bolster the case for a bullish rebound, indicating that the potential ceiling for Bitcoin in 2026 is around $88,000.
So where lies the advantage?
Bitcoin seasonality offers the most benefit in a limited set of circumstances. It is advantageous when a month already has a strong historical distribution and the year enters that month from a healthy state. October and July serve as the prime examples in the recent data. They resemble genuine drift windows more than variance anomalies.
Seasonality also acts as a filter for damaged years. If Bitcoin remains negative year-to-date into spring, the calendar alone is insufficient. What is crucial is whether Q2 can mend the year’s trajectory. If it can, the second half becomes significantly more credible. If it cannot, the more optimistic seasonal narratives begin to appear as wishful thinking.
Where seasonality becomes misleading is in regime-agnostic averages and outlier-driven means. A positive average month with a negative median and weak win rate does not constitute a clear advantage.
A favorable calendar month within a damaged annual trajectory is not a setup by itself. Additionally, a strong Q1 does not grant permission to assume uninterrupted continuation into Q2.
The conclusion
The market progresses through January, July, and October, not in isolation, but within varying regimes, with different YTD trajectories, following different types of first-quarter performance.
Once these factors are considered, much of the broader seasonal narrative weakens, but the elements that remain become more actionable.
Bitcoin seasonality is not obsolete. It is predominantly conditional. The true advantage lies not in memorizing the “best months.” The real skill is recognizing when the market has justified the significance of those months.
For 2026, this translates to one primary consideration: Q2 is the critical test.
If Bitcoin can sufficiently repair damage by June, the second half warrants the benefit of the doubt. If not, then regardless of what the calendar indicates, the trajectory is conveying