Disclaimer: Information found on CryptoreNews is those of writers quoted. It does not represent the opinions of CryptoreNews on whether to sell, buy or hold any investments. You are advised to conduct your own research before making any investment decisions. Use provided information at your own risk.
CryptoreNews covers fintech, blockchain and Bitcoin bringing you the latest crypto news and analyses on the future of money.
The supply of Bitcoin that was last active less than a month ago has fallen to an 8-year low. This often disregarded metric offers crucial insights into the current market dynamics and is beneficial when examining historical patterns.
Understanding Bitcoin’s supply dynamics is advantageous for market analysis, as it sheds light on the trading behaviors of its extensive user community. Historically, Bitcoin’s supply last active less than a month ago has been the most erratic segment of its supply, accounting for the bulk of daily transaction activities. Its fluctuations, or the absence thereof, can serve as a signal for broader market movements.
As of August 20, the total supply of Bitcoin last active less than a month ago fell to 1.12 million BTC. This marks a significant drop from the 1.28 million BTC recorded on August 14. During this period, Bitcoin’s price decreased from $29,400 to $26,200.
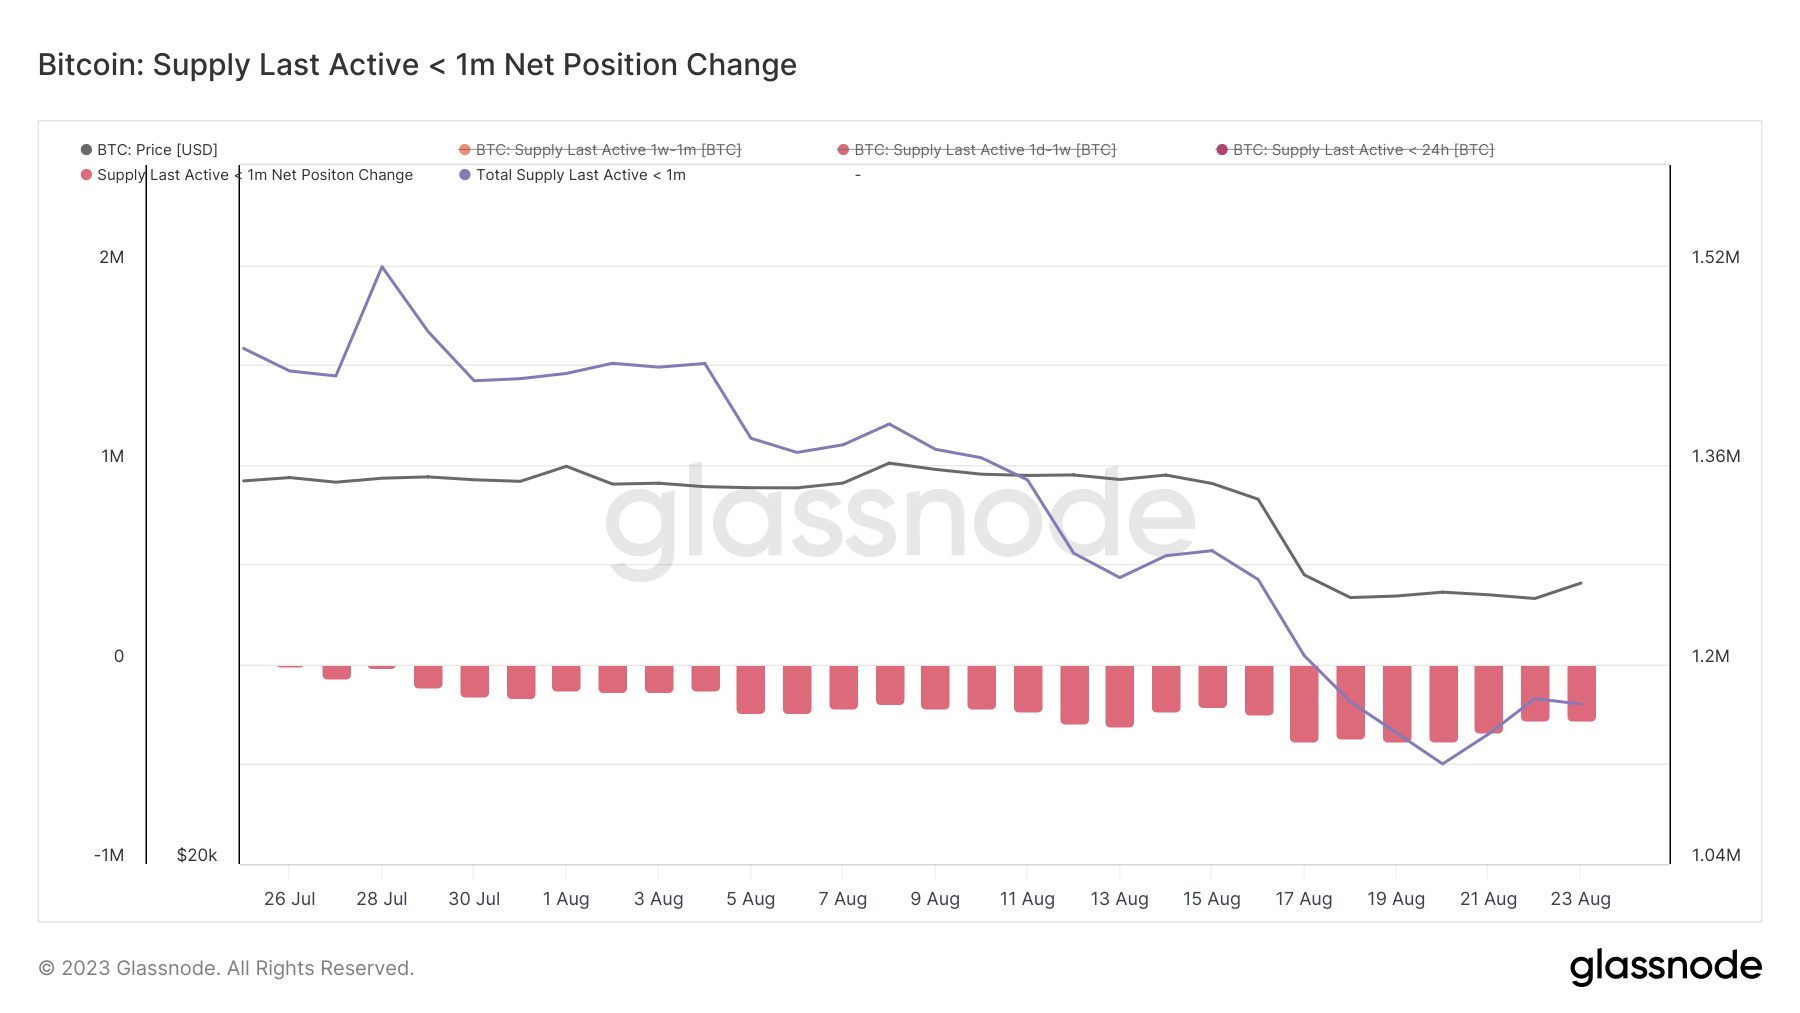 Graph depicting the total supply of Bitcoin last active less than a month ago in August 2023 (Source: Glassnode)
This swift decline led to the supply reaching its lowest level in 8 years.
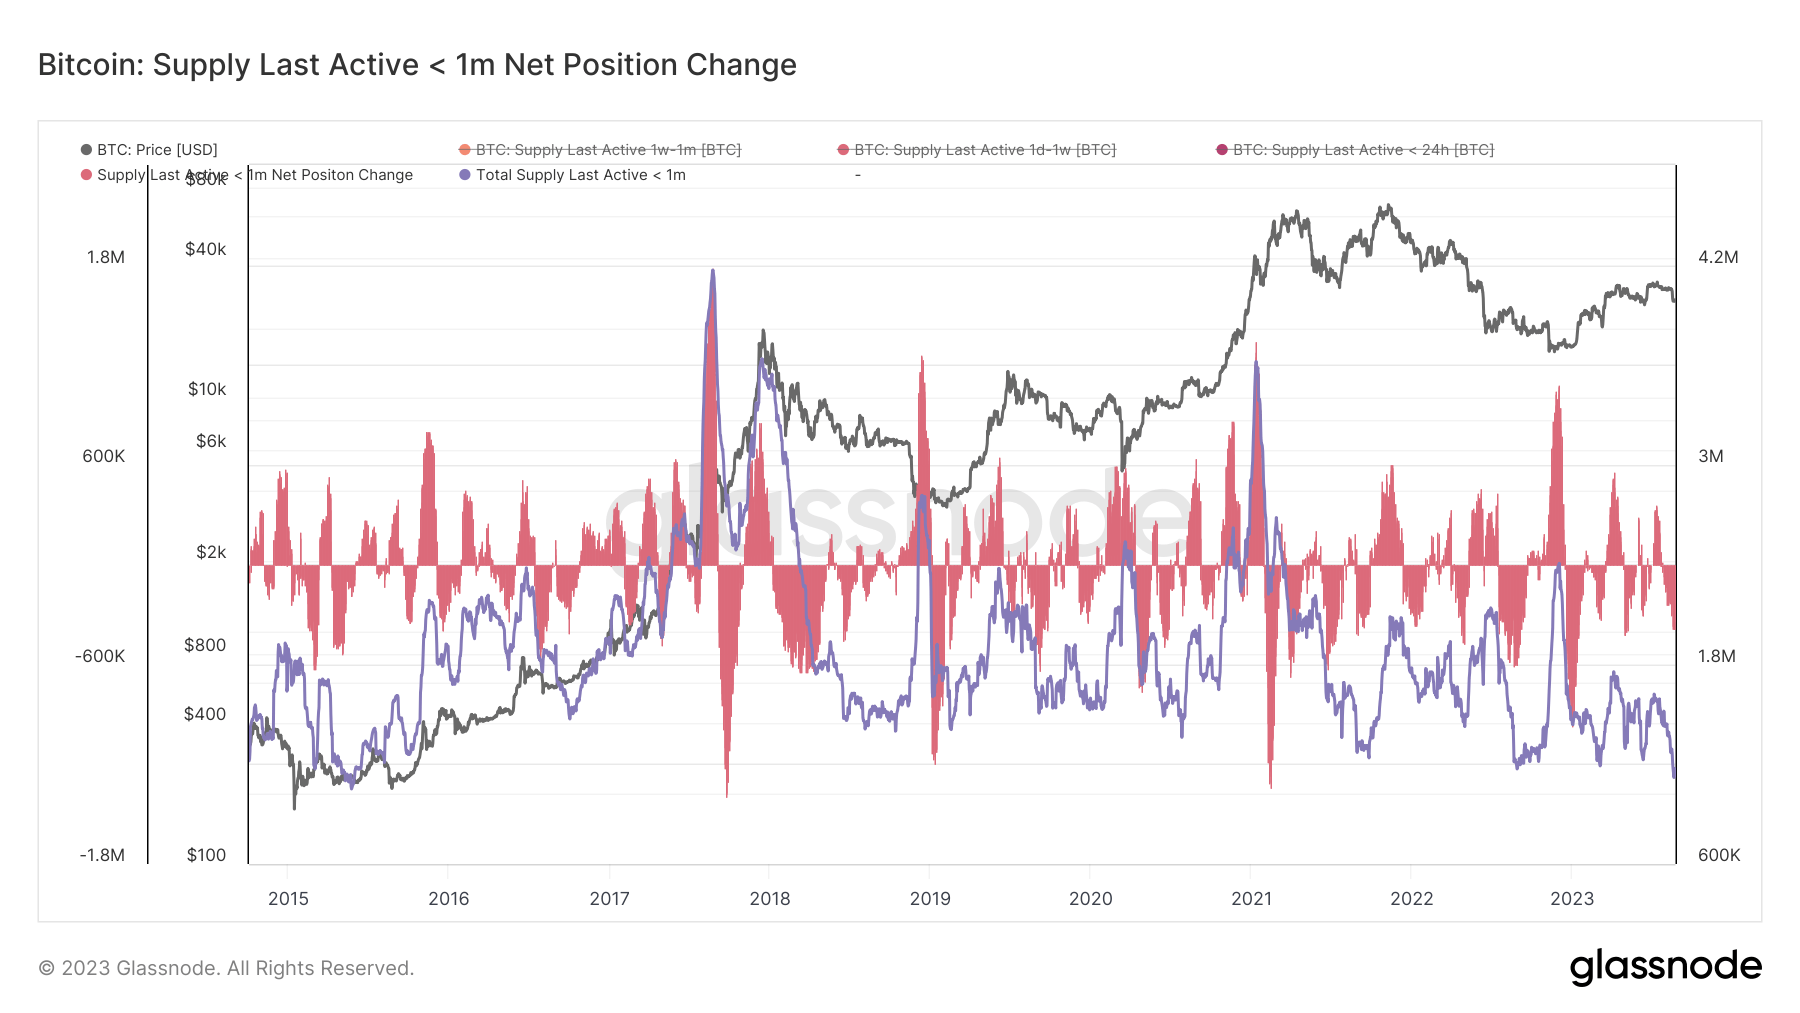 Graph illustrating the total supply of Bitcoin last active less than a month ago from 2015 to 2023 (Source: Glassnode)
Data from Glassnode also indicated that the supply last active less than 3 months ago saw a minor decrease, dropping from 2.79 million BTC on August 14th to 2.75 million BTC by August 23rd.
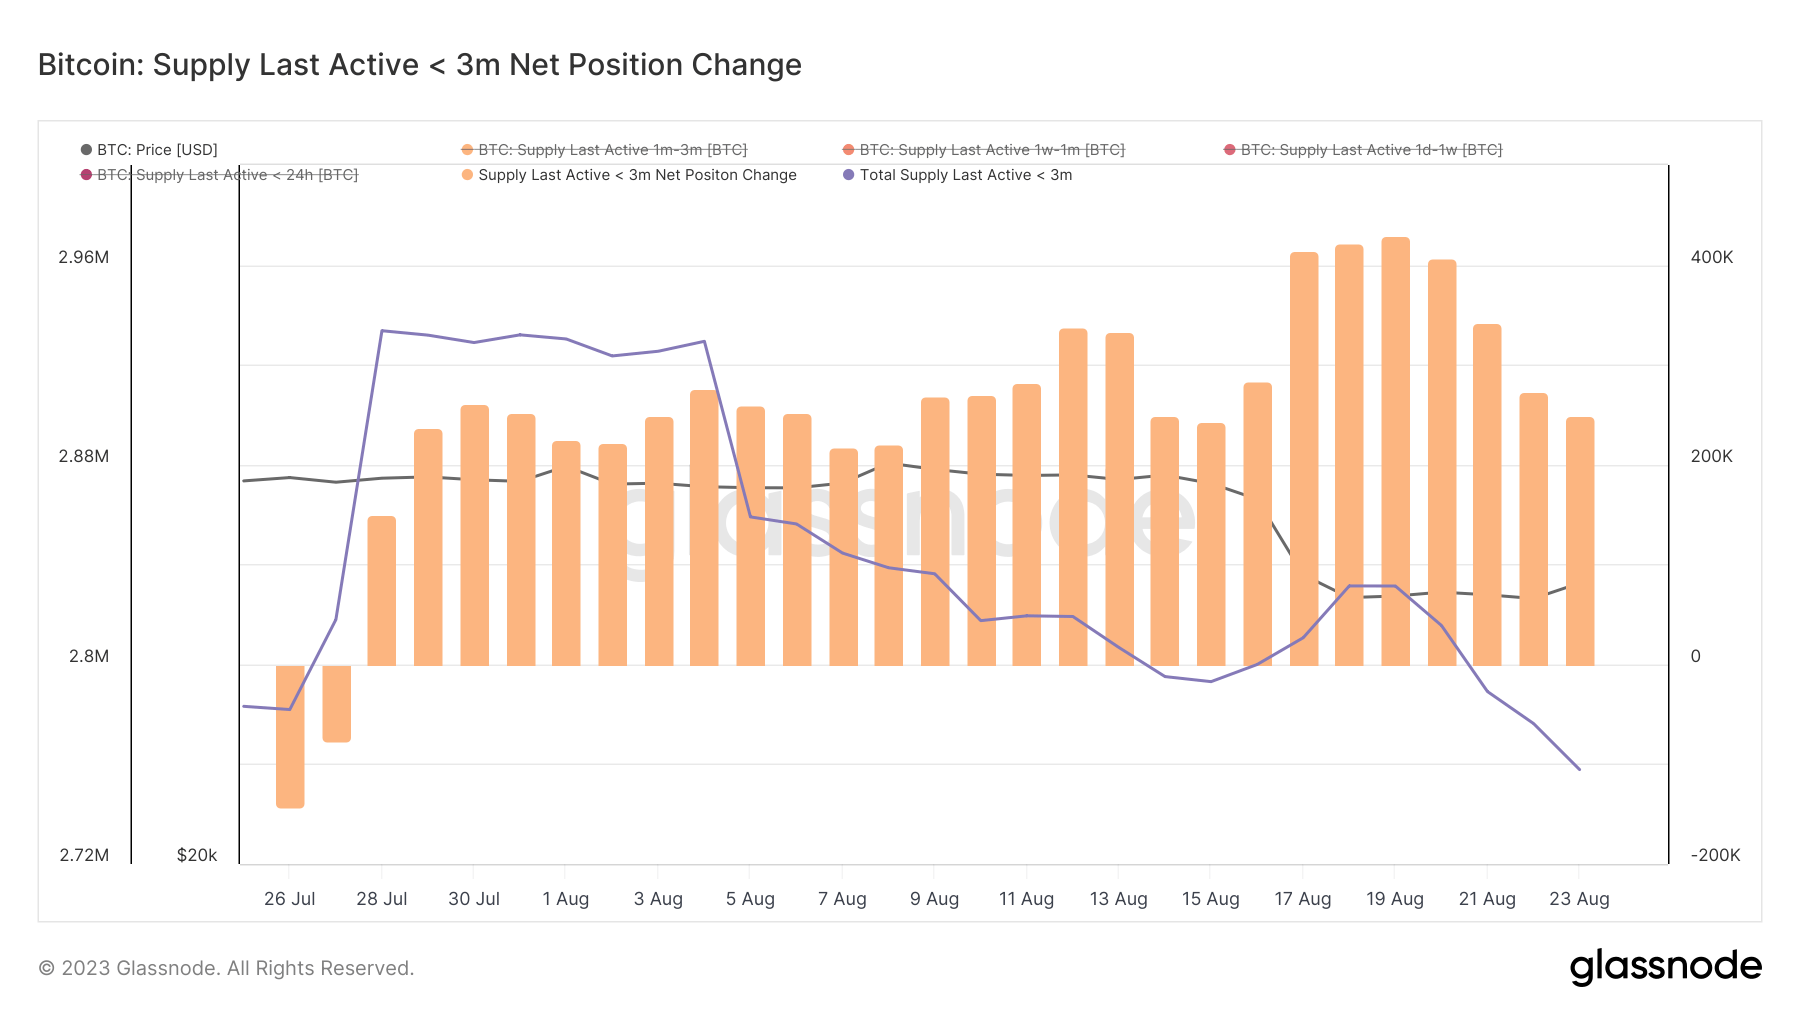 Graph representing the supply last active less than 3 months ago in August 2023 (Source: Glassnode)
Notably, the supply last active more than 6 months ago remained relatively unchanged, even as Bitcoin’s price endured a decline. This steadiness in the long-term active supply suggests that while short-term traders might be adjusting their holdings, long-term holders appear unaffected by the price volatility.
Related Posts
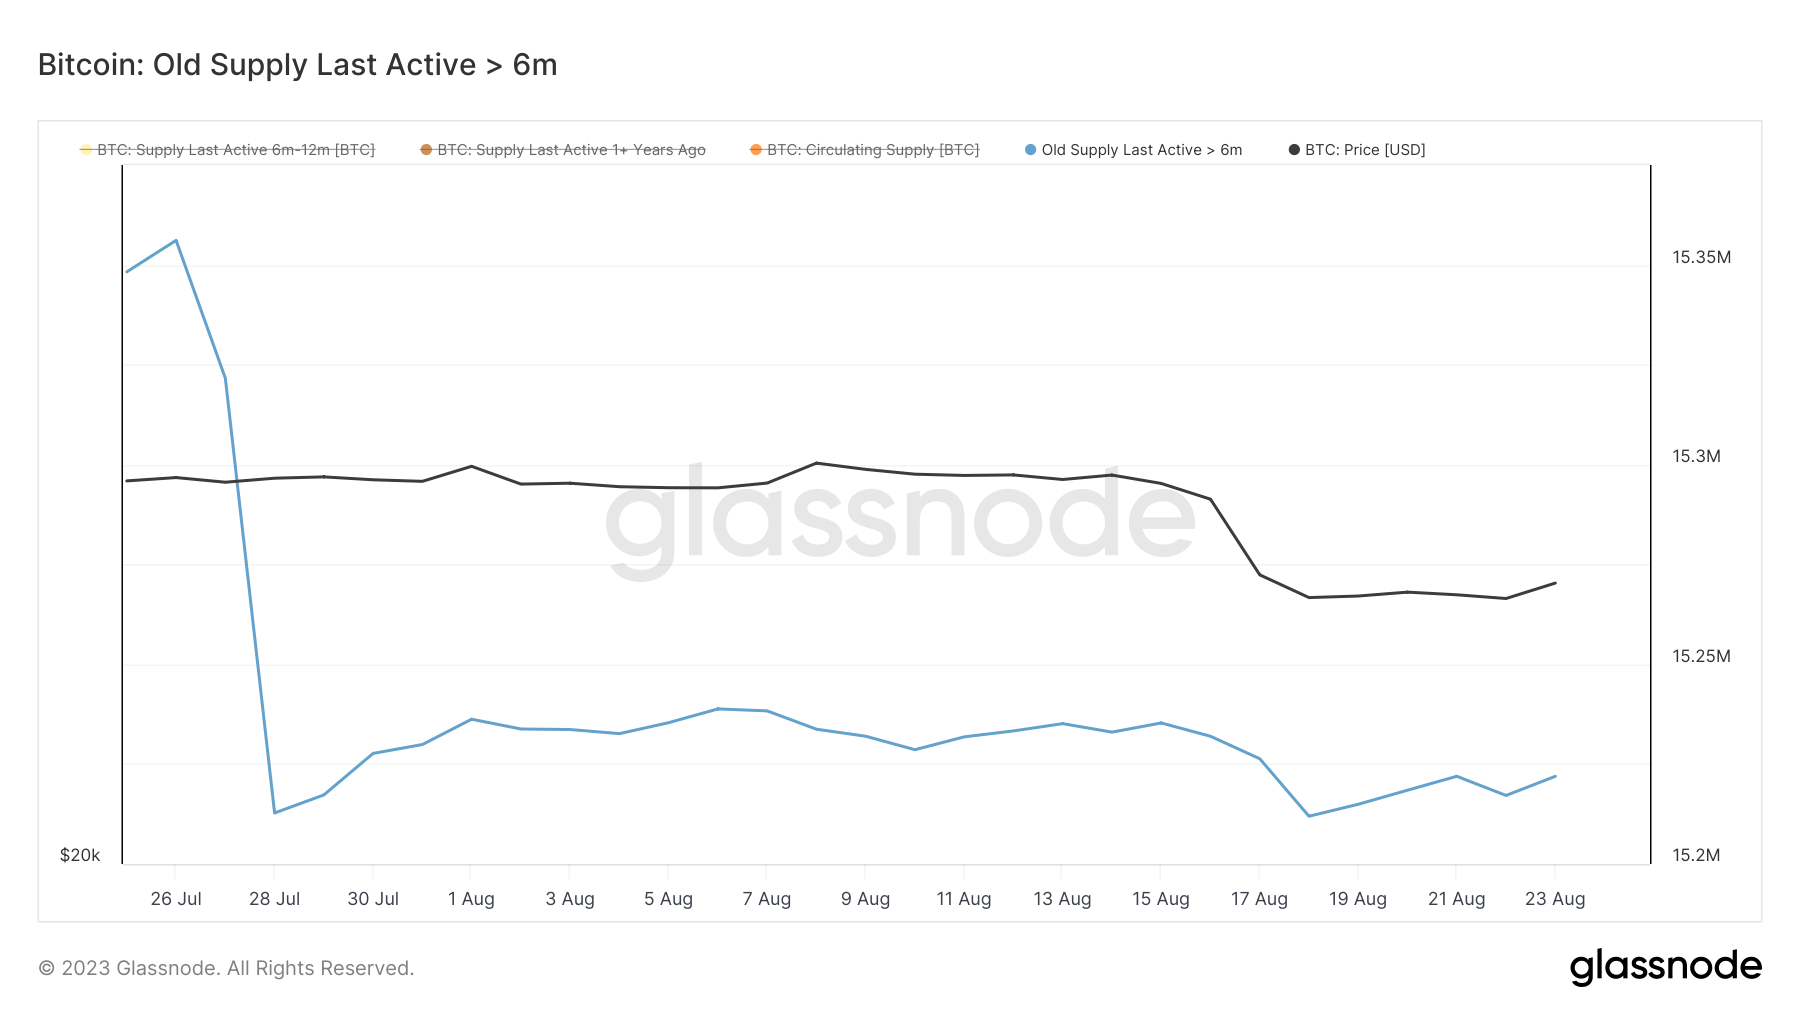 Graph showing the supply last active more than 6 months ago in August 2023 (Source: Glassnode)
The marked reduction in “hot coins” indicates a decline in daily trading activity. A decrease in the movement of coins suggests that traders and investors are shifting from active transactions with BTC to a holding pattern.
This year, the market has witnessed a clear relationship between the reduction in the supply of these active coins and declines in Bitcoin’s price. In contrast, an increase in this supply has frequently been associated with a rise in Bitcoin’s price.
The current trend of reduced Bitcoin activity may be interpreted in various ways. It could imply a stabilization in the market, with fewer participants actively trading BTC. Alternatively, it might signal market stagnation, with potential traders holding onto their BTC in anticipation of clearer signals before taking action.
Nevertheless, some anomalies have emerged within this trend.
In November 2022, a disruption in this correlation occurred during the FTX collapse. At that time, a significant surge in hot coins was observed while Bitcoin’s price experienced a substantial drop.
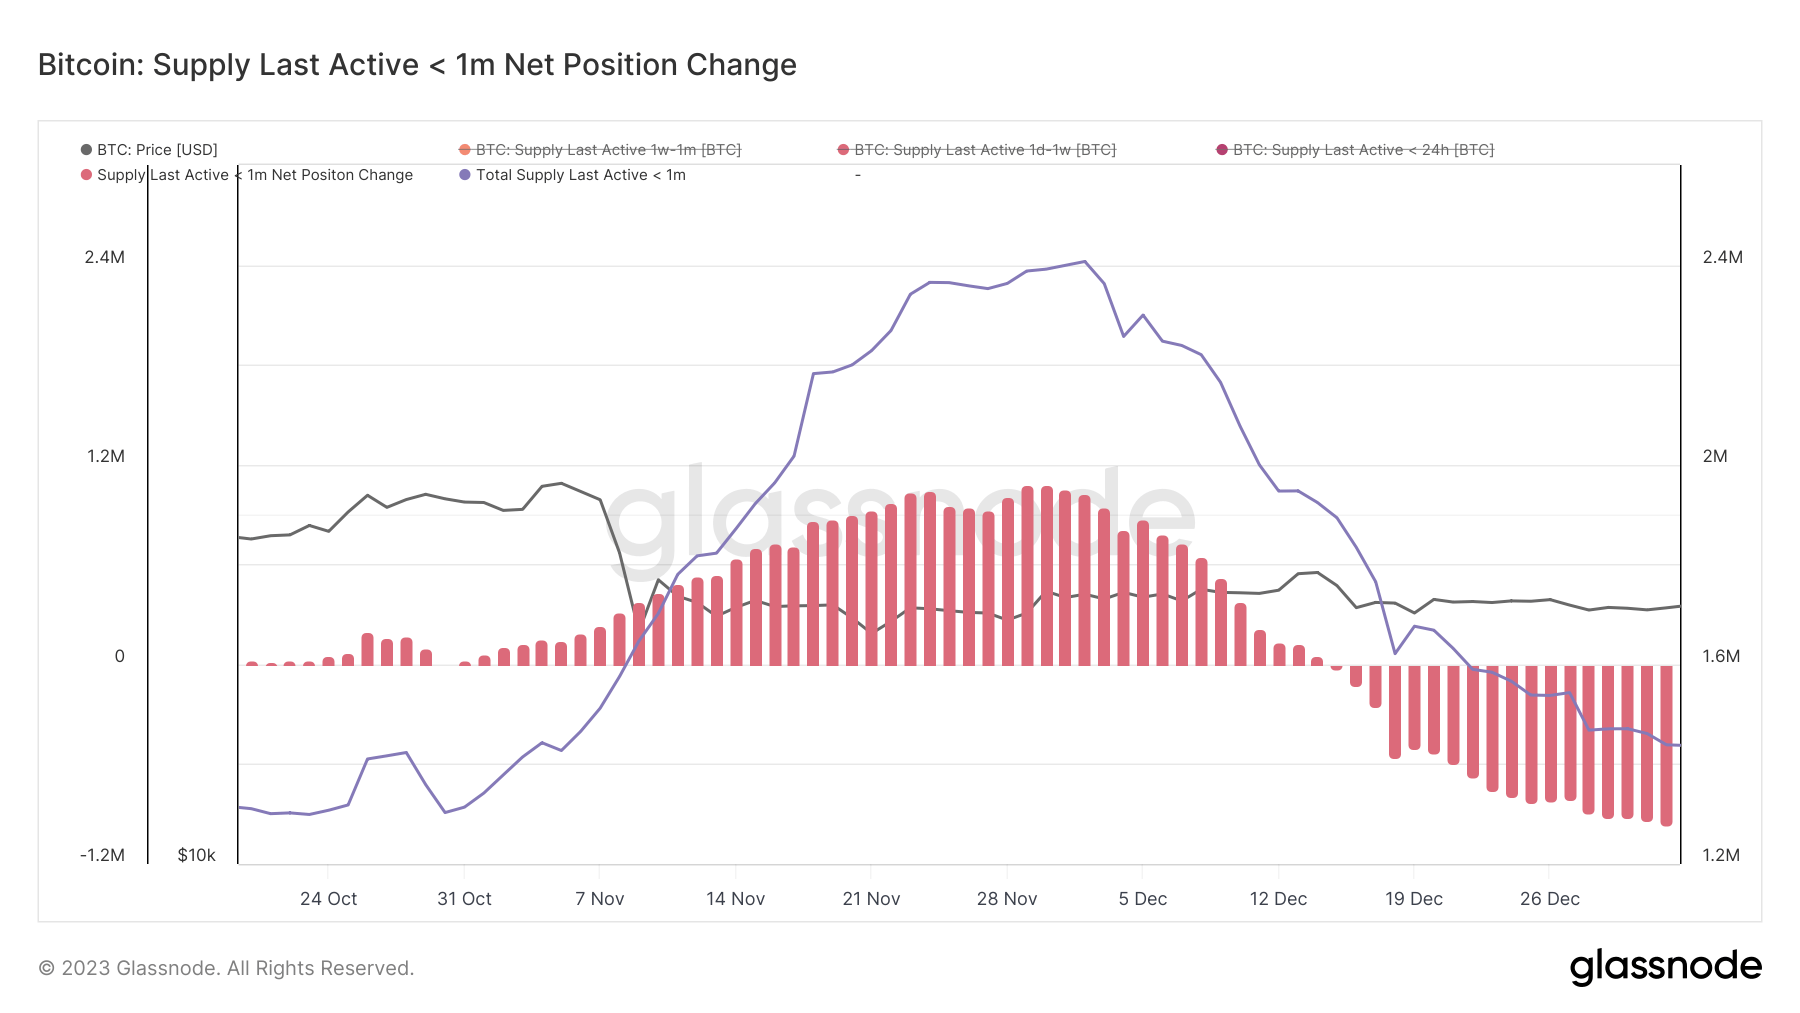 Graph showing the total supply of Bitcoin last active less than a month ago from October 2022 to December 2022 (Source: Glassnode)
The surge in hot coins during this period suggests potential panic selling and a rush to withdraw funds from FTX and related platforms, resulting in a sharp increase in activity. As the price continued to decline despite the rise in supply movement, it may indicate a prevailing negative sentiment and a lack of confidence in the market at that time.
The post Bitcoin’s most active supply hits 8-year low appeared first on CryptoSlate.