Disclaimer: Information found on CryptoreNews is those of writers quoted. It does not represent the opinions of CryptoreNews on whether to sell, buy or hold any investments. You are advised to conduct your own research before making any investment decisions. Use provided information at your own risk.
CryptoreNews covers fintech, blockchain and Bitcoin bringing you the latest crypto news and analyses on the future of money.
This year, the Stablecoin Supply Ratio (SSR) has exhibited notable trends, providing valuable insights into Bitcoin’s market dynamics. The SSR, determined by dividing Bitcoin’s market capitalization by that of major stablecoins, serves as an indicator of the relative financial robustness and purchasing power of stablecoins in comparison to Bitcoin.
A significant rise in SSR has been noted this year, with the ratio increasing from 2.36 on January 1 to 6.74 by December 14. This escalation suggests a growing Bitcoin market cap relative to stablecoins, indicating changes in market liquidity and investor preferences.
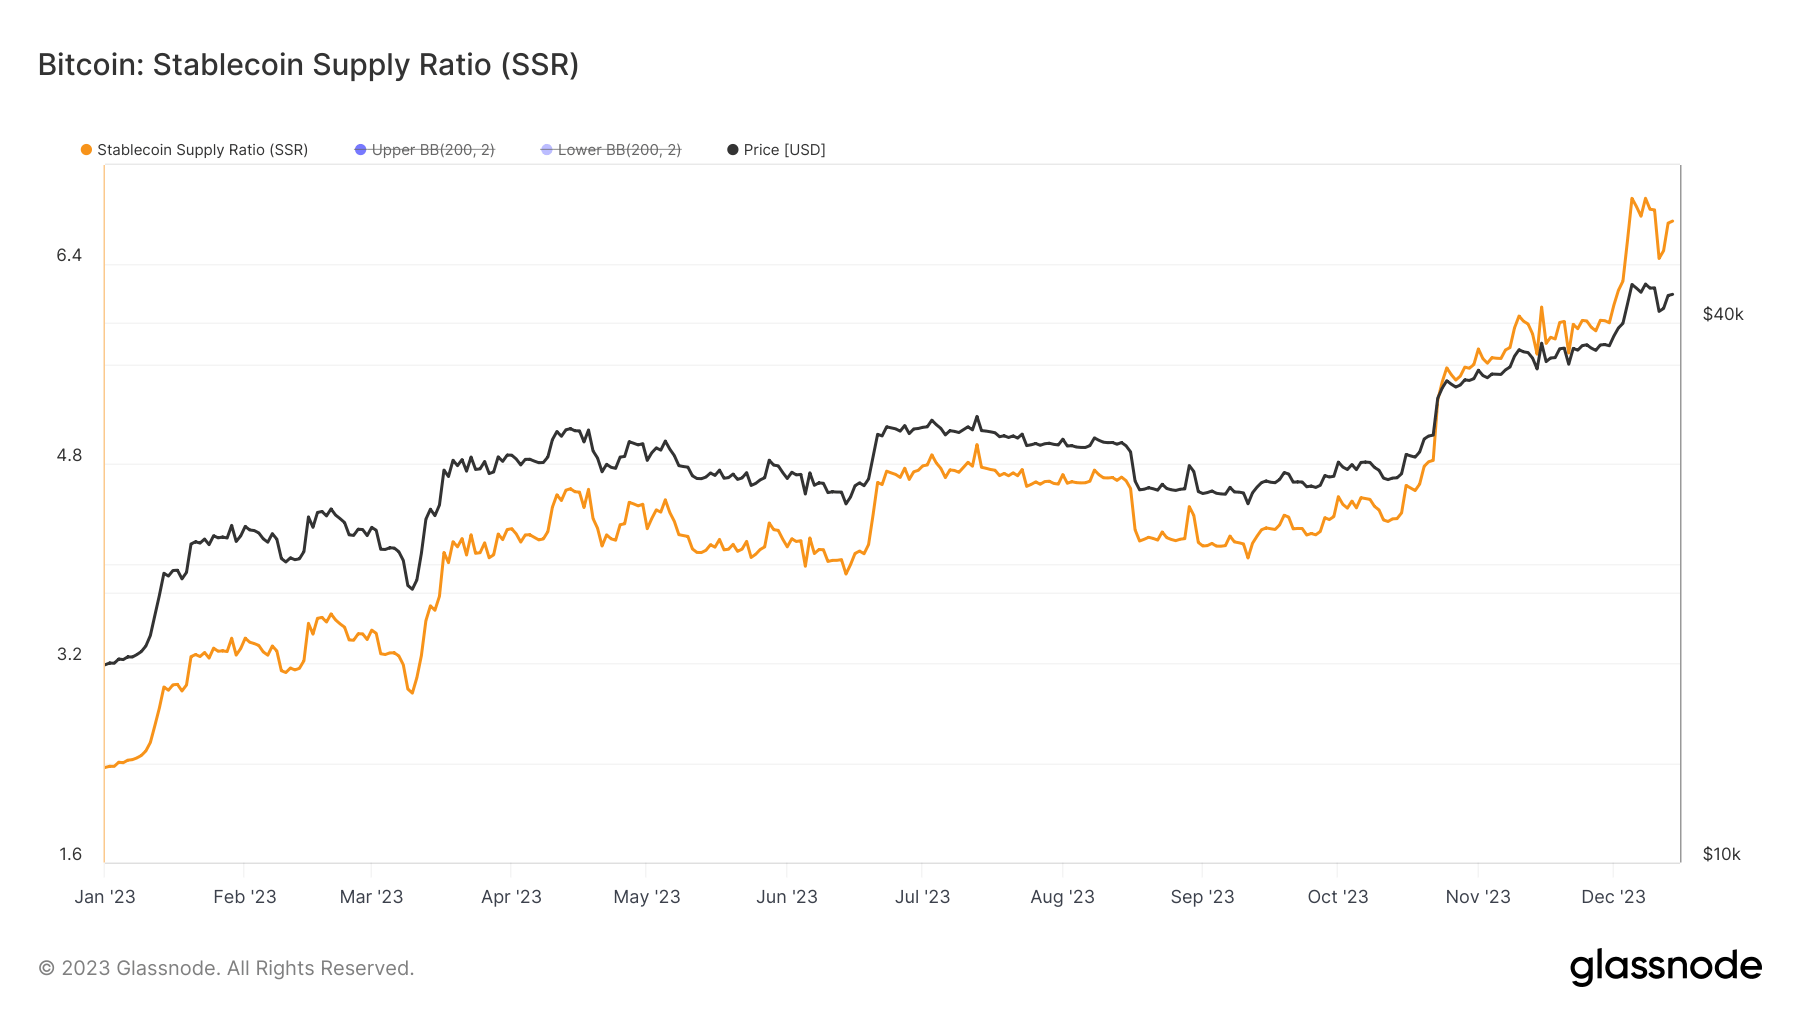 Graph illustrating the Stablecoin Supply Ratio (SSR) in 2023 (Source: Glassnode)
To thoroughly comprehend these trends, it is essential to analyze the SSR in conjunction with Bollinger Bands. Bollinger Bands consist of a series of trend lines plotted two standard deviations (both positively and negatively) from a simple moving average (SMA) of a specific asset or metric. They assist in identifying the level of market volatility. When the SSR surpassed the upper Bollinger Band at 4.90 on October 23 and remained above it, it indicated an atypical market condition: Bitcoin’s market cap expanded significantly compared to stablecoins, suggesting a potential change in investor behavior or market sentiment.
A peak SSR of 6.93 on December 8 further emphasizes this trend, although the subsequent minor decline following Bitcoin’s price drop from $44,200 to $41,200 illustrates that as Bitcoin’s price varies, the relative strength and influence of stablecoins on the market adjust correspondingly, impacting the SSR.
Related Posts
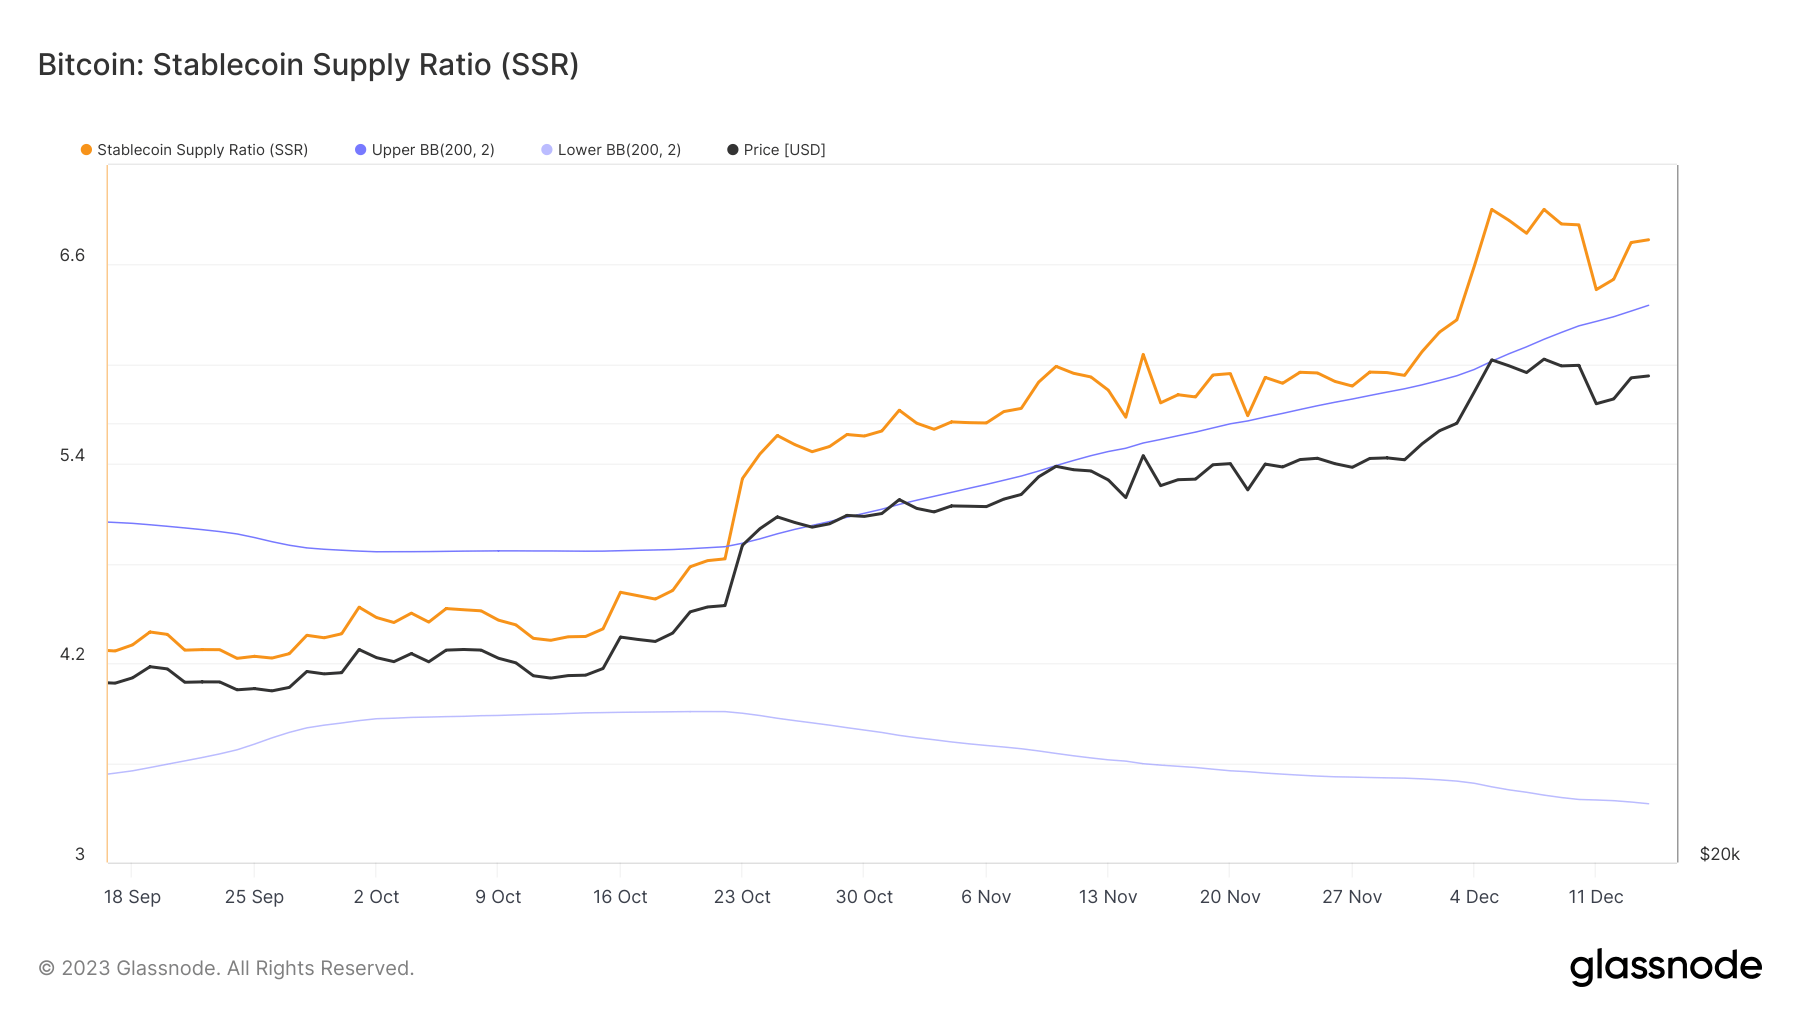 Graph depicting the Stablecoin Supply Ratio (SSR) within the Bollinger Bands from September 17 to December 14, 2023 (Source: Glassnode)
The Stablecoin Oscillator, a derivative of the SSR, monitors how the 200-day SMA of the SSR fluctuates within its Bollinger Bands, offering a more detailed perspective on market trends. Between December 8 and December 14, the oscillator decreased from 3.13 to 2.52 as Bitcoin’s price fell and partially rebounded. This reflects a balancing act between Bitcoin’s direct market performance and the comparative value and utility of stablecoins. As Bitcoin’s price shifts, it affects the SSR, which in turn influences the oscillator, underscoring the ongoing and intricate relationship between these two vital components of the cryptocurrency market.
The year-to-date (YTD) peak for the oscillator was recorded on October 25, reaching 4.13, in contrast to a YTD low of -1 at the start of the year. The oscillator’s YTD high and low points illustrate the market’s evolving sentiment and the changing role of stablecoins in relation to Bitcoin.
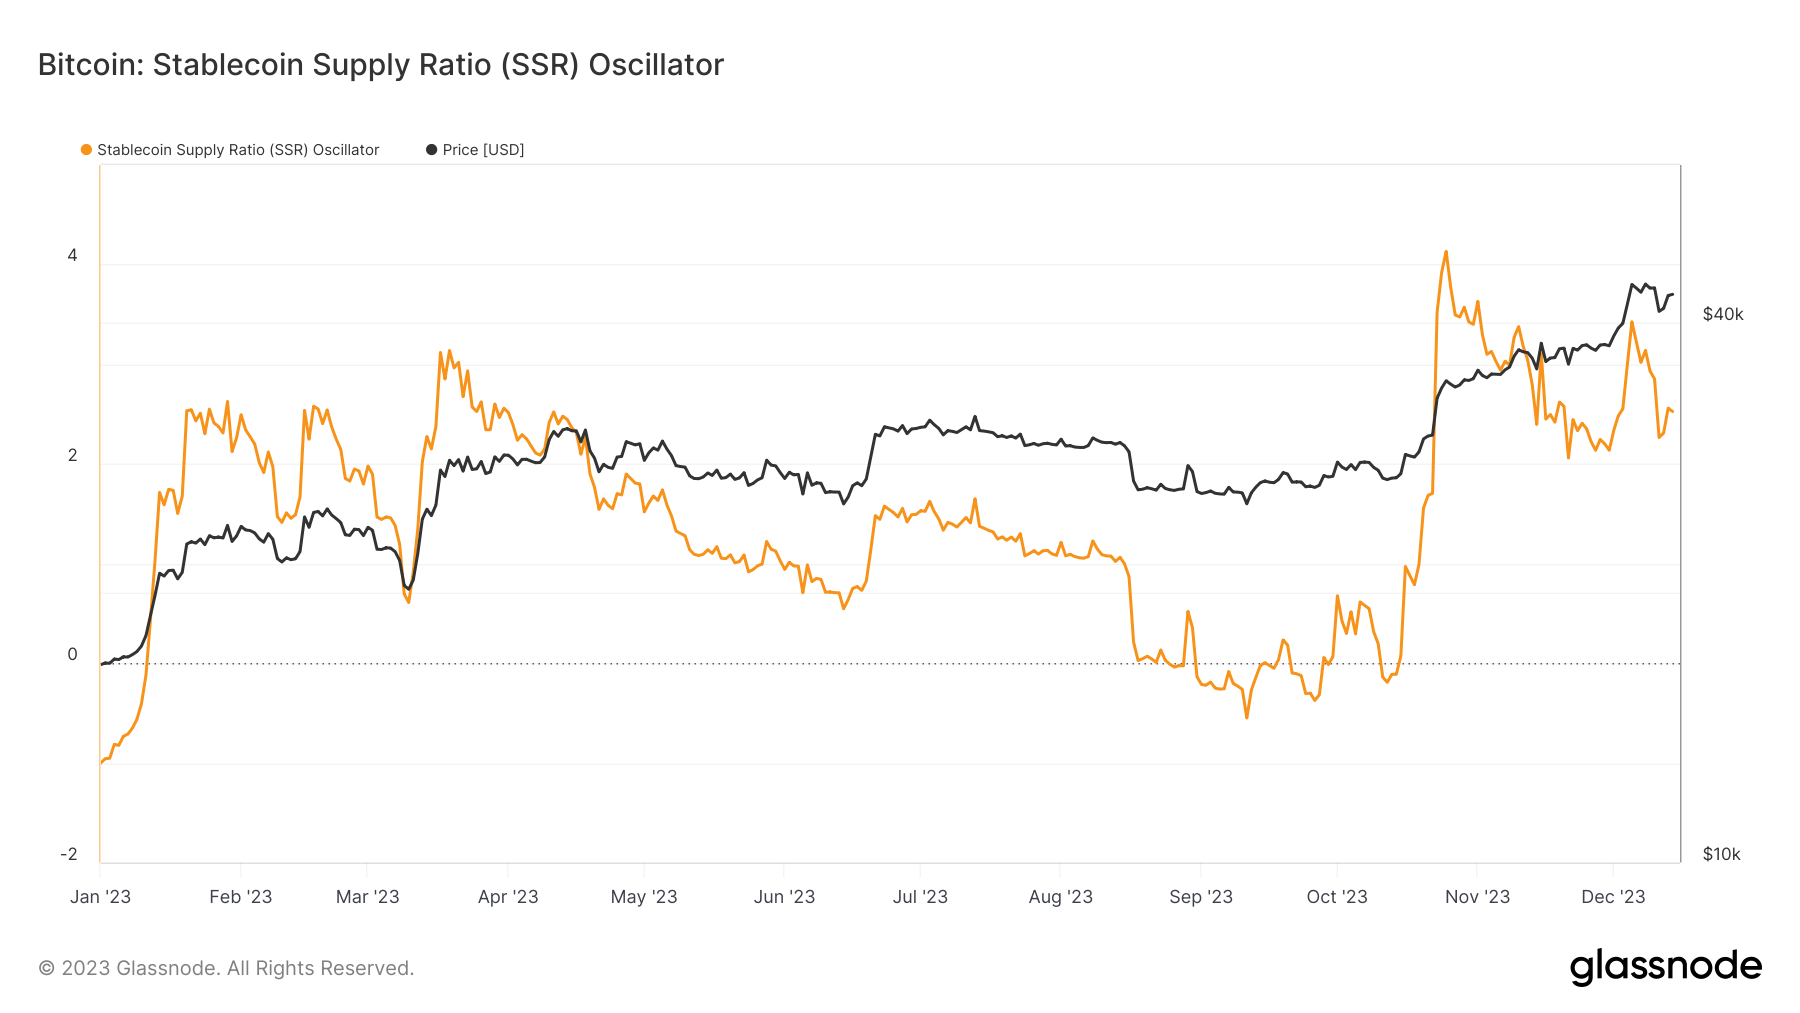 Graph showing the Stablecoin Supply Ratio (SSR) Oscillator in 2023 (Source: Glassnode)
An increasing SSR, particularly alongside a rising Bitcoin price, indicates a diversified investment environment. The growth of Bitcoin’s market cap outpacing that of stablecoins may be influenced by various factors, including direct fiat investments, conversions from stablecoins to Bitcoin, and speculative trading where stablecoins are held as a hedge while Bitcoin is actively traded.
The post Bitcoin outpaces stablecoins in market cap growth appeared first on CryptoSlate.