Disclaimer: Information found on CryptoreNews is those of writers quoted. It does not represent the opinions of CryptoreNews on whether to sell, buy or hold any investments. You are advised to conduct your own research before making any investment decisions. Use provided information at your own risk.
CryptoreNews covers fintech, blockchain and Bitcoin bringing you the latest crypto news and analyses on the future of money.
Bitcoin long-term investors have ceased selling, yet a flawed chart signal conceals the reality.
There exists a specific type of Bitcoin holder who only appears when the commotion escalates.
These are the individuals who witnessed the transition from 2021 to 2022, who retained their keys regardless, and who adapted to the notion that the chart’s trajectory can plummet more swiftly than their spirits. When the price surges upward, they are regarded as seers. When it declines, they are seen as antagonists.
In recent weeks, the narrative of the villain has been prevalent, suggesting that long-term holders are selling off, seasoned investors are cashing out, and the cycle is concluding. This narrative resonates emotionally; it provides a straightforward explanation for a chaotic market.
The issue is that the blockchain seldom provides clear answers, particularly when significant custodians shuffle their assets.
On-chain analysts like Darkfrost have been monitoring “LTH supply change,” which essentially tracks whether coins that have remained inactive for months are beginning to circulate.
They perceive the sell-off nearing its end, as evidenced by the appearance of the first small green candle since mid-July. CryptoQuant founder Ki Young Ju pointed out the cessation of long-term holder sell pressure on X, but can we be certain?
The data was rattled by a massive Coinbase maneuver
In late November, Coinbase transferred substantial amounts of cryptocurrency between internal wallets as part of a scheduled migration. Coinbase stated that these transfers were planned, unrelated to a security breach, and intended to rotate older internal wallets into newer ones as a security measure, with no effect on customer deposits or product availability.
This is significant because internal wallet migrations can resemble actual selling on-chain; coins shift, their age resets, dashboards illuminate, and individuals begin to form conclusions.
It represents movement without a change in ownership.
Thus, when analysts claim they have “fixed” long-term holder data by isolating the Coinbase phenomenon, they aim to eliminate a substantial operational imprint from the chart.
Current insights from the long-term holder signal
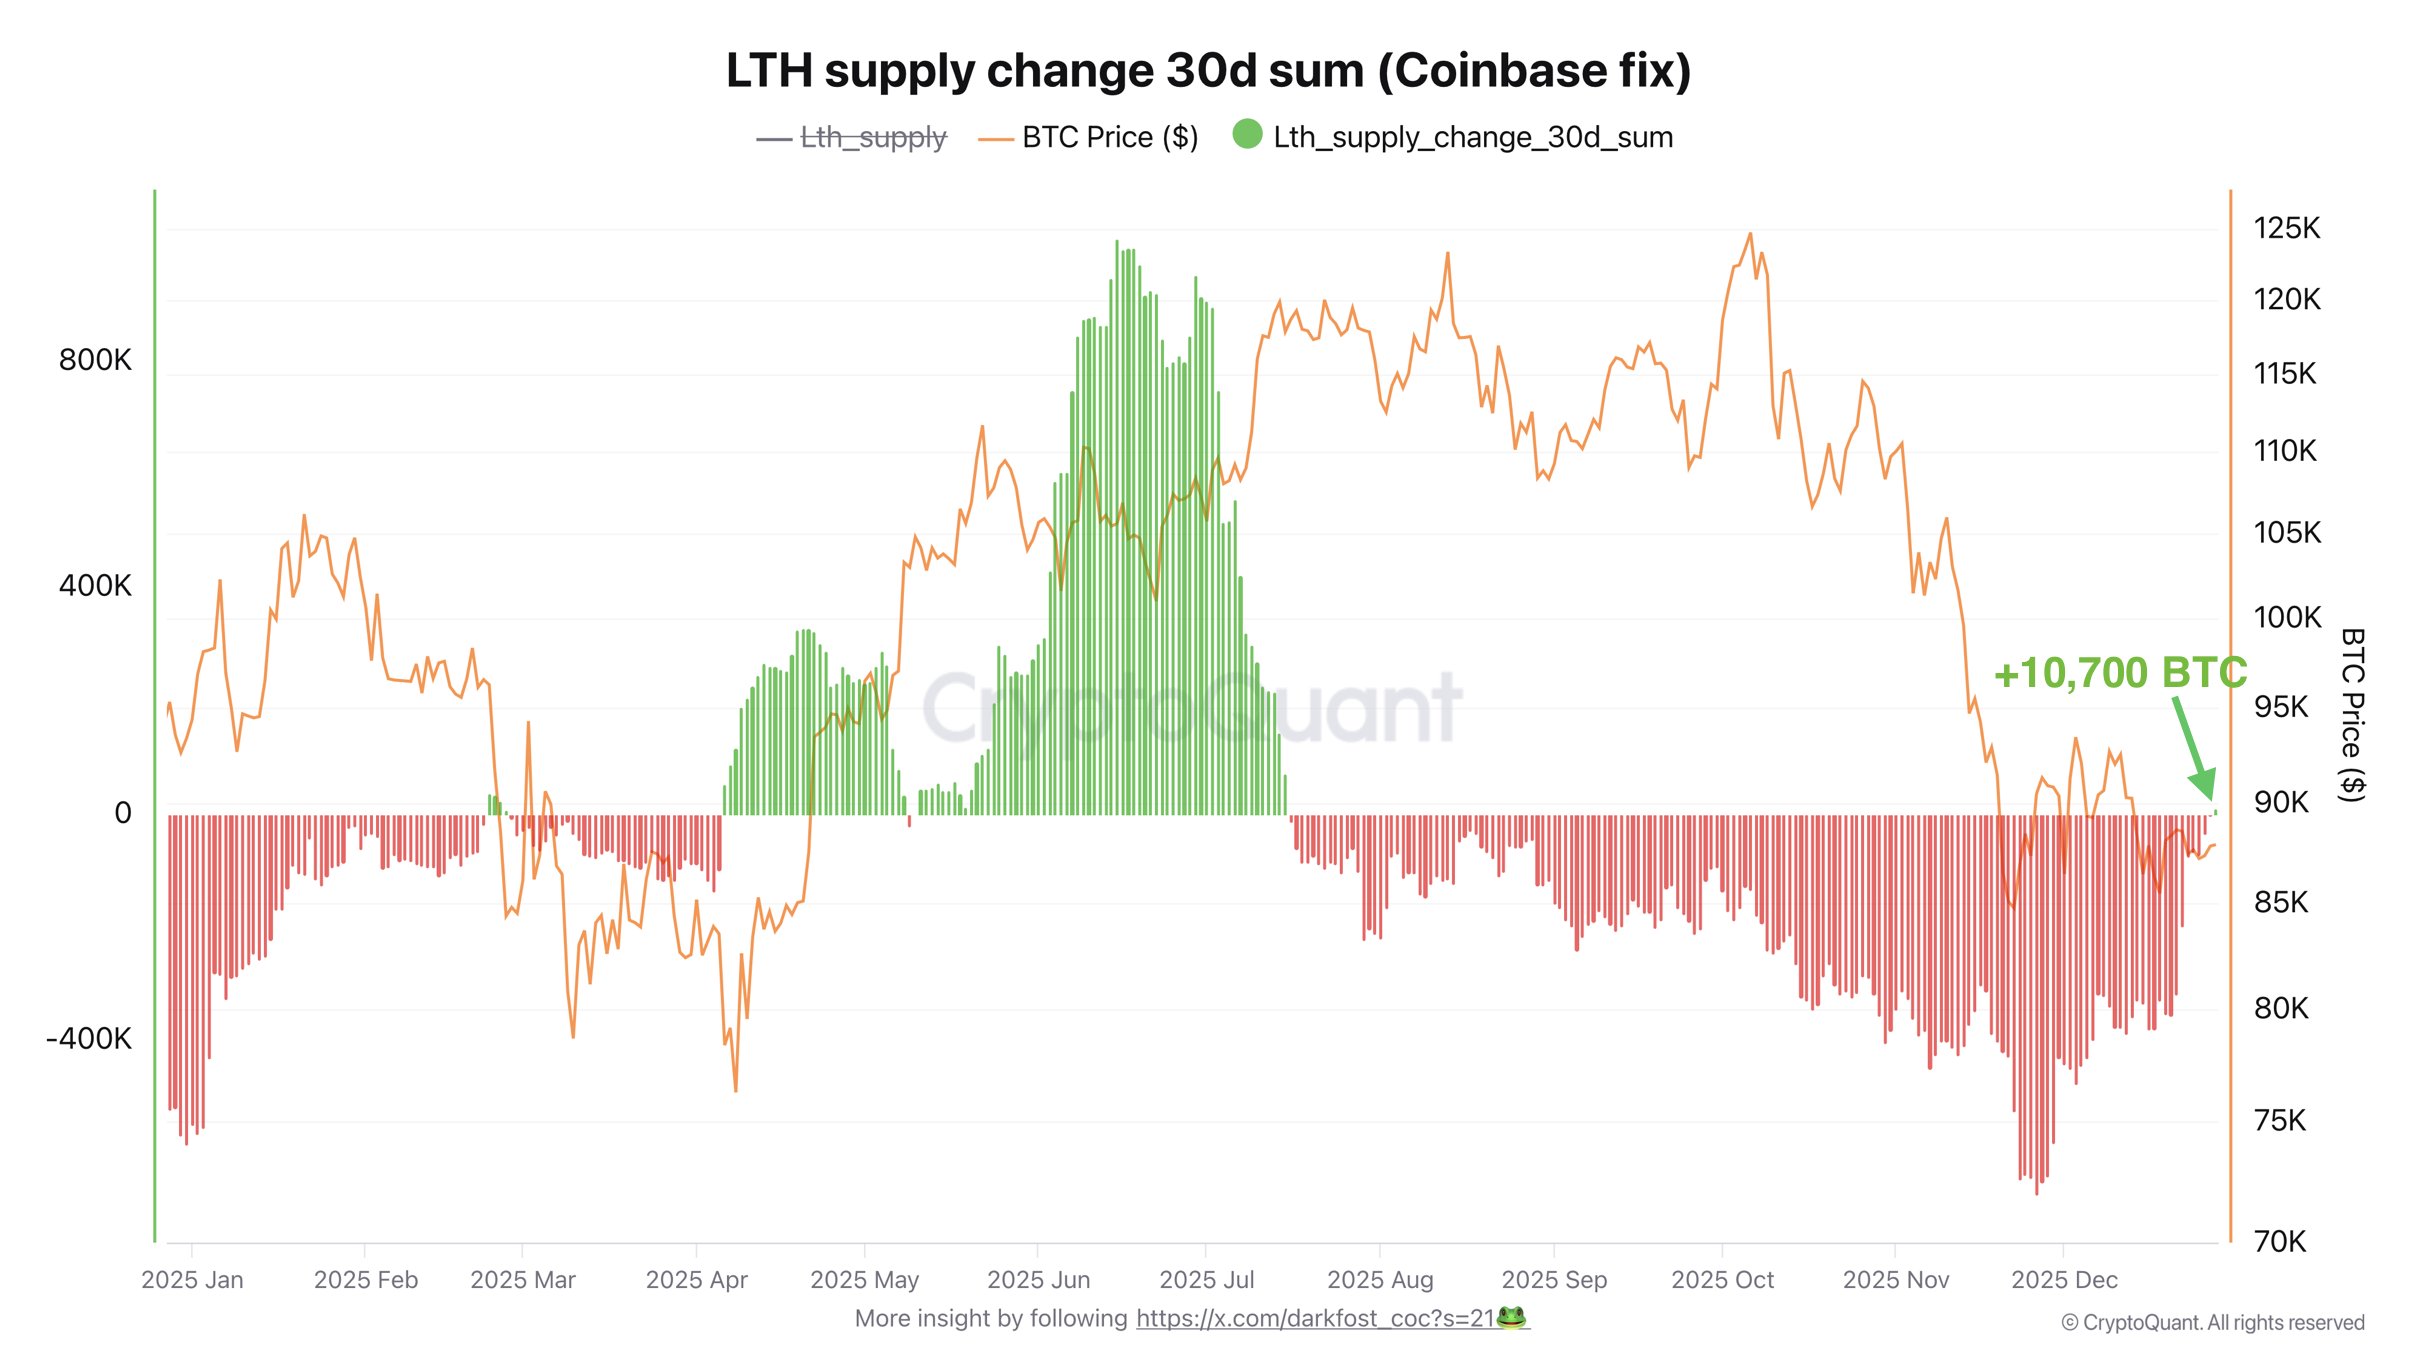 Bitcoin long-term holder supply change (Source: CryptoQuant)
The most prudent takeaway from the modified charts circulating is straightforward: long-term holders seem to be pulling back on selling, and the change is slight.
This aligns with the broader notion that the market is attempting to establish a floor, but the validation is still weak. Even Glassnode, which employs an entity-adjusted cohort model and defines long-term holders using the ~155-day threshold, describes long-term holders as “heavy net distributors” at approximately 104K BTC per month in late October, as noted in its Week On-Chain report, Lacking Conviction.
The same report also emphasizes a crucial point that traders often overlook during a downturn: significant expansions in Bitcoin’s history have typically commenced after long-term holders transition from distribution to sustained accumulation, a regime change that requires time to manifest.
Glassnode’s definitions and methodologies are important here as well. Their documentation clarifies that the LTH, STH split centers around 155 days, and that the metric suite is entity-adjusted rather than a simple address count.
Consequently, the best interpretation of today’s “LTH ceased selling” narrative is as an initial nudge, not a celebration.
Even if long-term holders ease off, ETF flows can still influence the week
Related Posts
There is a secondary reality overlaying on-chain behavior now; ETFs have transformed Bitcoin into something akin to a daily mood indicator for risk appetite.
A single significant ETF day can overshadow a modest change in long-term holder behavior, like the approximately $523 million one-day outflow from BlackRock’s iShares Bitcoin Trust, IBIT, in November.
These flows do not equate to an old holder selling coins, yet they impact the same market, at the same time, within the same order book. That’s why Bitcoin can appear calm on-chain and still behave like a jittery tech stock.
The macro landscape is changing, but it’s not yet “easy mode”
Bitcoin’s most substantial rallies tend to occur when liquidity is increasing, and buyers feel secure in taking risks. This is why the Federal Reserve frequently appears in crypto discussions, even when it’s unwelcome.
In December, the Fed lowered its target range by 25 basis points to 3.5% to 3.75%. Around the same time, the New York Fed announced it would begin acquiring Treasury bills under its reserve management program, with the first schedule amounting to about $40 billion and purchases commencing on Dec. 12.
 Related Reading
Bitcoin flashes rare liquidity warning because the Fed’s $40 billion “stimulus” is actually a trap
Expectations for rate cuts diminish as Bitcoin’s market recalibration triggers a spot-driven decline.
Dec 12, 2025 · Oluwapelumi Adejumo
These are foundational moves; they help clarify why risk markets can stabilize even when sentiment is battered, and why the upcoming months may depend on whether buyers consistently re-enter the market.
Three potential paths from here, and what would confirm each one
- A genuine reset, followed by recovery.
Long-term holder selling continues to diminish; this trend persists for weeks, ETF flows halt their decline and turn mixed to positive, and volatility subsides. In this scenario, Bitcoin often does what it does best: it initially bores people, then it moves. - A broad, exasperating range.
Long-term holders cut back on selling but do not engage in sustained accumulation. ETFs remain volatile, and macro news continues to sway the market’s sentiment. This scenario sees Bitcoin spending more time restoring confidence than achieving new highs. - Distribution reemerges, and the market tests patience once more.
If long-term holder distribution increases again, and ETFs experience another round of significant outflows, the price may remain under pressure. Glassnode’s Week On-Chain analysis points to crucial cost basis levels and highlights how overhead supply can limit rallies when conviction is lacking, as noted in Lacking Conviction.
The human aspect of the chart
For those who have held through multiple market cycles, the most significant change is seldom the one-day price movement. It is the moment when the desire to sell diminishes, and the willingness to wait returns.
If long-term holders genuinely withdraw from distribution, the market becomes slightly less fragile. This does not guarantee higher prices in the following week, does not shield anyone from a macro shock, and does not negate the influence of ETF flows.
It brings about something more subtle.
It alters who is prepared to be the marginal seller, and in Bitcoin, that is frequently how the next chapter begins.
The post Bitcoin long-term holders just stopped selling, but a broken chart signal hides the truth appeared first on CryptoSlate.