Disclaimer: Information found on CryptoreNews is those of writers quoted. It does not represent the opinions of CryptoreNews on whether to sell, buy or hold any investments. You are advised to conduct your own research before making any investment decisions. Use provided information at your own risk.
CryptoreNews covers fintech, blockchain and Bitcoin bringing you the latest crypto news and analyses on the future of money.
Bitcoin diverges from M2 liquidity pattern as dollar strength surpasses worldwide monetary expansion.
Bitcoin is no longer reacting to increasing global liquidity in the same manner as it did during the previous cycle. Despite the expansion of the money supply, a stronger dollar is tightening financial conditions more rapidly than liquidity can elevate prices.
Bitcoin traders have a particular affinity for one chart: global M2 liquidity adjusted for time lag.
Eventually, the increase in money circulating globally finds its way into risk assets, with Bitcoin benefiting from this trend. For certain periods in the last cycle, this perspective appeared straightforward enough to be considered a rule.
However, this perspective is currently facing challenges. While broad money continues to rise, Bitcoin is behaving like an asset constrained by a macroeconomic ceiling.
Why this is significant: This indicates a change in how macroeconomic signals are influencing crypto markets. The mere expansion of liquidity is no longer sufficient to drive prices in the short term, as more immediate factors such as dollar strength and interest rate expectations are taking precedence.
For investors, this alters the interpretation of Bitcoin: it should be viewed less as a straightforward liquidity proxy and more as a market responding to competing macroeconomic dynamics.
According to FRED data, US M2 stood at $22.667 trillion in February, an increase from $22.469 trillion in January and $22.387 trillion in December.
These figures illustrate a distinctly expansionary environment, while a Bitcoin price near $68,000 indicates a different scenario altogether.
Traders are merging two separate macro transmission speeds into a single chart and anticipating a neat outcome.
Two clocks, one price
M2 serves as a monthly stock measure. It accumulates gradually over quarters, and its impact on risk assets is similarly slow.
When liquidity conditions improve, it generally eases financial conditions broadly, reducing hurdle rates, increasing credit availability, and directing capital toward riskier investments.
However, this process requires months to fully reflect in prices.
In contrast, dollar strength operates on a completely different timeline. When the dollar index rises, financial conditions tighten almost instantaneously.
The Federal Reserve’s own minutes clarify this: a stronger dollar, combined with higher yields and lower equity prices, collectively tightens financial conditions.
Research from the BIS corroborates this transmission, and analysis from the IMF indicates that a 10% appreciation of the dollar linked to global financial market dynamics results in a 1.9% reduction in output in emerging markets within a year, negatively impacting credit availability and capital inflows.
March exemplified this hierarchy. The dollar index recorded a 2.35% monthly increase and a 1.7% quarterly rise, marking its best quarter since late 2024, driven by safe-haven demand, the conflict in Iran, oil shocks, and a significant repricing of Fed rate-cut expectations that drew investors back to the dollar.
From its four-year low in late January, the dollar index had already rebounded by approximately 5% by mid-March.
During the same period, US M2 increased by about 1.25%. The tightening occurred roughly four times faster than the liquidity expansion.
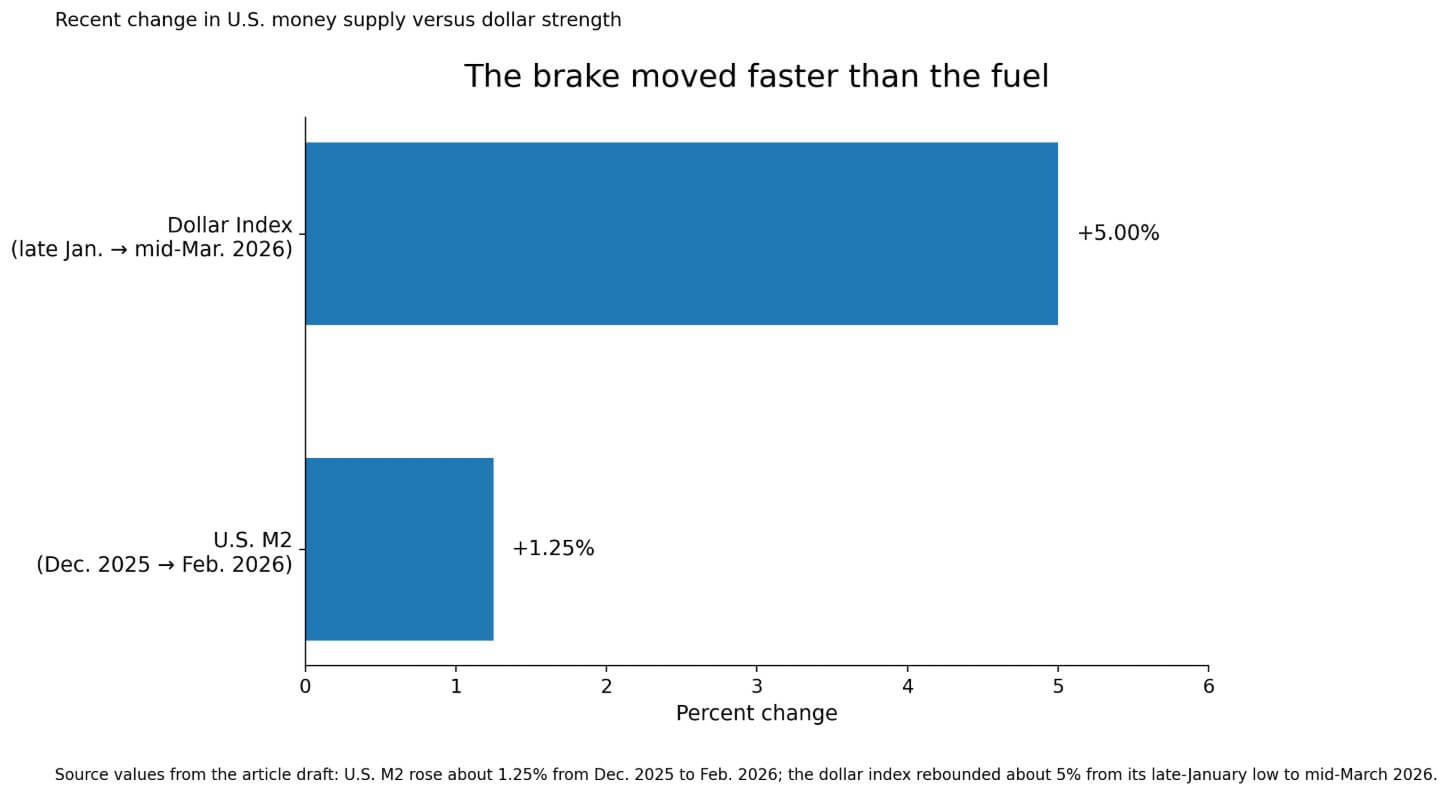 A bar chart illustrates that the dollar index gained 5% from late January to mid-March 2026, compared to a 1.25% rise in U.S. M2 during the same timeframe.
The key shift is not that liquidity has ceased to expand, but rather that it is being outpaced by faster tightening forces. Bitcoin is responding to the rate of change, not just its direction.
Why Bitcoin absorbs dollar moves first
Related Posts
Bitcoin occupies a unique position among risk assets. It trades continuously across global platforms, is priced against dollars and dollar equivalents, and attracts a worldwide investor base, which makes dollar-denominated return assessments.
This characteristic allows it to be one of the quickest markets to respond to dollar tightening before the slow accumulation of M2 can filter through credit channels, capital flows, and overall risk appetite.
The oil shock exacerbates this situation, as commodity surveys in March revised the 2026 Brent forecast upward to $82.85 per barrel from $63.85 the previous month, marking the steepest upward adjustment in the survey’s history, and warned that Brent could reach $190 if the Strait of Hormuz remains closed.
An oil shock of this magnitude raises inflation expectations, compelling markets to eliminate rate cuts from their pricing. The market shifted from anticipating at least 50 basis points of Fed easing by December to barely pricing in a quarter-point cut.
This repricing occurs in dollar and rate markets within days, while the M2 data for the corresponding period will not be released for another month.
A more nuanced point reinforces this. Most widely used “global M2” charts aggregate foreign money stocks and convert them into dollars, meaning that exchange-rate fluctuations inherently influence the composite.
| Variable | Transmission speed | Effect on Bitcoin |
|---|---|---|
| M2 / broad liquidity | Slow, accumulates over months | Acts as a background tailwind for risk appetite |
| Dollar strength | Fast, reprices in days or weeks | Tightens financial conditions quickly and pressures BTC |
| Oil / Fed repricing | Very fast | Reinforces dollar strength and delays liquidity expression |
When the dollar appreciates, it compresses the dollar value of foreign-currency aggregates even while local-currency measures remain stable.
As noted by one data provider, exchange rate variations can similarly impact overall liquidity and should be considered alongside raw money-supply figures.
The dollar thus operates on two levels: as a competing variable alongside the M2 chart, and as a variable that is already included in the composite calculation.
Dollar strength can simultaneously slow the ascent of the chart and diminish the significance of the chart’s direction for Bitcoin.
What the M2 thesis actually conveys
All of this refines the M2 thesis. Broad money serves as a valuable proxy for underlying liquidity conditions over multi-month periods, especially when the dollar is stable or declining.
In such scenarios, the gradual buildup of the money supply can act as a slow tailwind for risk assets, with Bitcoin being one of the more responsive beneficiaries.
The relationship appears clearer in calmer macroeconomic environments precisely because the fast variable, the dollar, is moving in the same direction, or at least not obstructing the trend.
The current situation confirms this hierarchy: when dollar strength and risk aversion dominate the short-term landscape, they can keep Bitcoin significantly below where a rising M2 line alone would suggest it should be.
The bullish argument is that the dollar’s surge in March is temporary. If geopolitical tensions ease, oil prices decline from their peaks, and markets begin to reprice some Fed easing, the dollar’s tightening effect will diminish rapidly.
Some strategists view part of the March dollar movement as a risk premium that could dissipate if conditions stabilize. In that scenario, the underlying M2 tailwind would reassert itself in the coming months, Bitcoin’s divergence from the liquidity chart would close, and those traders who deemed the M2 thesis invalid may appear premature.
| Scenario | What changes | What it means for Bitcoin |
|---|---|---|
| Bull case: dollar surge fades | Geopolitical tensions ease, oil prices decline, some Fed easing is repriced back in | M2 tailwind reasserts itself and BTC can close the gap with the liquidity chart |
| Bear case: dollar maintains dominance | Oil prices, risk aversion, and cross-asset volatility remain high | BTC may continue to diverge from the M2 narrative longer than liquidity observers anticipate |
The bearish scenario involves the dollar extending its dominance. HSBC strategists indicated that the dollar retains the upper hand as long as oil prices, risk aversion, and cross-asset volatility remain elevated.
In this case, Bitcoin could continue to diverge from the M2 narrative longer than most liquidity analysts expect. Each month of high oil prices and constrained rate-cut expectations postpones the moment when background money growth can translate into market performance.
The next challenge is whether the dollar’s momentum falters before liquidity can catch up. If the dollar stabilizes or reverses, Bitcoin has the potential to realign with the underlying growth in the money supply. If not, the divergence may persist longer than liquidity models suggest, requiring traders to reassess what truly influences price in the current cycle.
The post Bitcoin breaks from M2 liquidity trend as dollar strength overrides global money growth appeared first on CryptoSlate.