Disclaimer: Information found on CryptoreNews is those of writers quoted. It does not represent the opinions of CryptoreNews on whether to sell, buy or hold any investments. You are advised to conduct your own research before making any investment decisions. Use provided information at your own risk.
CryptoreNews covers fintech, blockchain and Bitcoin bringing you the latest crypto news and analyses on the future of money.
Bitcoin confronts potential $45,000 sell-off trigger as Powell and employment report pose new macroeconomic challenges.
The price of Bitcoin is entering a crucial week, with various on-chain models indicating a decline in the market’s floor as investors prepare for new insights from the Federal Reserve and the US labor market.
This change has intensified discussions that now focus not only on how far the leading digital asset might drop but also on the duration of the recovery process, even as the most severe selling appears to be nearing its limit.
Data from Alphractal reveals that the realized price bands for Bitcoin’s short-term holders have significantly decreased in recent weeks, lowering a level that traders monitor for indications of capitulation.
Joao Wedson, the company’s CEO, noted that previous cycles often concluded a capitulation event when Bitcoin neared the lower blue band, presenting a strong local buying opportunity. With that band now positioned lower, the model suggests a potential bottom around $50,000 or just below.
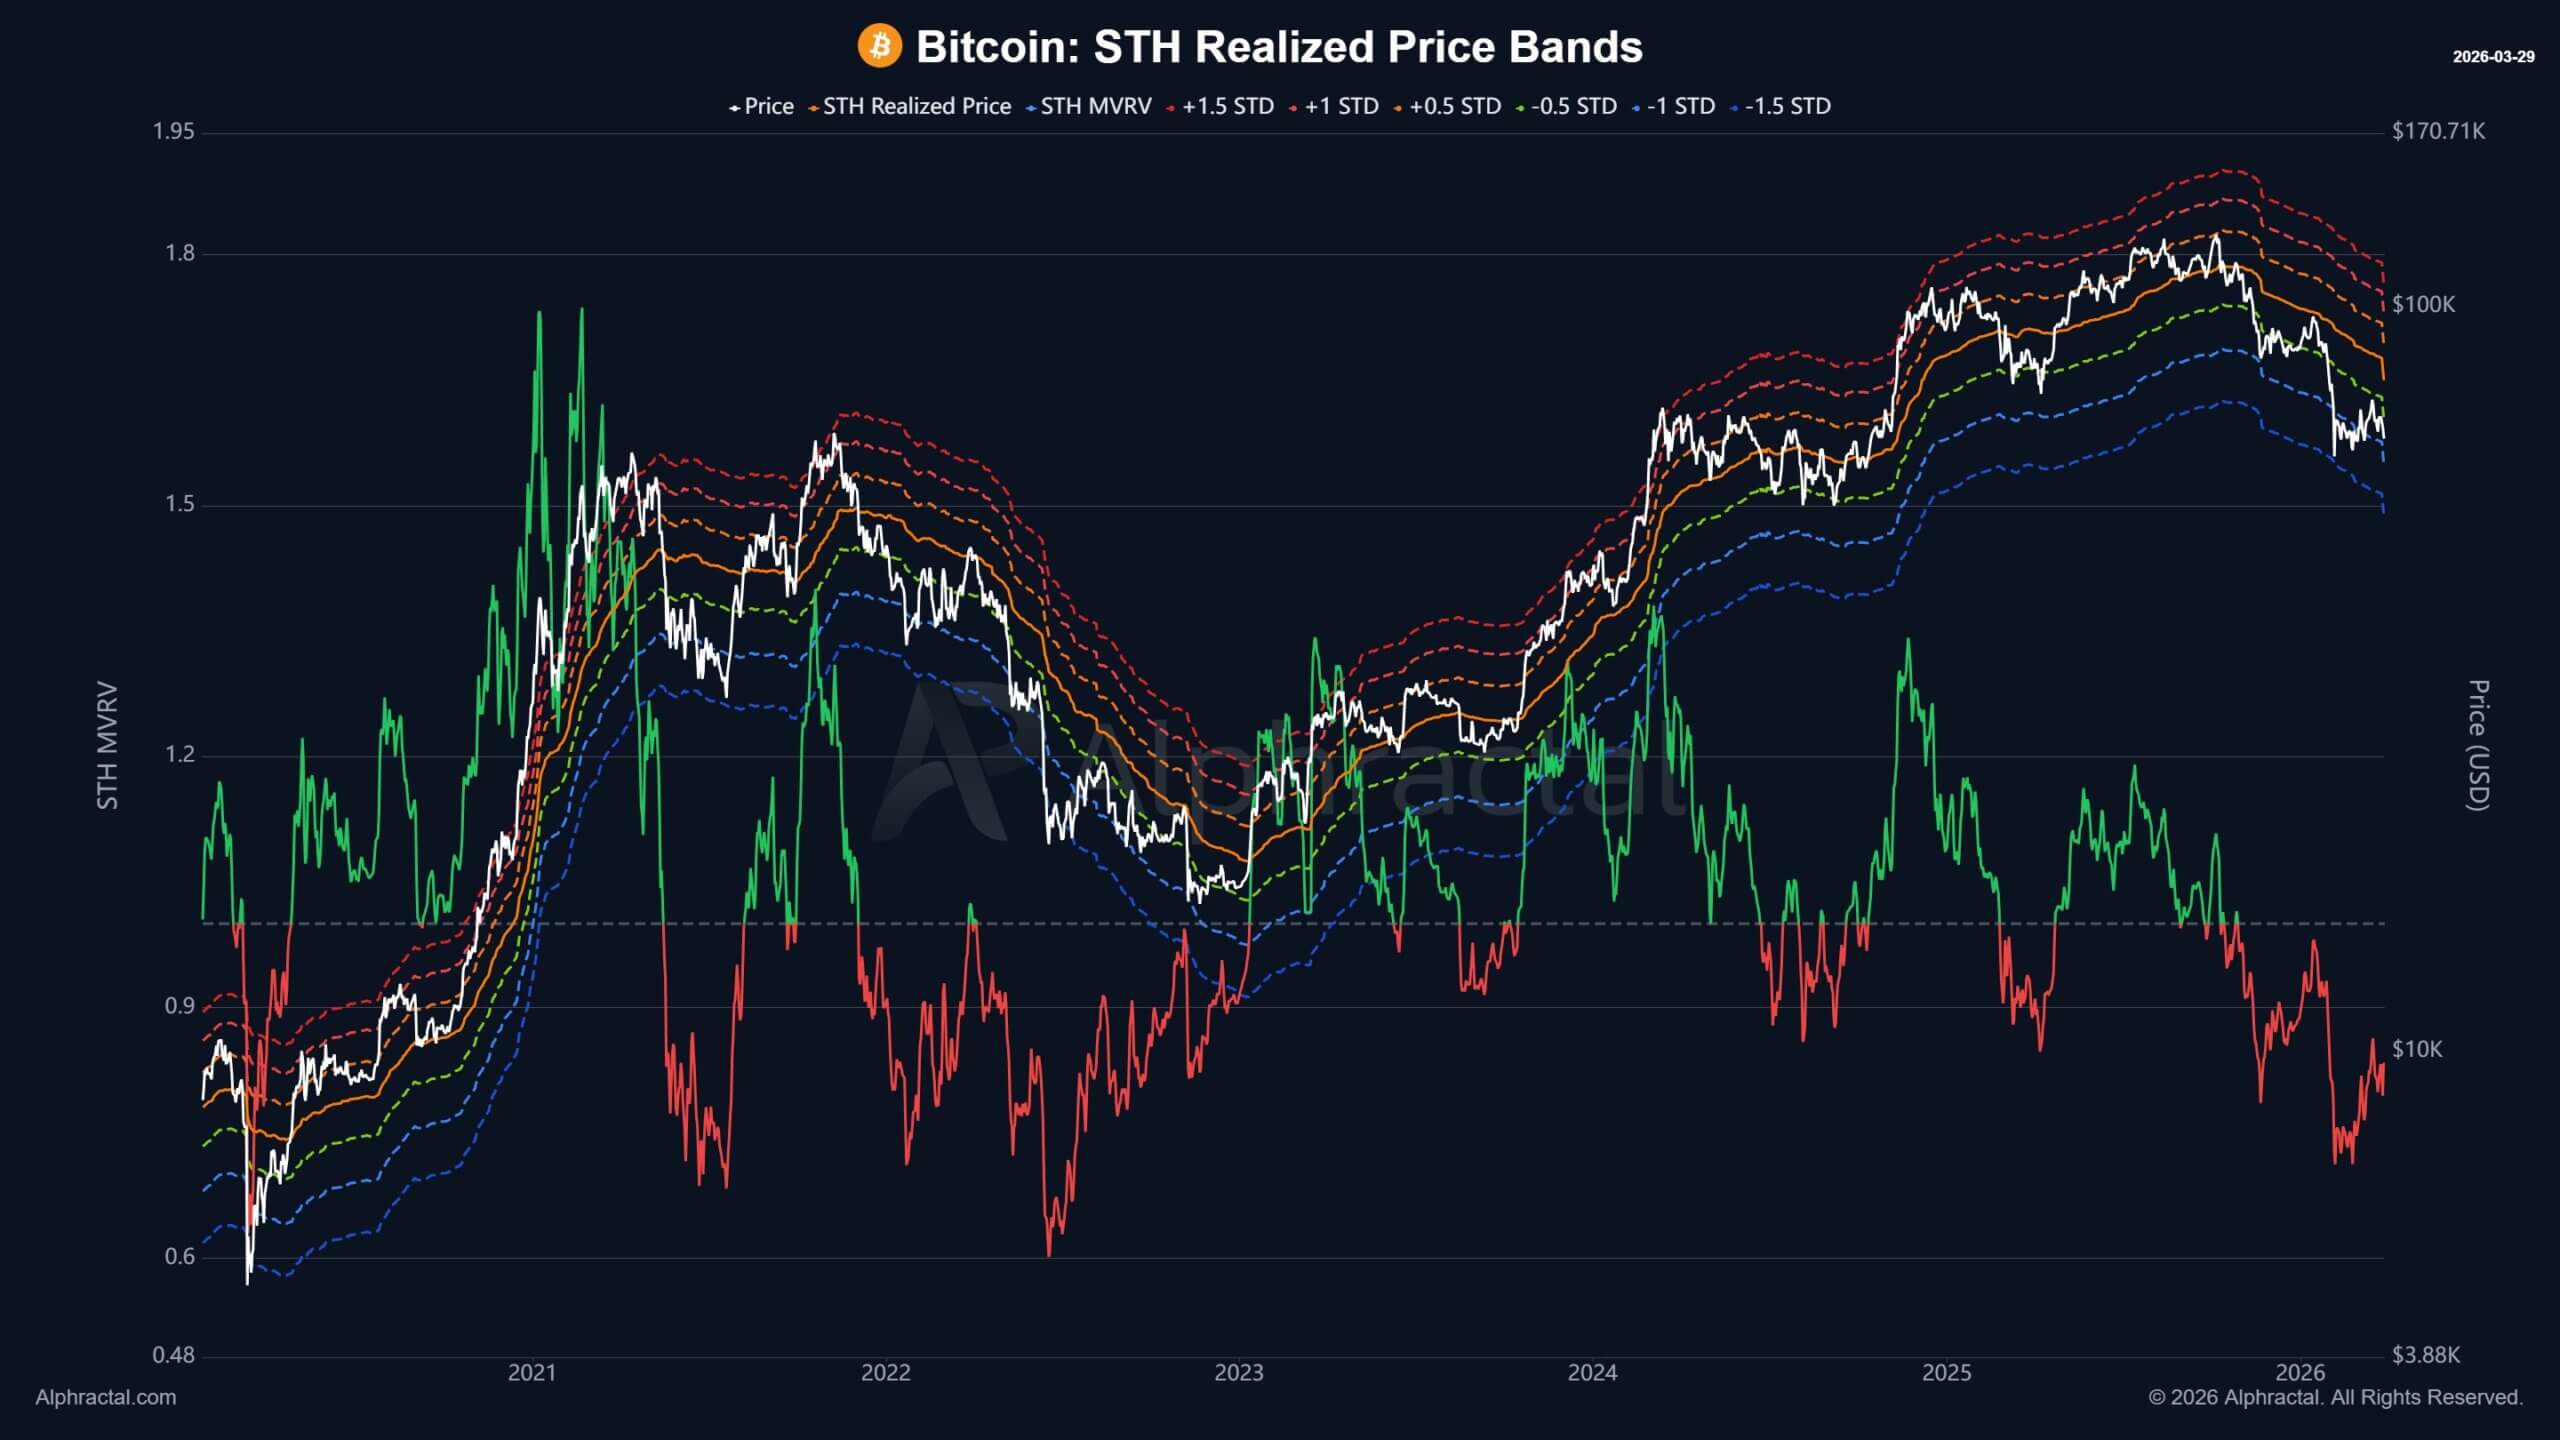 Bitcoin Short-Term Holders Realized Price Bands (Source: Alphractal)
At the same time, other prominent on-chain indicators are converging in a similar range. Willy Woo has indicated that Bitcoin could find a bottom between $46,000 and $54,000, while the CVDD floor is situated near $45,500 and continues to gradually increase.
Collectively, these metrics imply that the area where value-oriented buyers may start to enter has shifted lower amid rising volatility and uncertainty.
 Related Reading
Bitcoin price is heading for weekend collapse to $61k – will a social media post from Trump save it?
Bitcoin could test $61,700 this weekend unless Trump provides another message to calm the market.
Mar 27, 2026 · Liam 'Akiba' Wright
Support is forming, but stress is still building
Glassnode’s cost-basis data indicates a market still attempting to establish support at higher levels.
The firm reports that Bitcoin is trading near the lower end of the $60,000 to $70,000 range, where newer buyers have accumulated supply, but the volume of that cluster remains less substantial than the bases that formed prior to stronger recoveries in earlier cycles.
Nonetheless, the underlying pressure has become increasingly difficult to overlook as BTC continues to face challenges.
CEX.io’s Bitcoin Impact Index reveals that over 30% of Bitcoin held by long-term holders is currently in the red, marking the highest proportion since 2023.
The firm noted that more than 4.6 million Bitcoin owned by long-term holders are at a loss, while 47% of all Bitcoin in circulation is now underwater, reflecting levels seen during the most challenging weeks of February.
This decline is significant as long-term holders had only recently resumed selling at a profit.
By the end of the most recent week, the SOPR had decreased to 0.724, reversing six weeks of progress and leaving long-term holders selling at their most substantial losses in three years. Short-term holders also faced pressure, with realized profit and loss dropping to its lowest point since late January.
The trend resembles earlier breakdown phases. CEX.io compared the current situation to mid-2018 and mid-2022, when a similar divergence occurred between price movements and on-chain conviction before Bitcoin experienced another decline.
The firm stated that the latest increase in its stress index was the most pronounced since late January, when Bitcoin entered one of its most challenging periods of 2026.
Importantly, market liquidity has diminished concurrently. Stablecoin net flows to exchanges shifted from a strongly positive daily average to a significantly negative figure, removing one of the market’s essential supports.
Data from SosoValue indicated that spot Bitcoin ETFs experienced $296 million in net outflows in the week ending March 28 after four consecutive weeks of inflows, while spot Ethereum ETFs lost $206.58 million.
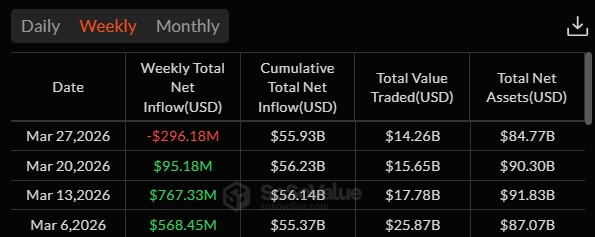 US Bitcoin ETFs Weekly Flows in March 2026 (Source: SoSoValue)
With institutional flows retracting, the responsibility for support shifts back to spot buyers, long-term holders, and short covering.
Mining economics are adding another layer of strain. Between 15% and 20% of miners are currently unprofitable after the hashprice rate fell to a post-halving low of approximately $28 per petahash per second per day in February.
Their high energy costs have heightened the risk of treasury selling, while Bhutan’s consistent Bitcoin sales have reinforced the broader perception of supply overhang in the market.
Related Posts
 Related Reading
BlackRock’s Bitcoin ETF boom still falls short of what it needs to make serious money
BlackRock's crypto ETF, IBIT, leads the way with rapid asset growth, attracting institutional investors unlike any other fund.
Mar 25, 2026 · Oluwapelumi Adejumo
History points to a longer recovery
Meanwhile, the rationale for caution extends beyond price targets. Ecoinometrics, a BTC analysis platform, stated that any rapid recoveries in Bitcoin seldom occur in isolation and typically necessitate a broader shift in the macro environment, often involving a change in monetary policy.
This environment has not yet become supportive enough to warrant expectations of a swift rebound.
The firm’s drawdown analysis elucidates this point. Examining Bitcoin cycles since 2014, Ecoinometrics identified a consistent correlation between the severity of a selloff and the duration required for the market to fully recover.
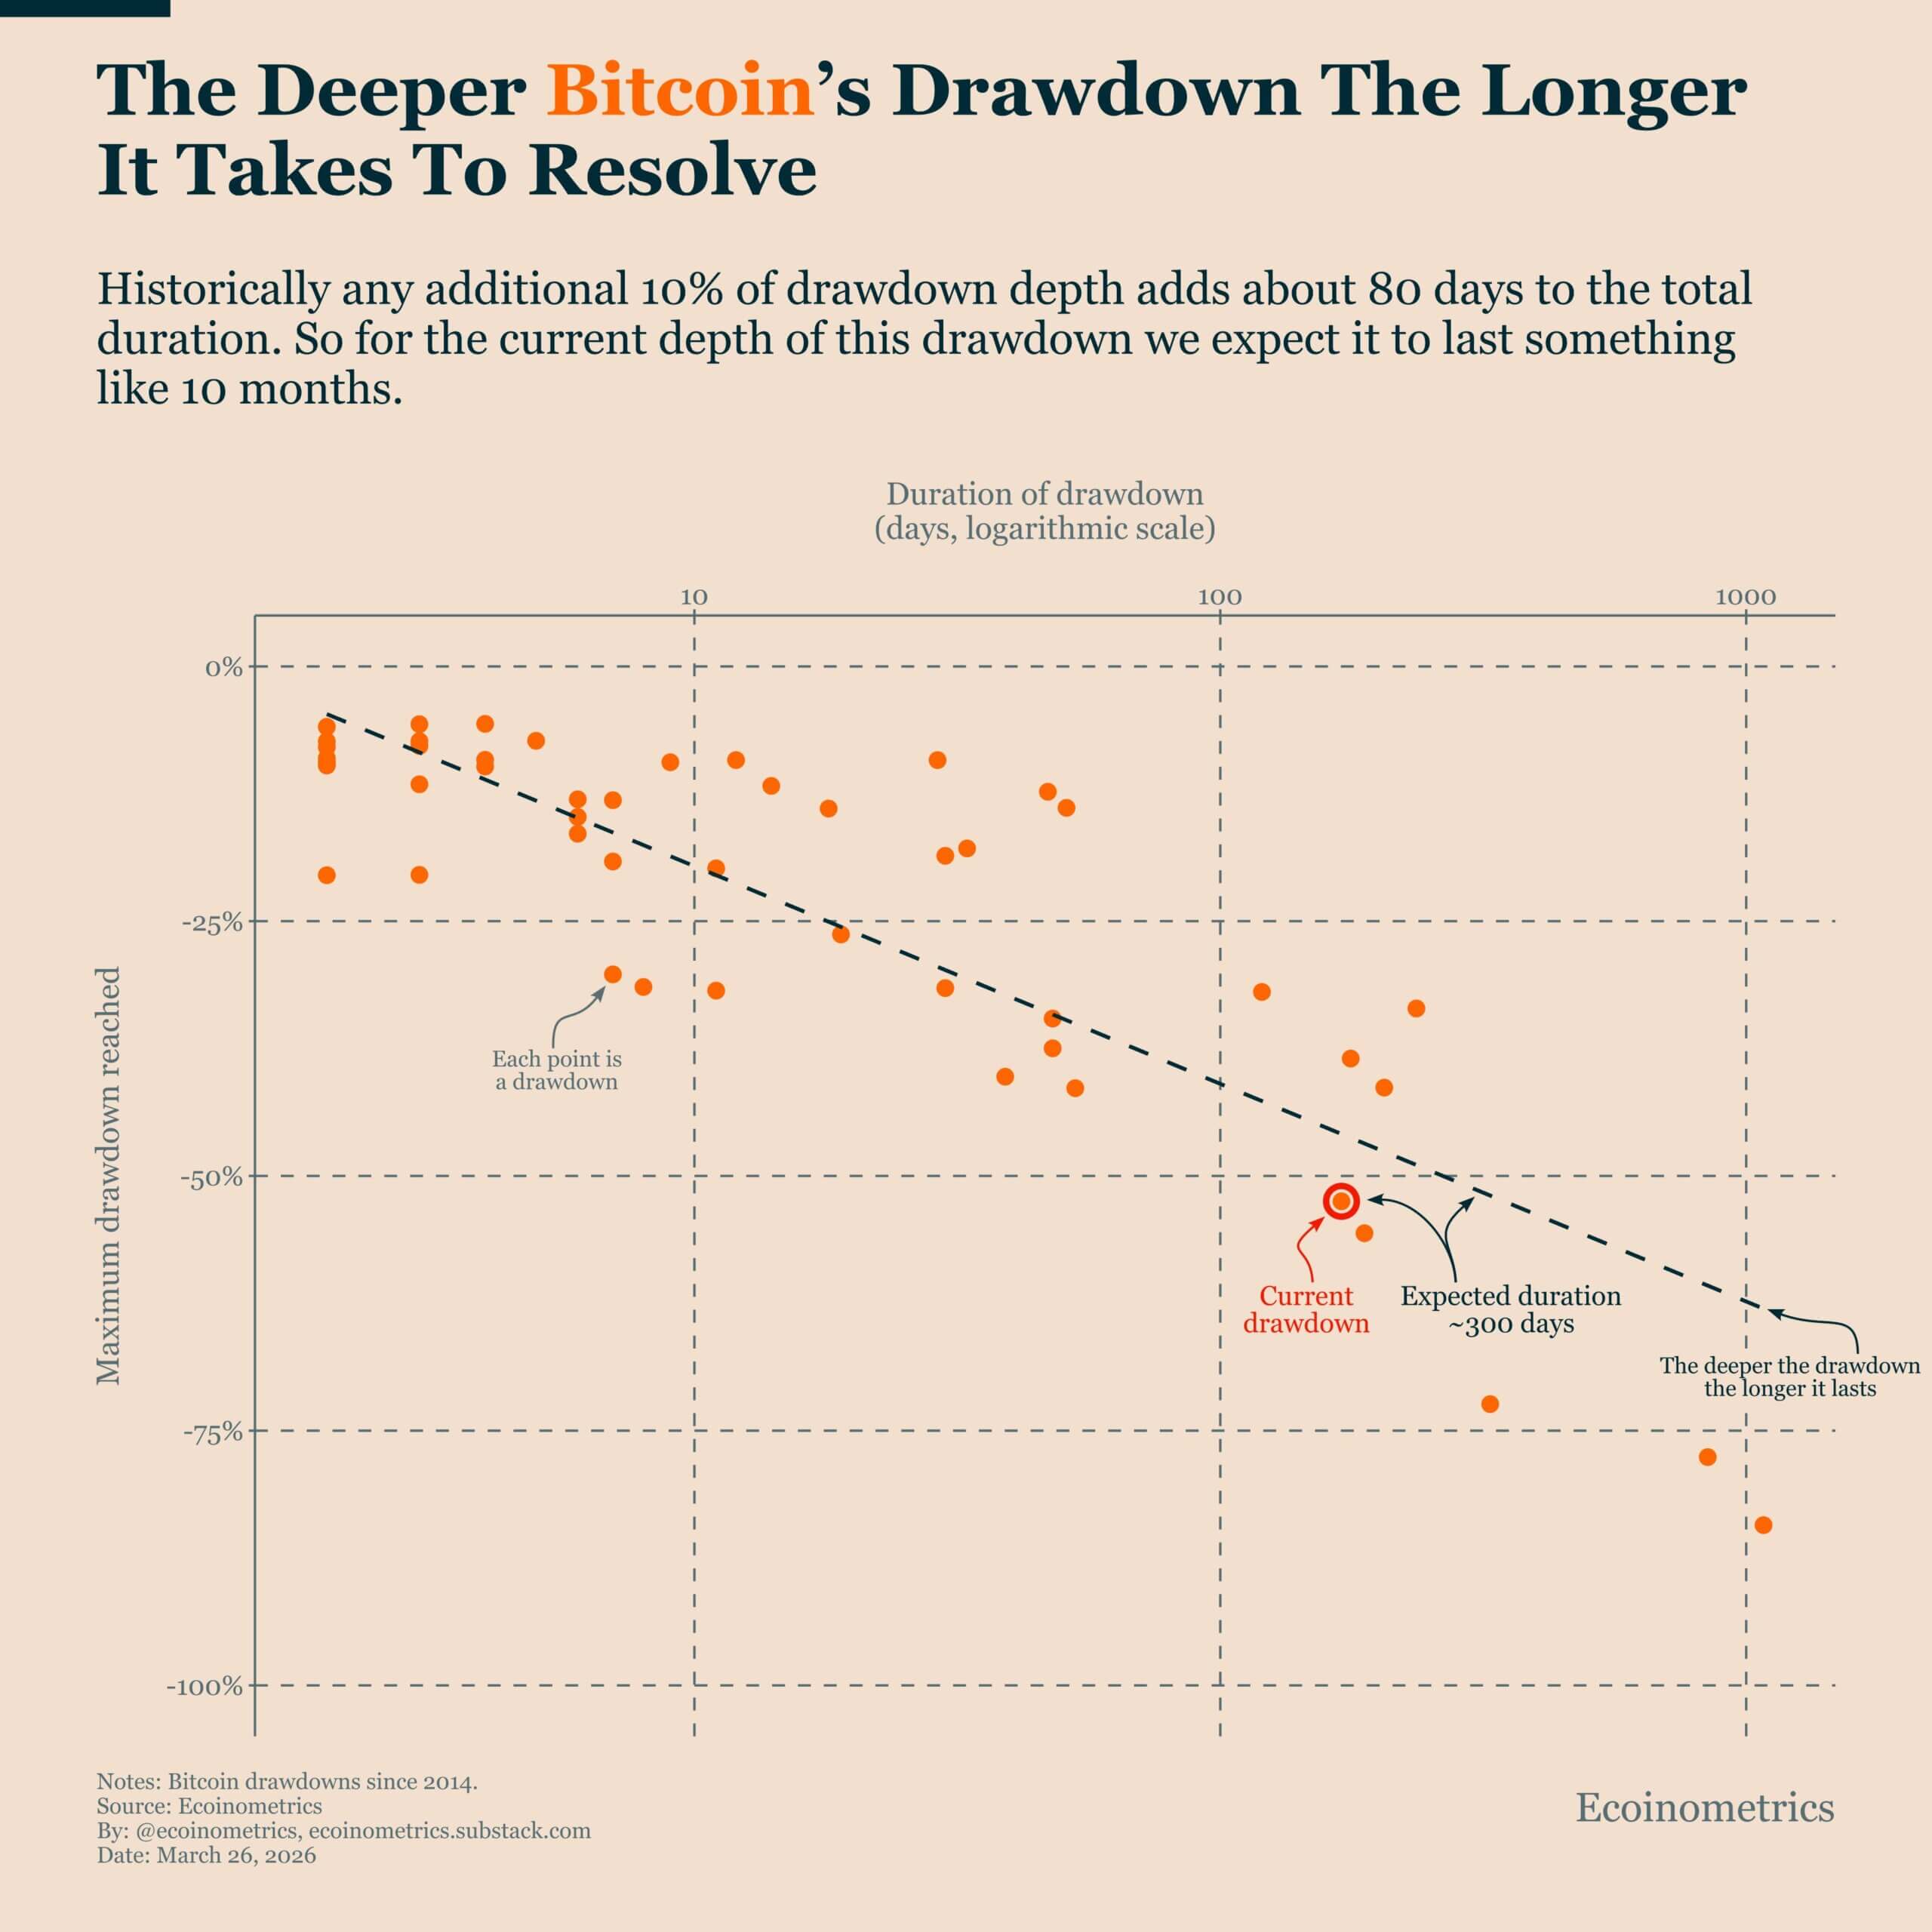 Bitcoin Drawdown Analysis (Source: Ecoinometrics)
For every additional 10% of drawdown depth, the total duration has typically extended by approximately 80 days. Based on this, the current decline suggests a recovery period of around 300 days, with the market only about halfway through.
This does not eliminate the possibility of rallies. Bitcoin can rebound, consolidate, and retrace multiple times before a complete recovery materializes.
However, historical patterns indicate against a straightforward return to previous highs. Even if the market is approaching a credible floor zone, the journey out of that zone may be slower and more erratic than bullish traders would prefer.
This is where the lower bottom models and the slower-repair thesis begin to converge. A token can be near a washout range without being prepared for a sustained new uptrend.
For a sustained uptrend to occur, price support must be accompanied by stronger demand, more consistent institutional flows, and a macro backdrop that is no longer tightening financial conditions.
 Related Reading
Bitcoin price projected to bottom at $35,000 in December by model that timed the last two market tops
Bitcoin Monte Carlo backtest accurately predicted the last drawdown and highlighted the one metric that continues to falter.
Feb 28, 2026 · Liam 'Akiba' Wright
Macro calendar takes over
The timeline for recovery, already assessed in months rather than weeks by several analysts, now depends on a busy schedule of US economic data commencing Monday with Fed Chair Jerome Powell's appearance at Harvard University.
Federal Reserve Chair Jerome Powell is set to participate in a moderated discussion at Harvard University on March 30, and the Bureau of Labor Statistics is expected to release the March employment report on April 3.
In the interim, investors are also monitoring consumer confidence data and labor market statistics for indications of whether inflationary pressures from rising energy costs are beginning to intersect with softer growth.
In this context, the market is attempting to assess whether policymakers are confronting a temporary shock or a combination that maintains restrictive rates for an extended period.
Bitcoin’s connection to this discussion has become more direct. The leading digital asset is trading near the lower end of the cost-basis range for newer buyers while oil, yields, and labor market expectations continue to influence cross-asset risk appetite.
A weaker labor report combined with reduced energy stress could help stabilize financial conditions and provide Bitcoin with the capacity to maintain support. Conversely, a stronger jobs report alongside persistent inflation expectations would indicate the opposite, sustaining macro pressure and leaving the market susceptible to another decline.
Currently, the Bitcoin market finds itself between a scenario that is beginning to appear statistically inexpensive and a macro environment that has yet to decisively shift in a supportive direction. The models suggesting a range of $45,000 to $54,000 do not ensure that prices will trade within that range.
Rather, they indicate that the market’s assessment of capitulation has shifted lower, and that any sustainable recovery is likely to rely as much on the next turn in the macro cycle as on the subsequent bid in crypto itself.
The post Bitcoin faces impending $45,000 sell-off catalyst as Powell, jobs report threaten fresh macro pressure appeared first on CryptoSlate.